


 English (pdf)
 Article in xml format
 Article references
 Send this article by e-mail
 Cited by SciELO
  Cited by Google
  Similars in
SciELO
Similars in
SciELO  Similars in Google
 Permalink
Introduction
Distribution systems are a fundamental part of the electric power system; however, they account for the highest percentage of losses Swapna & Udaykumar, 2016. The growing electric power consumption, driven by various human activities, has led to an increased demand for a better quality of service (Carrión González, 2011). This increase in load also generates more power losses and risks to the system, such as overloading, which results in higher costs to the end user (Zhu et al., 1998). An increase in unbalanced load causes unbalanced voltages, even when the source voltage is balanced, which can damage equipment and reduce its useful life (Tuppadung & Kurutach et al., 2006). Overall, these situations lead to a reduction in the efficiency of the distribution system (Zhu et al., 1998).
A direct and efficient solution to mitigate the adverse effects of this issue is phase balancing, which involves reconfiguring or interchanging the phases connected to the load (Swapna & Udayku-mar, 2016). Several methods have been used to determine this phase reconfiguration, including meta-heuristic algorithms aimed at reducing the total losses of the distribution system. To achieve this, the losses for multiple-phase connection configurations are calculated using an iterative process. The configuration with the lowest percentage of losses is considered the optimal solution for load reconfiguration in demand nodes. The approach to finding an optimal solution varies depending on the method and algorithm used. In this study, the arithmetic optimization algorithm is implemented to address the phase balancing problem (Granada Echeverri et al., 2012).
Motivation
An electric power system consists of several stages, with the primarily objective of transporting energy from generation centers to the end users, delivering it economically, safely, and with the required quality levels (Ramirez Castaño, S., 2019). One such stage, energy distribution, constitutes a significant part of the electrical power system. As a result, it has received considerable attention in terms of quality regulation, enabling network operators to manage service conditions in favor of continuous improvement. This focus has driven ongoing processes of evolution and improvement, reflected in the type of techniques, equipment, and tools used for this purpose (CREG 2008). In this context, the present research aims to apply a new technique to the PB problem, seeking to minimize the power losses caused by three-phase distribution systems. For this purpose, the phase-balancing problem is addressed using the arithmetic optimization algorithm (AOA), with the goal of determining the set of optimal connections for the system loads, thus reducing the phase unbalance and finding an optimal operating point.
State of the art
The phase-balancing problem (PBP) has been addressed through various methods in the current literature. Zhu et al., 1998 formulated the optimal phase-balancing problem using linear-constrained integer programming (approximated modeling), aiming to reduce the unbalance in line currents in distribution systems. The authors (Zhu et al., 1999) proposed a solution to PBP using a metaheuristic algorithm called Simulated Annealing, seeking to minimize total operating costs. Chen & Cherng formulated a solution for the PBP using a genetic algorithm optimization technique. Their objective was to minimize the phase imbalance in the whole system. (Gandomkar et al., 2004) solved the PBP problem using a genetic-based optimizer. They sought to reduce power losses in distribution systems. In the study conducted by (Lin et al., 2005), PBP was resolved by employing a heuristic search algorithm with backward recurrence, which minimized the phase unbalance and reduced the neutral current. (Garcés-Ruiz et al., 2005) developed a solution methodology for the PBP using an ant colony optimization algorithm, which helped them minimize energy losses over a 24-hour period in distribution systems.
(Tuppadung & Kurutach et al., 2006) proposed a particle swarm optimization algorithm to solve the PBP. They reduced power losses and improved voltage profiles. In (Lin et al., 2008), the PBP was formulated using an expert system based on heuristic rules, aimed at minimizing system operating costs. (Huang et al., 2008), in turn, solved the PBP using an immunological optimization algorithm in which they reduced the operating costs of the system over a 24-hour period.
(Kuo & Chao 2010) approached the PBP using automatic phase shifting by mapping the information of the system—taking into account technical characteristics and load flow—to determine the phase rearrangement that results in the lowest power losses. (Srinivasan et al., 2011) and (Sathiskumar et al., 2012) resolved the PBP by developing a fuzzy hybrid greedy heuristic algorithm and a self-adaptive hybrid differential evolution algorithm, respectively. The main goal was to minimize the phase unbalance of the system based on load flow equations, capacity, and voltage restrictions, thus balancing the current flowing through the phases of the system and reducing the current flowing through the neutral. (Hooshmand & Soltani et al., 2012) proposed a methodology to determine PBP based on bacterial foraging guided by a particle swarm optimization algorithm. The study aims at minimizing the operating costs of the system, whether radial or meshed. In addition, (Granada Echeverri et al., 2012) solved the PBP employing a genetic-based optimizer. With this, their main goal was to minimize energy losses in distribution systems. As a result, there was evidence of improved voltage profiles and reduced congestion on the lines of the system.
(Grigoras, & Gavrilas, et al., 2016) approached the PBP using a heuristic method based on phase exchange for load balancing, aiming to minimize the degree of system unbalancing. Swapna & Udaykumar formulated the PBP on the IEEE 13-node test system using a balancing algorithm that evaluates possible phase exchange combinations for each candidate node until the combination that balances the system is chosen. (Nicusor Toma et al., 2018), in turn, presented a methodology for solving the PBP using the particle swarm optimization algorithm, with the primary objective of minimizing voltage imbalance in the distribution network. Fadhela & Abdulmuttalib T., proposed minimizing total voltage unbalance in distribution systems through a heuristic search algorithm, which determines how to change phases using contactors located in the load terminals.
(Gangwar & Chakrabarti et al., 2019) adopted an analytical approach to the problem, ensuring that phase interchanges were kept to a minimum. The objective was to reduce unbalancing in distribution systems and power losses, as a result. (Ovidiu I et al., 2009) proposed a different solution by employing a genetic optimizer to reduce energy losses over a 24-hour period (daily operation scenario).
(Cortés-Caicedo et al., 2021a) solved the PBP problem through a metaheuristic optimization technique called the vortex search algorithm, which requires discrete codification. The objective of the function was to minimize the power loss of the distribution system.
Finally, (Sarmiento & Ávila et al., 2022) offered an alternative solution for the PBP. Using a discrete version of the whale optimization algorithm, they aimed to reduce active power losses in all branches of the distribution system.
It is important to note that the main characteristics of the previously reviewed literature are as follows:
Most optimization methodologies are based on combinatorial optimization approaches. These works under a master-slave optimization concept, i.e., the metaheuristic optimizer defines the nodal connections. The slave stage determines the value of the objective function using a three-phase unbalanced power flow approach.
The most common objective function corresponds to minimizing expected grid power losses. This objective is effective in modeling the problem of load unbalance in asymmetric distribution systems due to the nonlinear relationships between voltages and demanded currents.
In summary, the PBP encompasses multiple objectives and solution techniques that lead to the search for improved power quality delivered by the grid operator to the end users in an efficient and cost-effective manner. According to the previously mentioned, the arithmetic optimization algorithm (AOA) has not been applied as a solution alternative for the PBP in asymmetric distribution systems. In this study, we will propose to use it to select the best load connection combination as a contribution to the current literature. It is also worth noting that, within the scope of this work, and consistent with the literature review, we adopt the minimization of power losses under peak load conditions as the objective function. In addition, all the impedance parameters of the systems are well-known, and the peak load information and their connections correspond to input data for the optimization model.
The remainder of this research is structured as follows: Section Mathematical formulation presents the general mathematical formulation of the PBP for three-phase unbalanced distribution grids. The proposed solution methodology based on the application of the AOA is described in Section Proposed solution methodology; Section Test Systems shows the 25 and 37 node test systems used for the AOA implementation; In section Results and comparisons, the results are analyzed and compared with other optimization algorithms; and finally, the section Conclusions and future works presents the conclusion of this study as well as proposing essential points for future work derived from this study.
Mathematical formulation
A mixed-integer nonlinear programming (MINLP) model represents the PBP in asymmetric distribution networks. Binary variables are the decision variables, which correspond to the connections established for each load presented in the system (Arias et al., 2019). On the other hand, continuous variables are associated with the classical power flow formulation, which uses magnitude and voltage angle for each node (Montoya et al., 2020b). Finally, the nonlinear nature is the result of the trigonometric functions present in the power balance equations and the products between the magnitudes of the nodes (Gil-González et al., 2020).
The MINLP formulation that describes the PBP is formulated below:
Objective Function
In this research, the objective function for the PBP aims at minimizing the total active power loss of the asymmetrical distribution system in (1).
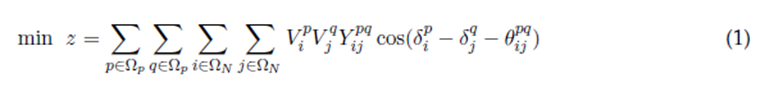
where z represents the value of the objective function; Ω p is the set associated with the phases of the system; Ω N is the set associated with the nodes of the system. V p i and V q j are the voltage magnitudes and the phase p and phase q in the nodes i and j, respectively. δ p i and δ p j are the angles of the voltage
at the phase p in the nodes i and j, respectively. Y pq , is the magnitude of the admittance associated with the line connected between the nodes i and j in the phases p and q with an angle denominated as θ pq ij .
Restrictions
The set of constraints corresponds to the operational limitations found in any asymmetric distribution system. These are shown in equations (2) to (11). Equality constraints (2) to (4) correspond to the active power equilibrium at each node and phase.


where P gA , P gB , and P gC are the active power injected by a conventional generator in phases A, B, and C at each node i, respectively. P dA , P dB , and P dC are the active power demanded in each type of connection h, in phases A, B, and C at node i, respectively. X ih represents the binary decision variable, which takes the value of 1 if the connection h is selected for node i and in any other case.
Observe that the binary variable X ih will have to select among h possible connections for the loads of demand nodes i present in the distribution system, as shown in Table 1.
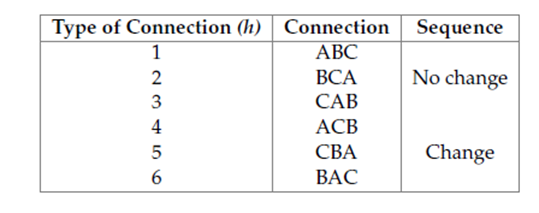
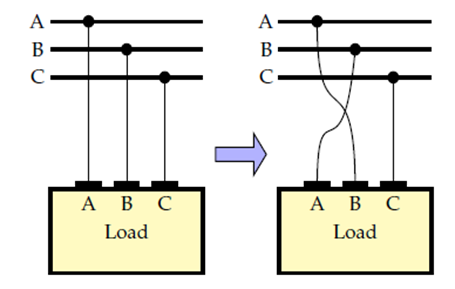
Figure 1 presents a possible change in connection from the original ABC connection to the BAC connection, which implies a sequence change.
It is important to mention that if there are no three-phase loads on some of the nodes, then for these phases a zero value is assigned in the connection (Granada Echeverri et al., 2012).
The set of equality constraints (5) to (7) shows the reactive power balance constraint per node and phase, respectively.

where Q gA i , Q gB i , and Q gC i are the reactive power injected by a conventional generator in the phases A, B, and C at the i node, respectively. Q dA ih, Q dB ih, and Q dC ih , are the reactive powers demanded for the type of connection h, in phases A, B, and C, at the i node, respectively.
The set of box-type constraints (8) to (10) corresponds to the voltage regulation constraints per phase at node i at each phase.
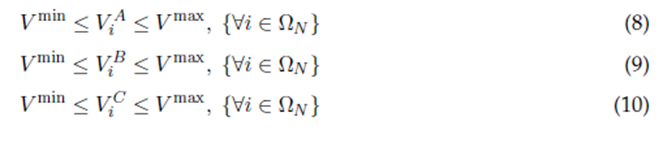
where V min and V max correspond to the minimum and maximum voltage regulation limits permitted by regulatory entities in medium-voltage levels.
Finally, the equality constraint (11) defines the unique nature of each load connection per phase, that is, only one of the load combinations in Table 1 can be assigned to a particular node i.

Remark 1 The MINLP model that represents the PBP in three-phase asymmetric distribution networks defined from (1) to (11) is only applicable to three-phase networks with solidly grounded connection in the neutral wire at each demand node being all the constant power load connected in star form. In the case of loads connected in triangle, additional equations must be added to the optimization model.
Proposed solution methodology
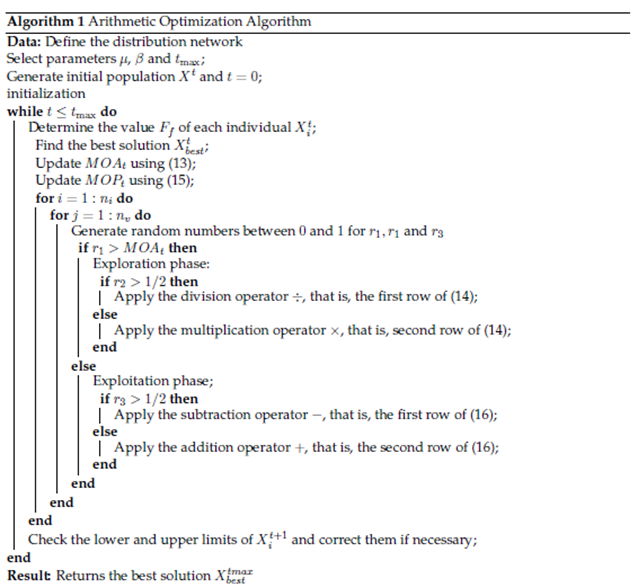
In this research, the PBP in three-phase asymmetric distribution networks is addressed through the application of a master-slave optimization approach, where AOA is implemented in the master stage to define nodal load connections. The three-phase backward/forward power flow method is used in the slave stage to determine the value of the power losses of the system. The main aspects of the proposed optimization approach are described below.
Master stage: Arithmetic optimization algorithm
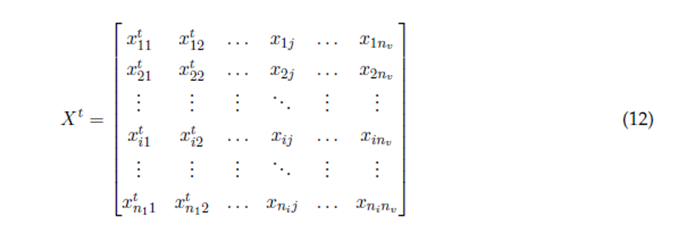
The AOA is an optimization algorithm recently developed that explores and exploits the solution space using the distribution of the four main arithmetic operations (multiplication, division, subtraction. and addition) (Hraiz et al., 2020). This algorithm can be classified as an optimizer based on population that evolves from a solution set through arithmetic advance rules to a final solution. The initial population is represented in (12) where x ij is the value of the variable j for the i th individual in the population. Note that n v is the number of variables, and n i is the number of individuals.
To explore the solution space, the AOA uses the acceleration function 13, which depends on its maximum and minimum values (MOA min) and (MOA max) as well as the current iteration counter t and the maximum number of iterations t max.
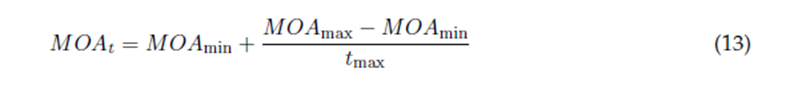
Note that MOAt can be considered a variable optimization factor that enhances the exploration and exploitation characteristics of the AOA.
Exploration phase
During the exploration phase, the AOA uses properties of the arithmetic operator division and multiplication, exploring the search area randomly in several regions and getting closer to finding a solution and generating the position of the individual ith using the evolution rule defined in (14).
The MOA function conditions this search phase, i.e., (r1 > MOAt).
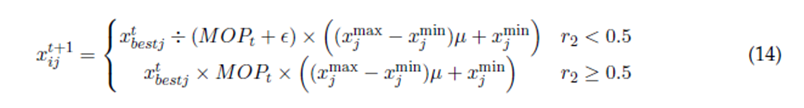
where x t+1 indicates the j th position of the i th solution in the next iteration, and x t is the j th
ij bestj
position of the best solution obtained at the moment; x max and x min are the upper and lower limit
j j
value of the j th position, respectively and MOP t is a variable factor that depends of the iteration number with the structure of (15):
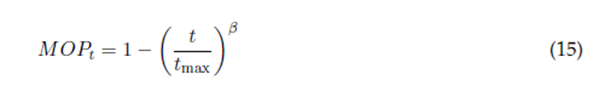
where β is a sensitive factor that helps improve exploration accuracy, which is set as 0.2 based on the experiments made by the authors (Abualigah et al., 2021). Note that ϵ is a factor that avoids divisions by zero, but it is small enough not to affect the results and can be selected the same as the tolerance ε used to test the convergence in power flow; moreover, r 2 is control parameter set as 0.5 based on the recommendations of (Abualigah et al., 2021).
Exploitation phase
During the exploitation phase, the AOA uses the advantages of the arithmetic operators, subtraction, and addition, since these produce small variations around the current solution X t , which allows it to get closer quickly to the nearest optimal solution that can be deduced after several iterations. The rule in this exploitation phase is defined in (16).
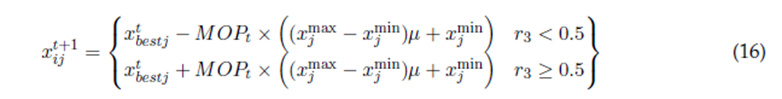
The evolution rules in (16) show that the new individual gets its new values by adding or subtracting positions (depends on the value of the random number r 3 which varies between 0 and 1 with uniform distribution), which are considered smooth variations around the current position, which in heuristics means, the exploitation of the solution space.
The procedures in this phase are similar to the partitions in the previous phase. However, the subtraction and addition operators usually prevent the optimization algorithm from getting stuck in a local nature solution (55). This procedure helps exploratory search strategies to find the optimal solution and maintain the diversity of candidate solutions.
It should be noted that each new individual generated in the exploration and exploitation phases must be reviewed to ensure that each new position x t+1 is between its maximum and minimum limits, i.e., x max and x min to ensureiability of the solution space.
Moreover, the first positions of the new solution vector X t+1 , are rounded close to integer values since they correspond to the nodes where the set of connections for the loads on each node will be defined; i.e., they must always be integer values. The application of the described AOA can be performed following Algorithm 1
Slave Stage: Three-phase iterative sweep power flow
An acknowledged method for solving the power flow problem in distribution networks is the backward/forward power flow approach (also known as the iterative sweep method). This is based on representing the topology of the network through an incidence matrix that relates the connections between the nodes of the system and also represents the branches present in the network (Cortés-Caicedo et al., 2021a). Using the laws of Kirchoff, the currents in the nodes of the system are calculated, making a sweep from the end nodes to the generation nodes. From these obtained currents, the voltage drops in each segment of the network are calculated, this time sweeping from the generation node to the terminals (Shen et al., 2018).
The following equation solves the three-phase power flow (17), and taking as reference a distribution system with n nodes:
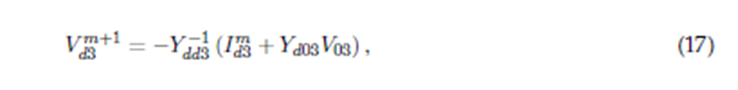
where the matrix Y dd3 represents the system’s topology, i.e., the connections between the demand nodes of the system. This matrix is square in dimension: 3(n − 1) × 3(n − 1). The vector I d3 represents the demand currents in each node, calculated from the power in each node and the type of connection, star or delta, at those nodes. The dimension of this matrix is 3(n − 1) × 1. The rectangular matrix Y d03 represents the system topology considering the generation and demand terms. The dimension of this matrix is 3(n − 1) × 3. Note that V 03 is the vector that represents the voltages for each phase of the system generation node with a dimension of 3 × 1. The vector V d3 with dimensions 3(n − 1) × 1, represents the three-phase voltages demanded in each of the load nodes of the system.
The algorithm starts defining parameters, such as the number of iterations and the maximum acceptable error allowed for the algorithm to stop. For the maximum iterations, a value of m max = 1000 iterations is defined, while for the maximum error allowed, named ϵ, a value of 1 × 10⁻¹⁰ is defined.
Remark 2 The iterative sweep power flow method in (17) depends on the type of load per node (△ or Y connection), i.e., the calculation of the demand current I m at the iteration m. To study in detail its algorithmic implementation, see Ref. (Shen et al., 2018).
Test systems
In this section, in order to show the efficiency of the optimization method proposed in the methodology section, the information of two unbalanced test systems is used, present in the specialized literature. The test systems correspond to the IEEE 25 and 37 node radial distribution networks reported by (Cortés-Caicedo et al., 2021a) to study the phase balancing problem. The features of the test systems are shown below.
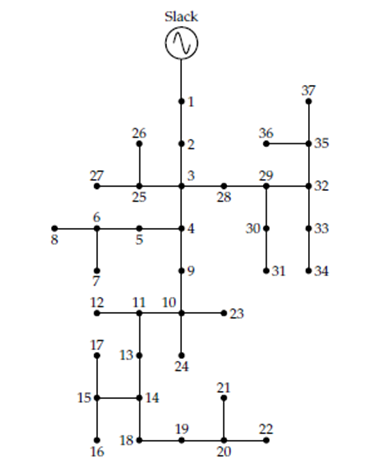
IEEE 25-node test system
This is a radial unbalanced distribution system with 25 nodes, 24 lines, and 22 loads. The source is located at node 1 and the nominal voltage is 4.16 kV. The electrical configuration of this system can be seen in Figure 2. The total active and reactive power consumption is 1073 kW, and 792 kvar for phase A, 1083.3 kW and 801 kvar for phase B, and 1083.3 kW and 800 kvar for phase C. Load consumption per phase and impedance matrices per type of conductor are shown in the work of (Cortés-Caicedo et al., 2021a). Note that the electrical parameters, i.e., impedance, line lengths, and load values can be consulted in (Cortés-Caicedo et al., 2021a).

IEEE 37-node test system
The IEEE 37-node test system is a real radial unbalanced distribution system located in California, totally composed of underground lines. It has 37 nodes, node 1 being the source, 35 lines, and 25 loads. It has a transformer that operates in an unbalanced form and a voltage regulator. The nominal voltage is 4.8 kV. The electric configuration of this system can be seen in Figure 3. The total active and reactive power consumption is 727 kW and 357 kvar for phase A, 639 kW and 314 kvar for phase B, and 1091 kW and 530 kvar for phase C. The load consumption per phase and the impedance matrix information per type of conductor can be found in (Cortés-Caicedo et al., 2021a).
Results and comparisons
In this section, the proposed master-slave methodology is tested. For comparative purposes, the AOA with the iterative sweep power flow proposed in this research is compared with two combinatorial optimization methods available in the current literature for solving the phase-balancing problem, i.e., the Chu & Beasley genetic algorithm (CBGA) (Montoya et al., 2021), and the crow search algorithm (CSA) (Cortés-Caicedo et al., 2021b), respectively. The following sections present the main results for the benchmark case of each test feeder (the power flow solution) as well as the results of the proposed optimization approach with analysis and discussion. Observe that all the numerical validations are carried out in the MATLAB software in its 2020a version on a laptop computer, Intel(R) Core(TM) i5-6200U @2.30 GHz processor with 12.00 GB of RAM running Windows 10 Home Single Language operating system running at 64 bits.
Parametrization of the proposed master-slave optimization method
To implement the proposed master-slave optimization method based on the hybridization of the AOA approach with the iterative sweep power flow method and its application to the problem of optimal phase balancing, the list of parameters in Table 2 is considered.

Solution of the three-phase power flow problem
Table 3 presented the results obtained by implementing that method. Note that the power losses, iterations, and processing time are the same as those reported by (Cortés-Caicedo et al., 2021a).
Table 3 Power flow solution in the IEEE 25- and 37-bus grids with the iterative sweep power flow approach.

The main characteristic of the numerical results in Table 3 is that for both test feeders, the efficiency of the iterative sweep power flow method was compared with the Newton-Raphson power flow method for unbalanced distribution grids available in the DIgSILENT software.
Results for the 25-Node test system
Table 4 presents the results obtained by the proposed AOA methodology in the 25-bus grid. It shows that the AOA is 4.1556% more efficient than the standard connection present in the benchmark case, resulting in a reduction of 3.1340 kW. Note that the proposed AOA is only 7.46 × 10⁻³ more effective in minimizing power loss compared to the CBGA and 0.0595% compared to the CSA.
Table 4 Performance of the power losses after implementing the phase-swapping in the 25-Node Test System

The small difference between the proposed and compared optimizers in this test feeder shows that, in general, the phase-balancing problem can be solvable with different metaheuristics efficiently with minimum differences in the final solution value with respect to total grid power losses; nevertheless, more research is required since due to the large dimension of the solution space, it is impossible to ensure the global optimum finding, which implies that the results in Table 4, are local optimal solutions.
On the other hand, Figure 4 compares before and after implementing the AOA phase swapping methodology in the 25-node test system. It is possible to observe that 11.38 kW increased the losses in phase B, representing a 76.99% more power loss in that phase. In addition, reductions of about 11.22 kW and 3.3 kW were found for phases A and C, respectively, representing an improvement of approximately 30. 423% and 13. 88% in each phase.

Source: Authors
Fig. 4 Effect of the optimal phase-swapping on power losses in the 25-node test system for each phase.
Figure 5 shows a comparison between the methodologies presented in Table 4 in terms of the percentage of power loss reduction. Note that all methodologies have a 4% minimum reduction, and AOA obtains a 4. 155% reduction, which means that it is a robust methodology capable of obtaining efficient results.

Source: Authors
Fig. 5 Reduction of the power losses in the 25-node test system for each combinatorial optimization method
To better understand the performance obtained with AOA, Figure 6 shows the voltage profile for the phases A, B, and C, respectively. Note that Figure 6 shows that the voltage per load node follows a similar behavior to the benchmark case, in general terms, the unbalance present in the benchmark case has been reduced except in phase B, where the voltage drops increase compared to two other phases A and C where the voltage drops are reduced in those phases, phase C drops close to the benchmark case.

Source: Authors
Fig. 6 Voltage phase profiles of the 25-node test system, comparison of the benchmark case and the proposed optimization method
Furthermore, after 100 consecutive evaluations of the proposed methodology AOA for the 25-node test system, the best solution is 72.2865 kW, and the CBGA found the best solution after doing 550 iterations is 72.2919 kW. In terms of processing time, it is important to note that the AOA took 55 seconds to find the optimal solution, 87.13% longer than the CSA and 194. 86% longer than the CBGA, which, although in practice does not represent something significant, the difference is in seconds of execution which, in comparison to the solution space of size 1.3162 × 10¹⁷, shows considerable efficiency in time and provides an excellent opportunity to analyze better ways of exploiting and exploring the solution space using the AOA to improve the performance of the same since this is a relatively recently developed optimization algorithm.
Results for the 37-Node Test System
Table 5 presents the results obtained from the AOA for the 37-bus system. The results and comparisons show that AOA reduces the total power losses by 19.2498% from the benchmark case, which means a loss reduction of 3.1319 kW. In terms of CBGA, AOA is 0.1604% better than CBGA, where AOA reduces losses by 98.8 W more than CBGA. With the CSA, the AOA is 0.2867% better than the CSA, where the AOA reduces losses by 176.8 W more than the CSA.
Table 5 Performance of the power losses after implementing the phase-swapping in the 37-node test system
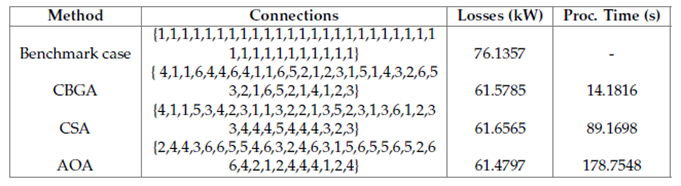
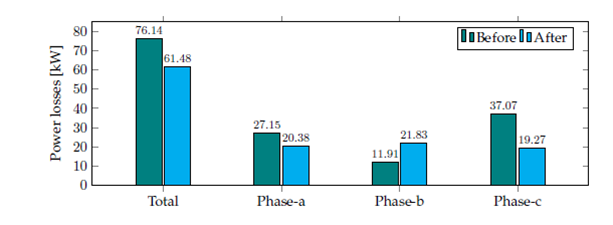
Figure 7 compares the power loss reduction per phase before and after the phase-swapping proposed by the AOA. Phases A and C present a power loss reduction, of 11.22 kW and 3.30 kW, respectively. Meanwhile, phase B presents a power loss increase of 11.38 kW. The total power losses are obtained by adding the power losses per phase, and this was previously presented in Table 5.
Source: Authors
Fig. 7 Effect of the optimal phase-swapping on power losses for the 37-node test system.
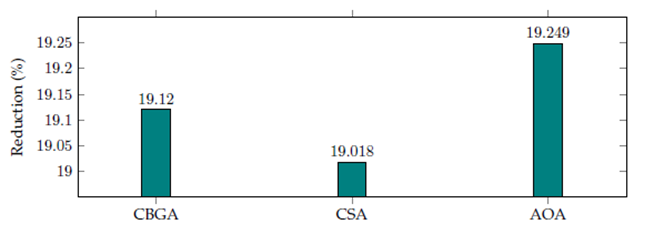
Figure 8 shows the loss reduction in percentage terms. This compares the benchmark case with the other optimization algorithms and the AOA. The CBGA, CSA, and AOA have a loss reduction of 19.1201%, 19.0186%, and 19.2498% from the benchmark case, respectively. The optimization algorithms have similar behavior, all of them reduced the power losses by about 19%, which represents a reduction of more than 14 kW in total power losses in the system.
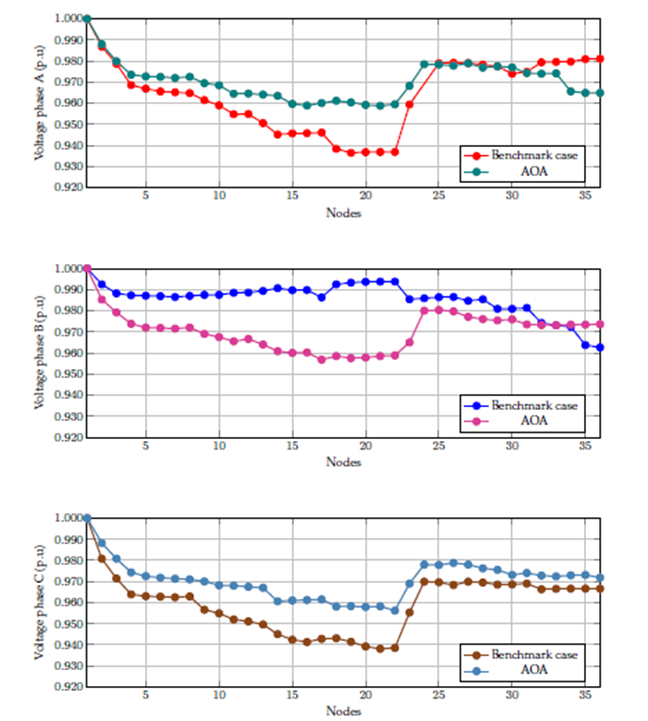
The voltage profiles per node of the system are presented in Figure 9, this complements the results presented in Figure 7. It shows the voltage behavior on each node compared with the benchmark case. The effects of phase-swap increase the voltage profiles on phases A and C. For phase C, all the node’s voltage profiles are better than the benchmark case, but in phase A, this does not occur, the voltage profile in some nodes decreases, as in nodes 25, 26, 27, 28, and 29. The opposite occurs in phase B, here, the voltage profiles decrease, which is caused by the power losses increment in this phase. Regarding processing times, the average time to processing was 178.75 s after 100 consecutive evaluations. The 37 node system has 2.843 × 10¹⁹ possible combinations for its 25 loads, which represents an enormous space solution. This means that the AOA works well for large systems.
Conclusions and future work
The results obtained in this comparative study show that the AOA algorithm is highly effective in optimizing asymmetrical distribution power systems in terms of power loss minimization. The compared optimization methods, CSA and CBGA, also showed significant improvements in system efficiency, but the AOA shows a slightly better performance in solving power loss minimization problems. In particular, the AOA algorithm was found to be robust in terms of solution accuracy, suggesting that it can be a valuable tool for optimizing asymmetric distribution power systems in practice. Furthermore, the IEEE 25-node and 37-node test systems proved to be useful in validating the results obtained in simulations of real distribution power systems, suggesting that these models are a valuable tool for research and development in this field. In general, these findings highlight the importance of implementing efficient optimization techniques in asymmetric distribution power systems and suggest that the use of standardized test models can improve the operating characteristics of those systems.
For this research, the arithmetic optimization algorithm was presented to address the phase balance problem in radial distribution networks. With the AOA work, the best set of load connections was found for 25 and 37-node systems, respectively. The optimization methodology consisted of a master-slave solution approach. The slave stage was responsible for determining the operative state of the system as the voltage in all the system nodes, the power losses in each node, and the general operative characteristics of the distribution network under study. The master stage defined the initial conditions for the slave stage, i.e., the set of load connections applicable to each node.
The AOA shows that it can be compared with other optimization algorithms. Even AOA, a recently developed algorithm, showed better numerical results compared to CBGA and CSA. The results for the two test systems, that is, the IEEE 25 and 37 node grids, presented a reduction in total power loss of approximately 4.155 % and 19.249 %, respectively. These results confirmed that the AOA is an efficient optimization algorithm that can be extended to new optimization applications in electrical engineering.
Technological advances come with new challenges. Likewise, tools must be developed to address these problems. The AOA is presented as a new tool for solving problems like the one studied in this research. Once the effectiveness has been evaluated, showing that satisfactory results are obtained with AOA in terms of total loss reduction, efficiency should be mentioned. An average time of 55.0470 s was presented for the IEEE 25-node system, while the average time for the IEEE 37-node grid was 178.7548 s because the processing time for the algorithm in the master and slave stages is higher compared to CBGA and CSA. The algorithm explains this due to the two phases it composes, the exploration and exploitation phases, in addition to the parameters. This means more computational load and, therefore, a longer processing time.
Previously, it was mentioned that AOA is recent, and there is still more development on this algorithm to discover its potential. So, in future work, it is proposed to apply the AOA to electrical problems such as optimal location and sizing of compensators, batteries, and STATCOMS, and optimal selection of conductors or distribution networks. In addition, it is proposed to apply the developed variants of the AOA for its application phase-balancing problem in three-phase asymmetric distribution networks. Likewise, develop variants for AOA to improve the algorithm’s parameters to reduce the computational load and the processing times.

