


 English (pdf)
 Article in xml format
 Article references
 Send this article by e-mail
 Cited by SciELO
  Cited by Google
  Similars in
SciELO
Similars in
SciELO  Similars in Google
 Permalink
Introduction
In late 2019, a new coronavirus was identified as the cause of pneumonia in Wuhan, a city in China's Hubei province1,2. It spread rapidly, resulting in a China-wide epidemic and subsequently a pandemic. In February 2020, the disease was designated COVID-19 (coronavirus disease 2019) by the World Health Organization and was found to be caused by a virus named severe acute respiratory syndrome coronavirus 2 (SARS-CoV-2) 1,3. An enveloped positive-stranded RNA virus belonging to the subgenus betacoronavirus like severe acute respiratory syndrome virus (SARS) and Middle East respiratory syndrome virus (MERS) 4-6. The spectrum of COVID-19 ranges from asymptomatic infection to severe, life-threatening conditions. According to estimates by the Chinese center for disease control and prevention, 81% are mild infections, 14% are severe (dyspnea, hypoxia, or pulmonary compromise on imaging 50% within 24 to 48 hours), 5% are critical (respiratory failure, shock or multiorgan dysfunction) and 2.3% of patients die6. Multiple long-term complications of COVID-19 and its main sequelae have been described, including asthenia, adynamia, respiratory distress, chronic chest pain, and dyspnea, among others. Therefore, the need to understand and respond to long-term effects of COVID-19 is increasingly urgent7,8.
Longterm COVID-19 encompasses physical, medical, and cognitive sequelae with a reported prevalence of between 30% and 54%7-9. Huang et al10, described persistent signs and symptoms at 6 months and 12 months later in 1,276 COVID-1 survivors, including fatigue, muscle weakness, limited mobility, and anxiety or depression. Motloch et al11, described biomarkers such as troponin and vascular cell adhesion molecule 1 associated with hospital and long term mortality in patients with a history of COVID 19. However, the risk factors for long-term morbidity and mortality in patients with a history of SARS-CoV-2 infection are unknown. In addition, there are limited data describing the main variables associated with mortality in small cohorts, mostly hospitalized CO-VID-19 cases and compared with the population without the infection5-9. Given that the increased risk of mortality after COVID-19 requires multidisciplinary and specific interventions to prevent these deaths, we have developed this study that aims to determine the relationship between clinical characteristics, laboratory results and the treatments used with mortality at 12 months in patients with COVID-19.
Methods
Design
Retrospective cohort study in three hospitals in Colombia, Clínica Universidad de la Sabana (Chía, Cundinamarca), Clínica Palermo (Bogotá D.C.) and Hospital Regional De La Orinoquía (Yopal, Casanare) in patients who attended these institutions between March 2020 and March 2021, with a 12-month follow-up after hospital discharge.
Criteria eligibility
Patients over 18 years of age and whose discharge status was "alive" were included. The diagnosis of COVID-19 was made by polymerase chain reaction (PCR) in a respiratory sample. Patients who were referred to other institutions were excluded. Twelve months after hospital discharge, follow-up was performed to establish survival.
Data sources/measurement
were obtained from clinical records of the information systems from hospital centers. One year after discharge, the status was obtained from the Administradora de los Recursos del Sistema General de Seguridad Social en Salud (ADRES) database and through telephone calls. Qualitative variables were summarized in frequencies and percentages and quantitative variables in mean and standard deviations if the distribution was normal or in medians and interquartile ranges if the distribution did not respect normality.
Biases
There was variability in the units of measurement in which some laboratory results were reported, so these measurements were converted to unify them into the same one. Patients whose survival status could not be established were excluded from the outcome to be evaluated.
Sample size
The sample size was calculated using the Hosmer Lemeshow formula for logistic regression. Considering the entry of 10 parameters for the regression, a minimum number of 10 cases per parameter, a 10% frequency of the death event and one year of follow-up, finally requiring 1000 subjects12.
Statistical methods
Data were analyzed using the SPSS 25 program licensed by the Universidad de La Sabana. Qualitative variables were summarized in frequencies and percentages, quantitative variables in averages and standard deviations if the distribution was normal, or medians and interquartile ranges if the distribution was not normal. A bivariate was performed comparing the quantitative variables using a student's t-test if they were normally distributed. If the distribution was not normal, the Mann-Whitney U test was used. Qualitative variables were compared with Chi-square or Fisher's test. Crude and adjusted odds ratios were calculated using multivariate logistic regression analysis with the outcome variable mortality at 12 months, considering a statistically significant p 0.05.
Results
Population characteristics
A total of 1194 patients were included out of 4344 potential eligible subjects Figure 1. The average age of the general population was 57.7 years, and 58.7 % (n=701) were male. Death occurred in 50 individuals in the study (4.2 %), which was more common in older subjects with a mean of 73 years (SD 12,91). 36.6 % of the patients presented arterial hypertension, and 93.6% of the patients used antihypertensives. Table 1 shows the characteristics of the cohort.
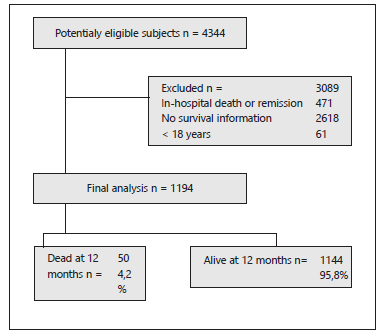
Table 1 General characteristics of the population.
| Overall patients n= 1194 | Dead at 12 months n= 50 | Alive at 12 months n= 1144 | p value | |
|---|---|---|---|---|
| Age years, m(SD) | 57.1 (15.76) | 73.0 (12.91) | 57.1 (15.76) | <0.001 |
| Male, n (%) | 701 (58.7) | 32 (64.0) | 669 (58.5) | 0.438 |
| Epidemiological nexus, n (%) | 828 (69.3) | 38 (76.1) | 790 (69.1) | 0.297 |
| Close contact with positive COVID-19, n (%) | 307 (25.7) | 7 (14.1) | 300 (26.2) | 0.053 |
| Previous hospitalization, n (%) | 32 (2.7) | 3 (6.9) | 29 (2.5) | 0.138 |
| Arterial hypertension, n (%) | 437 (36.6) | 22 (44.7) | 415 (36.3) | 0.267 |
| Smoking, n (%) | 26 (2.2) | 1 (2.5) | 25 (2.2) | 0.930 |
| Previous smoking, n (%) | 95 (8.0) | 4 (8.4) | 91 (8.0) | 0.991 |
| Myocardial infarction, n (%) | 30 (2.5) | 1 (2.3) | 29 (2.5) | 0.813 |
| Heart failure, n (%) | 24 (2.0) | 3 (6.7) | 21 (1.8) | 0.040 |
| Stroke, n (%) | 18 (1.5) | 2 (4.4) | 16 (1.4) | 0.140 |
| Dementia, n (%) | 20 (1.7) | 3 (6.2) | 17 (1.5) | 0.015 |
| COPD, n (%) | 66 (5.5) | 10 (20.9) | 56 (4.9) | <0.001 |
| Asthma, n (%) | 35 (2.9) | (0.0) | 35 (3.1) | 0.740 |
| Antihypertensive, n (%) | 1118 (93.6) | 41 (82.3) | 1077 (94.1) | <0.001 |
| ACE inhibitor, n (%) | 65 (5.4) | 2 (4.3) | 63 (5.5) | 0.646 |
| ARA-II, n (%) | 297 (24.9) | 11 (22.2) | 286 (25.0) | 0.631 |
| Charlson index, m(SD) | 1.9 (1.91) | 4.6 (2.56) | 1.8 (1.79) | <0.001 |
Abbreviations: m: average, SD: standard deviation; COPD: Chronic obstructive pulmonary disease; ACE: Angiotensin converter enzyme; ARA-II: Angiotensin II receptor antagonist.
Laboratory exams and treatment
The group of patients who died at 12 months showed a lymphocyte count of 922.6 (SD: 572.32) compared to 1200.1 (SD: 749.45) in the group of survivors (p 0.001) table 2. Hemoglobin averaged 2.1 g/ dl less in the patients who died compared to the control group (14.5 vs. 12.4; p<0.001). The blood urea nitrogen (BUN) (33.3 vs. 19.3; p 0.001) and d-dimer (2252.0 vs. 1273.1; p=0.029) were higher in patients who died at 12-month follow-up compared to the surviving group. Table 3 shows the different treatments used.
Table 2 Laboratory results on admission
| Overall patients n= 1194 | Dead at 12 months n= 50 | Alive at 12 months n= 1144 | p value | |
|---|---|---|---|---|
| Leucocyte 109 cells/L, m (SD) | 8698.5 (4290.44) | 8673.4 (5465.57) | 8699.6 (4233.83) | 0.973 |
| Neutrophils 109 cells/L, m (SD) | 7017.6 (4051.87) | 7270.7 (5087.79) | 7006.3 (4001.88) | 0.717 |
| Lymphocytes 109 cells/L, m (SD) | 1188.3 (744.67) | 922.6 (572.32) | 1200.1 (749.45) | <0.001 |
| N/L ratio, m (SD) | 7.9 (7.01) | 10.5 (8.32) | 7.8 (6.92) | 0.008 |
| Hemoglobin g/dl, m (SD) | 14.4 (2.29) | 12.4 (2.78) | 14.5 (2.23) | <0.001 |
| Hematocrit %, m (SD) | 42.8 (6.49) | 37.9 (7.62) | 43.0 (6.35) | <0.001 |
| Platelets 109/L, m (SD) | 248.4 (97.76) | 244.0 (109.76) | 248.6 (97.24) | 0.743 |
| Sodium mEq/L, m (SD) | 136.8 (6.2) | 137.2 (5.19) | 136.8 (6.25) | 0.577 |
| Creatinine mg/dl, m (SD) | 1.3 (1.45) | 2.3 (2.51) | 1.2 (1.37) | 0.004 |
| BUN mg/dl, m (SD) | 19.9 (12.94) | 33.3 (22.57) | 19.3 (12.08) | <0.001 |
| Glucose mg/dl, m (SD) | 143.3 (72.77) | 118.9 (38.46) | 144.3 (73.75) | <0.001 |
| Albumin g/l, m (SD) | 3.1 (0.51) | 3.1 (0.37) | 3.1 (0.54) | 0.989 |
| Ferritin ng/mL, m (SD) | 1188.7 (2047.89) | 977.2 (1629.45) | 1196.5 (2062.23) | 0.358 |
| LDH mg/dl, m (SD) | 391.5 (233.71) | 336.2 (182.97) | 394.0 (235.55) | 0.031 |
| AST U/L, m (SD) | 51.8 (56.76) | 44.8 (44.95) | 52.1 (57.23) | 0.265 |
| ALT U/L, m (SD) | 55.8 (66.53) | 43.1 (66.62) | 56.4 (66.51) | 0.165 |
| TB mg/dl, m (SD) | 0.7 (0.49) | 0.8 (0.75) | 0.7 (0.47) | 0.151 |
| DB mg/dl, m (SD) | 0.3 (0.34) | 0.5 (0.57) | 0.3 (0.32) | 0.049 |
| IB mg/dl, m (SD) | 0.3 (0.24) | 0.3 (0.25) | 0.3 (0.24) | 0.861 |
| Procalcitonin ng/mL, m (SD) | 1.4 (6.23) | 0.1 (0.09) | 1.5 (6.33) | <0.001 |
| CRP mg/L, m (SD) | 111.8 (96.86) | 101.4 (89.59) | 112.2 (97.18) | 0.441 |
| Troponin ng/mL, m (SD) | 1.8 (37.65) | 8.9 (36.74) | 1.5 (37.68) | 0.173 |
| D-dimer ng/mL, m (SD) | 1311.6 (3095.64) | 2252.0 (3180.67) | 1273.1 (3087.68) | 0.029 |
Notes: m: average, SD: standard deviation; N/L: Neutrophil to lymphocyte; BUN: Blood ureic nitrogen; LDH: Lactic dehydrogenase; AST: Aspartate transaminase; ALT: Alanine transaminase; TB: Total bilirubin, DB: Direct bilirubin; IB: Indirect bilirubin; CRP: C-reactive protein
Table 3 Treatment used.
| Overall patients n= 1194 | Dead at 12 months n= 50 | Alive at 12 months n= 1144 | p value | |
|---|---|---|---|---|
| Lopinavir/ritonavir, n (%) | 3 (0.3) | (0) | 3 (0.3) | 0.939 |
| Chloroquine, n (%) | 3 (0.3) | (0) | 3 (0.3) | 0.939 |
| Hydroxychloroquine, n (%) | 2 (0.2) | (0) | 2 (0.2) | 0.951 |
| Ivermectin, n (%) | 93 (7.8) | 1 (2.1) | 92 (8.2) | 0.119 |
| Colchicine, n (%) | 56 (4.7) | 1 (2.1) | 55 (4.8) | 0.358 |
| Dexamethasone, n (%) | 780 (65.3) | 20 (40) | 760 (66.4) | <0.001 |
Odds ratio and multivariate analyzes
Age 70 years OR: 7.2 (95% CI: 3.9-13.3) and adjusted OR: 1.05 (95% CI: 1.01-1.08) (p=0.023), Charlson index 4 OR: 7.8 (95% CI: 4.3-14.1) and adjusted OR: 1.35 (95% CI: 1.1-1.67) (p=0.005), dexamethasone OR: 0.3 (95% CI: 0.2-0.6) and adjusted OR: 0.3 (95% CI: 0.14-0.65) (p=0.002) and pronation OR: 0.3 (95% CI: 0.1-1) and adjusted OR: 0.4 (95% CI: 0.081.87) (p=0.242) Table 4.
Table 4 Odds ratios for each variable related to mortality 12 months.
| OR (95% CI) | OR* (95% CI) | p value | |
|---|---|---|---|
| Age >70 years | 7.2 (3.9-13.3) | 1.05 (1.01-1.08) | 0.023 |
| Female | 0.8 (0.4-1.4) | 0.61 (0.28-1.34) | 0.220 |
| Charlson index > 4 | 7.8 (4.3-14.1) | 1.35 (1.1-1.67) | 0.005 |
| Initial Glasgow <12 ingreso | 9.5 (1.8-50.2) | 0.87 (0.65-1.17) | 0.348 |
| Initial Ph <7.4 | 3.6 (1.9-6.6) | 0.57 (0-153.81) | 0.845 |
| Initial N/L ratio >10 ingreso | 2.9 (1.6-5.1) | 1.02 (0.98-1.07) | 0.277 |
| Initial Hemoglobin <12 g/dL | 6.9 (3.8-12.4) | 0.83 (0.71-0.97) | 0.017 |
| Initial Creatinine ≥1.5 mg/dl | 4.9 (2.6-9.1) | 1.03 (0.85-1.25) | 0.754 |
| Dilation of cavities | 7.2 (1.9-27.2) | 3.59 (0.33-38.8) | 0.292 |
| Dexamethasone | 0.3 (0.2-0.6) | 0.3 (0.14-0.65) | 0.002 |
| Pronation | 0.3 (0.1-1) | 0.4 (0.08-1.87) | 0.242 |
Abbreviations: m: average, SD: standard deviation; COPD: Chronic obstructive pulmonary disease; ACE: Angiotensin converter enzyme; ARA-II: Angiotensin II receptor antagonist
Discussion
These results show the variables associated with mortality at 12 months after acute SARS-CoV-2 infection. In the adjusted analysis, it was shown that age 70 years and Charlson index 4 were risk factors, and pronation and the use of dexamethasone were protective factors for mortality. A higher frequency of lymphopenia was observed, as well as a higher neutrophil/lymphocyte (N/L) ratio in the group of patients who died at 12 months. In addition, increased BUN concentration and creatinine were correlated with increased mortality in the subjects tested.
We found that an increase in some acute phase reagents that have previously been associated with increased early lethality, such as C-reactive protein, D-dimer, ferritin, among others, are correlated with decreased long-term survival. In addition, in our cohort, we found certain laboratory test abnormalities that are more frequently found in subjects with a fatal outcome. These results are novel and useful in the population of low- and middle-income countries because they evaluate clinical variables and laboratory tests that are easy to collect during acute hospitalization and clinical follow-up at hospital discharge in patients with COVID-199,13-15.
Oxygen deprivation due to lung injurie and low hemoglobin levels leads to a greater oxygen deficit in the tissues, thus potentially increasing longterm morbidity and mortality16-19. Regarding the treatments received, it is important to mention that at the beginning of the study, the patients received different medications based on the national guidelines for managing patients with COVID-19, which were modified according to the results of the evidence that was published. In July 2020, the preliminary results of the RECOVERY study were published13,17-19. From that time on, dexamethasone became widespread, which is reflected in our cohort. We found a clear difference in its use with the outcomes in the population. The analysis adjusted for confounding variables showed a lower mortality in patients treated with dexamethasone, corroborating the positive impact on mortality from COVID-19.
This study presents important strengths and limitations. The strengths include the use of a reliable and unified database in each institution for the follow-up of the patients; in them, information was obtained on their survival, clinical evolution and laboratory results over time. Likewise, validatedudy and standardized molecular biology diagnostic tests were used to include the subjects in the st, giving greater internal validity to our work. We analyzed variables already demonstrated as predictors of severity (lymphocyte count, N/L ratio, BUN, creatinine, among others). Additionally, knowledge of 12-month mortality in patients with COVID-19 gives an idea of the long-term impact of the disease on the population as well as its impact in terms of quality of life and overall disease burden, the latter related to premature death17,18.
Relevant limitations of our work include the fact that the data are observational. However, it serves as a basis for the development of intervention studies with which to corroborate our results. Although we have an important sample of patients in our study, obtained information represents three institutions and therefore, it is difficult to generalize the results to the entire population. More clinical studies are needed that include a larger number of patients over a prolonged period to better describe the causes of death in patients, and that are not related to sequelae derived from COVID-19.
In conclusion, increased risk of death from COVID-19 is not limited to acute illness. Lymphopenia, anemia, and elevation of BUN, creatinine, and d-dimer occurred more frequently in patients who died at 12-month follow-up after COVID-19. The increased risk of death 12 months after acute SARS-CoV-2 infection is associated with clinical variables such as age 70 years and Charlson index 4. Use of prone ventilation and dexamethasone were associated with increased survival in this population.

