




 English (pdf)
 Article in xml format
 Article references
 Automatic translation
 Send this article by e-mail
 Cited by SciELO
  Cited by Google
  Similars in
SciELO
Similars in
SciELO  Similars in Google
 Permalink

Introduction
Pulmonary tuberculosis (PT) and community-acquired pneumonia (CAP) are two common infectious diseases that affect the lower respiratory tract and can cause serious complications and death1-3. These infections can share clinical and radiological symptoms, such as cough, fever, shortness of breath, and various types of pulmonary infiltrates4,5. Therefore, a precise differential diagnosis is required to distinguish between PT and pneumonia caused by other bacterial agents5,6. This distinction is necessary to make decisions about pharmacological treatment and epidemiological management of patients5-8.
Currently, multiple tools are available for the accurate diagnosis of PT or CAP8-10, however, the availability of these techniques in many places may be limited. The assessment of cell counts and the relationships between different types of blood cells has been proposed to provide useful and easily accessible information for distinguishing between these two conditions9,11. An elevated monocyte/lymphocyte ratio (MLR) has been suggested as an indicative marker of tuberculosis, while a low value may indicate bacterial pneumonia12,13. Additionally, it has been found that the neutrophil/mast cell ratio (NMR) is higher in tuberculosis than in pneumonia14, suggesting that these parameters could reflect a specific inflammatory and immunological state according to the type of infection15.
These cellular indices have also been compared to other inflammatory markers, with findings indicating, among other things, that the neutrophil/lymphocyte ratio (NLR) may be superior to C-reactive protein (CRP) in predicting bacteremia in emergency department16, and that NLR, MLR, and platelet/ lymphocyte ratio (PLR) may be associated with stroke-related pneumonia13. However, information comparing the performance of these indices and their relationship with other inflammatory markers, such as CRP, remains limited. The objective of this study is to compare different types of cellular indices alone or in combination with CRP to determine which one may have the best diagnostic performance for distinguishing between tuberculosis and pneumonia.
Methods
A retrospective cohort study of patients with PT and CAP who were treated in the emergency department or the general ward of a tertiary hospital in Colombia was performed. Cellular and inflammatory markers between tuberculosis and pneumonia patients were compared. The hypothesis was that these markers differed between the groups and could aid in differential diagnosis. Data from electronic medical records from January 2.010 to December 2.019 were obtained.
Eligibility criteria
Patients aged 18 years or older with respiratory symptoms, including cough, shortness of breath, fever, pleuritic pain, and/or altered mental status, were eligible for this study. Those with abnormal vital signs, such as a heart rate of 100 beats per minute (bpm), a respiratory rate of 20 breaths per minute (rpm), and a temperature of 38 degrees Celsius (°C), were also included. The presence of crackles or wheezing during auscultation and the detection of pulmonary infiltrates on chest X-ray and/or computed tomography (CT) (alveolar, interstitial, or mixed opacities) were evaluated. The diagnosis of tuberculosis was established through the identification of Mycobacterium tuberculosis in smear microscopy, culture, or polymerase chain reaction (PCR) tests for genetic material. CAP was diagnosed based on Infectious Diseases Society of America/American Thoracic Society criteria and the requirement of antibiotic management without isolation of Mycobacterium tuberculosis during follow-up. Patients with incomplete records and those diagnosed with nosocomial or aspiration pneumonia during the follow-up period were excluded from the study.
Variables
The differential diagnosis between PT and CAP was the dependent variable. The independent variables included: demographic characteristics (age and sex), comorbidities (evaluated using the Charlson scale), hematological parameters (leukocytes, lymphocytes, monocytes, basophils, eosinophils, and platelets), CRP and procalcitonin (PCT). Different cellular indices were calculated using hematological parameters and inflammatory markers upon admission. The electronic medical records were reviewed and compiled using the Research Electronic Data Capture electronic data capture software (REDCap). To reduce information and transcription biases, the research team members received training in the methodology of reviewing and recording electronic medical records. Finally, the recorded data were verified by at least two members of the research team.
Sample size
To calculate the sample size, we used a diagnostic test confidence interval formula. For this purpose, we utilized data from the Yoon study17, which reported a sensitivity of 91,1% and specificity of 81,9% for the NLR in the differential diagnosis between PT and CAP. With these values and considering a confidence level of 95% and a precision of 5%, a minimum of 353 subjects were required. Sequential enrollment of subjects occurred throughout the study period.
Statistical Analysis
Qualitative variables were summarized using frequencies and percentages, whereas quantitative variables were summarized using measures of central tendency and dispersion. For normally distributed data, means and standard deviations (SD) were calculated, whereas for nonnormally distributed data, medians and interquartile ranges were employed. The normality of the distribution was assessed using the Anderson Darling test. Quantitative variables were compared using either the Student's t-test or Mann-Whitney U test, depending on the distribution characteristics, while qualitative variables were compared using the chi-square test. Various cellular indices, including the monocyte-lymphocyte ratio, neutrophil lymphocyte ratio, platelet-lymphocyte ratio, and platelet-monocyte ratio, were calculated.
A receiver operating characteristic (ROC) curve was plotted, and the area under the ROC-curve was calculated for each of these indices, as well as for CRP and PCT values, to differentiate between PT and CAP. The ROC-curve was interpreted as 0,50: absence of discriminatory capacity, 0,51 to 0,60: almost null discriminatory capacity, 0,61 to 0,69: poor discriminatory ability, 0,7 to 0,8: acceptable discrimination ability, 0,8 to 0,9: excellent discriminatory capacity and 0,9: outstanding discriminatory capacity. Additionally, the sensitivity, specificity, positive predictive value, negative predictive value, positive likelihood ratio (LR+), and negative likelihood ratio (LR-) were calculated for each index and inflammatory marker, along with their respective 95% confidence intervals. A p-value 0,05 was considered statistically significant.
Results
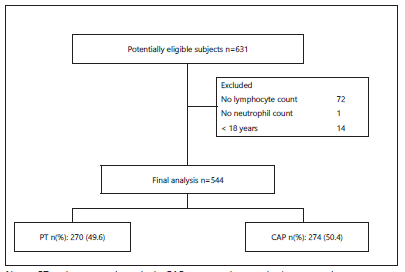
A total of 544 subjects were included in the final analysis of 631 potentially eligible patients during the study period. Of these, 270 (49,6%) were diagnosed with PT and 274 (50,4%) with CAP (Figure 1).
General population characteristics
The mean age was 60,2 years (SD 22,91), and 67,3% were men. Patients with CAP were significantly older than patients with PT (66,5 vs. 53,7 years; p 0,001) and had a higher percentage of comorbidities such as congestive heart failure, cerebrovascular disease, diabetes with complications, and non-metastatic solid tumor (p 0,05 for all comparisons). Patients with PT had a higher prevalence of human immunodeficiency virus /acquired immunodeficiency syndrome infection than patients with CAP (12,6% vs. 0,7%; p 0,001). The mean Charlson score was 3,6 (SD 2,62), being higher in patients with CAP than in patients with PT (4,1 vs. 3,1; p 0,001). Table 1 shows the general population characteristics.
Table 1 General population characteristics
| Total n=544 | PT n=270 | CAP n=274 | P value | |
| Age years, m(SD) | 60,2 (22,91) | 53,7 (19,69) | 66,5 (24,08) | <0,001 |
| Male, n(%) | 366 (67,3) | 193 (71,5) | 173 (63,1) | 0,038 |
| Acute Myocardial Infarction, n(%) | 7 (1,3) | 1 (0,4) | 6 (2,2) | 0,060 |
| Congestive Heart Failure, n (%) | 122 (22,4) | 32 (11,9) | 90 (32,8) | <0,001 |
| Cerebrovascular disease n (%) | 11 (2,0) | 1 (0,4) | 10 (3,6) | 0,007 |
| Diabetes, n (%) | 63 (11,6) | 21 (7,8) | 42 (15,3) | 0,006 |
| HIV/AIDS, n (%) | 36 (6,6) | 34 (12,6) | 2 (0,7) | <0,001 |
| Charlson score, m(SD) | 3,6 (2,62) | 3,1 (2,43) | 4,1 (2,7) | <0,001 |
| Charlson score 0, m(SD) | 150 (27,6) | 83 (30,7) | 67 (24,5) | <0,001 |
| Charlson score 1, m(SD) | 103 (18,9) | 73 (27) | 30 (10,9) | <0,001 |
| Charlson score 2, m(SD) | 291 (53,5) | 114 (42,2) | 177 (64,6) | <0,001 |
Notes: m: average; SD: Standard deviation; n: number; PT: pulmonary tuberculosis; CAP: community-acquired pneumonia; HIV/AIDS: human immunodeficiency virus/ acquired immunodeficiency syndrome.
Laboratory findings
Patients with CAP had significantly higher levels of leukocytes, neutrophils, monocytes, hemoglobin, hematocrit, and platelets than patients with PT (p 0,05 for all comparisons). Patients with PT had significantly higher levels of eosinophils, basophils, and CRP than patients with CAP (p 0,05 for all comparisons). There were no significant differences between the groups in terms of lymphocytes, PCT or arterial blood gases. The PaO2/FiO2 ratio was significantly lower in patients with CAP than in patients with PT (286,2 vs. 272,1; p 0,001). Table 2 shows the laboratory findings of the population.
Table 2 Laboratory findings
| Total n=544 | PT n=270 | CAP n=274 | P value | |
|---|---|---|---|---|
| leukocytes cell/ml, m(SD) | 10.990,9 (5.740,76) | 9.493,4 (4.691,23) | 12.466,6 (6.281,87) | <0,001 |
| neutrophils cell/ml, m(SD) | 8.631,7 (5.453,34) | 7.311,1 (4.566,95) | 9.933 (5.930,86) | <0,001 |
| lymphocytes cell/ml, m(SD) | 1.386,4 (1.005,55) | 1.333,5 (1.006,72) | 1.438,5 (1.003,5) | 0,224 |
| eosinophils cell/ml, m(SD) | 171,9 (374,01) | 179,2 (250,96) | 158,8 (526,68) | 0,563 |
| Basophils cell/ml, m(SD) | 73,3 (544) | 48,2 (270) | 120,6 (274) | 0,036 |
| monocytes cell/ml, m(SD) | 754,9 (865,59) | 641,8 (833,04) | 927,2 (889,1) | <0,001 |
| neutrophils %, m(SD) | 75,4 (15,12) | 74 (15,63) | 76,8 (14,5) | 0,035 |
| lymphocytes %, m(SD) | 15,1 (11,63) | 16,4 (12,43) | 13,8 (10,64) | 0,009 |
| Basophils %, m(SD) | 0,5 (1,04) | 0,6 (0,8) | 0,5 (1,4) | 0,345 |
| monocytes %, m(SD) | 7,6 (8,29) | 7,3 (7,99) | 8,1 (8,76) | 0,243 |
| eosinophils %, m(SD) | 1,8 (2,85) | 2,2 (3,06) | 1,1 (2,28) | <0,001 |
| Hemoglobin g/dL, m(SD) | 12,8 (2,97) | 12,3 (2,87) | 13,2 (3,01) | <0,001 |
| Hematocrit (%), m(SD) | 38,2 (7,87) | 37,1 (8,03) | 39,3 (7,58) | 0,002 |
| Platelets cells x 10A3, m(SD) | 295,2 (144,55) | 326,8 (157,2) | 264,2 (123,61) | <0,001 |
| Procalcitonin ng/L, m(SD) | 14,8 (62,51) | 19,1 (85,57) | 10,2 (19,92) | 0,097 |
| C reactive protein mg/L, m(SD) | 56,8 (73,85) | 84,5 (82,15) | 22,6 (41,7) | <0,001 |
Cellular indices and inflammatory markers
Patients with CAP had significantly higher levels of MLR, NLR, platelet-to-lymphocyte ratio, product platelets/ lymphocyte*CRP (PLR-CRP), and platelet-to-monocyte ratio (PMR) than patients with PT (p 0,05 for all comparisons). Patients with PT had significantly higher levels of CRP than patients with CAP (p 0,001). PCT did not show significant differences between the groups (p = 0,061). Table 3 shows the findings for cellular indices and inflammatory markers.
Table 3 Cellular indices and inflammatory markers.
| Total n=544 | PT n=270 | CAP n=274 | P value | |
|---|---|---|---|---|
| Monocyte/Lymphocyte Ratio cell/ml, me(IQR) | 0,5 (0,3-0,3) | 0,5 (0,3-0,7) | 0,7 (0,4-1) | 0,004 |
| Neutrophil/Lymphocyte Ratio cell/ml, me(IQR) | 6,3 (3,5-3,5) | 5,2 (3,1-11,3) | 7,5 (3,9-12,6) | 0,009 |
| Platelet/lymphocyte ratio cell/ml, me(IQR) | 240,2 (139,1-139,1) | 289,6 (170,1-449,4) | 208,7 (122,9-334,1) | <0,001 |
| C reactive protein mg/dL, me(IQR) | 22 (7,8-7,8) | 57 (14,8-139) | 11 (4,4-25) | <0,001 |
| Procalcitonin ng/L, me(IQR) | 0,6 (0,2-0,2) | 0,3 (0,1-1,9) | 1,6 (0,2-7,7) | 0,061 |
| Product platelets/lymphocyte*PCR, me(IQR) | 5.126,8 (1.391,4-1.391,4) | 14.395,4 (3.231,344.394,9) | 2.099,6 (971,7-6.304,4) | <0,001 |
| Platelet / Monocyte, me(IQR) | 460,7 (274,2-274,2) | 598,5 (358,9-874,1) | 339,6 (210-516,7) | <0,001 |
Notes: me: median; IQR: median and interquartile range; PT: pulmonary tuberculosis; CAP: community-acquired pneumonia; CRP: C reactive protein.
Performance of cellular indices and inflammatory markers
CRP and PLR-CRP had the highest ROC-curve for differentiating between PT and CAP, with ROC-curve of 0,76 (95% CI: 0,71-0,88) and 0,75 (95% CI: 0,71-0,80), respectively. PCT did not show discriminatory power for these two diseases, with a ROC-curve of 0,60 (95% CI: 0,50-0,71). Table 4 shows the performance findings of the different cellular indices and inflammatory markers evaluated in the diagnosis of PT and CAP.
Table 4 Performance of cellular indices and inflammatory markers.
| biomarker / cutoff points | Se (CI 95%) | Sp (CI 95%) | VPP (CI 95%) | VPN (CI 95%) | LR+ (CI 95%) | LR- (CI 95%) | ROC (CI 95%) | value |
|---|---|---|---|---|---|---|---|---|
| MLR cell/ml 0,65 | 31,7 (26,5-36,9) | 46,7 (41-52,3) | 47,5 (41,9-53,2) | 30,9 (25,7-36,1) | 0,59 (0,442-0,799) | 1,46 (1,089-1,967) | 0,6 (0,53-0,67) | 0,004 |
| NLR cell/ml 5,25 | 49,3 (45,1-53,5) | 36,1 (32,1-40,2) | 43,2 (39-47,3) | 41,9 (37,8-46,1) | 0,77 (0,664-0,896) | 1,4 (1,209-1,632) | 0,57 (0,52-0,61) | 0,009 |
| PLR cell/ml 233,67 | 60,3 (56,2-64,4) | 91,9 (89,6-94,2) | 88 (85,2-90,7) | 70,2 (66,4-74,1) | 7,46 (4,92-11,298) | 0,43 (0,285-0,652) | 0,61 (0,57-0,66) | <0,001 |
| CRP mg/dL 36,1 | 59 (59-63,8) | 92,5 (90-95,1) | 90,7 (87,9-93,5) | 64,5 (59,9-69,2) | 7,88 (4,912-12,648) | 0,44 (0,276-0,711) | 0,76 (0,71-0,81) | <0,001 |
| PCR ng/L 0,33 | 42,9 (37,3-52,1) | 29,6 (21,1-38,2) | 38,7 (29,6-47,8) | 33,3 (24,5-42,1) | 0,61 (0,428-0,866) | 1,93 (1,357-2,742) | 0,6 (0,5-0,71) | 0,061 |
| PLR*PCR 8250 | 61,1 (56,3-65,8) | 83 (79,3-86,6) | 81,7 (77,9-85,4) | 63,2 (58,5-68,6) | 3,58 (2,629-4,889) | 0,47 (0,344-0,64) | 0,75 (0,71-0,8) | <0,001 |
| Platelet / Monocyte 434,13 | 69,4 (64,2-74,7) | 66,9 (61,6-72,3) | 76,2 (71,4-81,1) | 59 (53,4-64,5) | 2,1 (1,653-2,671) | 0,46 (0,359-0,58) | 0,7 (0,63-0,76) | <0,001 |
Notes: MLR: Monocyte/Lymphocyte Ratio; NLR: Neutrophil/Lymphocyte Ratio; PLR: Platelet/lymphocyte ratio; CRP: C reactive protein; PCT: procalcitonin; PLR*PCR: product platelets/lymphocyte*PCR; Se. Sensitivity; Sp. Specificity; PPV. positive predictive value; NPV. negative predictive value; LR+. positive likelihood ratio; LR-. negative likelihood ratio; ROC. area under the receiver operating characteristic curve
Discussion
This study evaluated the diagnostic performance of different cellular indices and inflammatory markers for differentiating between PT and CAP. The results showed that CRP, PLR-CRP, and PMR were the best markers for differentiating between the two diseases. The performance of these markers was acceptable, suggesting that they could be useful in the clinical setting for suspected tuberculosis or CAP.
The CRP results suggest its potential utility as a biomarker for the differential diagnosis of respiratory infectious diseases. However, our findings are inconsistent with those of previous studies that have examined the discriminatory value of CRP between PT and CAP. For instance, Niu et al.18 and Kang et al.19 reported no significant differences in CRP levels between PT and CAP patients. Furthermore, in a meta-analysis of 13 studies, Yoon et al.20 concluded that CRP demonstrated a low diagnostic accuracy for active PT, exhibiting high sensitivity (93%, 95% CI:85-97) but low specificity (62%, 95% CI:42-79)20. These discrepancies may be attributed to various factors, including differences in population size and characteristics, diagnostic criteria, CRP measurement methods and cutoff points, patient immune status, disease stage and severity, prior treatment, and presence of comorbidities or coinfections. CRP is an acute-phase protein that increases in response to various inflammatory and infectious stimuli, thereby leading to variations in its sensitivity and specificity depending on the context and specific condition or disease under evaluation. Consequently, interpretation of CRP results should be considered in conjunction with other clinical, radiological, and microbiological data21-25.
Cellular indices involving platelets provide an additional avenue to distinguish between TB and CAP. In our study, PLR-CRP and PMR demonstrated acceptable performances in differentiating between these two diseases. In a meta-analysis of 12 studies with 6.302 patients, they showed the association of NLR, MLR, and PLR with stroke-associated pneumonia13. Chen et al.26 investigated the diagnostic value of PLR in TB patients with COPD, reporting a sensitivity of 92,4% and specificity of 84,5% in discriminating between TB and other causes of exacerbation. Platelets play a role in the immune response to tuberculosis by regulating inflammatory processes and matrix degradation27. Furthermore, individuals with tuberculosis exhibit elevated platelet-monocyte aggregation and increased expression of monocyte receptors compared to healthy controls28, which could manifest as changes in PMR among PT patients. However, the response may be influenced by factors such as the type of systemic inflammatory response, coagulation, or cellular immunity26-28.
The values of NL and ML are lower in patients with PT when compared in patients with CAP in a statistically significant way; however, the performances found in this study are almost null and poor, respectively. Jeon et al14. evaluated the usefulness of the NML index and the NL to discriminate PT versus non-tuberculous infectious lung diseases, finding a higher performance of the NL to differentiate these pathologies (ROC-curve: 0,88; 95% CI: 0,84-0,92) and concluding that the NML index is the one with the best performance for this purpose (ROC-curve: 0.90; 95% CI: 0,86-0,93). Yoon et al20. show a high discriminative performance of NL to differentiate PT from CAP (ROC-curve: 0,95; 95% CI: 0,91-0,98) even higher than that of CRP (ROC-curve: 0,83; 95% CI: 0,76-0,88). On the contrary, Berhane et al (15)., in two Ethiopian hospitals found acceptable performance of the NL index to differentiate PT and CAP (ROC-curve: 0,69; 95% CI: 0,62-0,77). Even though these cellular indices can reflect the inflammatory and immunological state in the face of infection, the variability found in these results makes it difficult for these indices to reliably discriminate between these pathologies, useful as tools to guide diagnosis.
In our study, PCT was unable to discriminate between PT and CAP, even though PCT levels were higher in patients with CAP than in patients with PT, no statistically significant differences were reached, and ROC-curve did not reach a power of measurement discrimination. These results contrast with those reported in other studies that have evaluated the usefulness of PCT to differentiate these infections; Niu et al.18 compared PCT, interleukin-10 (IL-10) and CRP levels between 60 patients with PT and 60 patients with CAP, finding that PCT was significantly higher in the NAC group than in the PT group, with an ROC-curve of 0,93 and an optimal cut-off value of 0,5 ng/ml to discriminate between both diseases. Yoon et al.20 conducted a meta-analysis of 14 studies that included 1.415 patients with PT and 1,029 patients with CAP, found that PCT was significantly higher in the NAC group than in the PT group, with a combined ROC-curve of 0,94 and a combined optimal cut-off value of 0,5 ng/ml to discriminate between both diseases.
A limitation of this study is that it was performed in a single center and with a retrospective methodology. The sample size achieved is considered to support our conclusions. To avoid bias, different strategies were used during the collection, design, and statistical analysis stages, such as training of the personnel responsible for data collection and double validation performed by different researchers. The biomarkers were collected during the follow-up of the patients, which could even imply that some patients could have started the treatment before the laboratory tests. In addition, the mean age of the PT cases was lower when compared to the controls, which could generate biases because the white blood cell count and the platelet count decrease with advancing age. These findings highlight the importance of future studies to enhance the timely diagnosis of patients with CAP and PT. However, more prospective, and multicenter studies are needed that include a larger number of patients with different etiologies of pulmonary infection. Likewise, it would be interesting to evaluate the predictive value of these cell indices for the development of complications or mortality29.
In conclusion, the CRP and blood cell markers were the best markers to differentiate between patients with PT and CAP. The performance of these markers was acceptable, suggesting that they could be useful in the clinical setting for suspected tuberculosis or CAP. More prospective, and multicenter studies are needed that include a larger number of patients with different etiologies of pulmonary infection.

