


 English (pdf)
 Article in xml format
 Article references
 Send this article by e-mail
 Cited by SciELO
  Cited by Google
  Similars in
SciELO
Similars in
SciELO  Similars in Google
 Permalink
Introduction
Acute hepatitis B virus (HBV) infection is symptomatic in approximately 30% of cases, including fulminant hepatitis in 0.1 to 1%. The risk of developing chronic HBV infection is inversely related to the age at acquisition, chronic infection occurs in 80-90% of persons infected during infancy, 30% of those infected before age 6 years, and less than 1-12% of those infected as older children or adults, promoting a higher incidence of complications, liver failure, cirrhosis, and hepatocellular carcinoma 1,2. Since its introduction in the early 1980s, HBV vaccination is the cornerstone of prevention 1,2. In Colombia, the incidence of HBV infection was estimated in 5 cases per 100,000 population in 2022 3. Since 1993, Colombia has included HBV vaccination for children in its national immunization program, and currently, 87% of children older than 6 months are vaccinated. 4,5.
Due to the shared routes of transmission for HBV and HIV, coinfection is relatively frequent, with a reported prevalence of up to 20% 2,6. In people living with HIV (PLWH), HBV infection posed an increased risk of chronic infection compared to the general population and hepatocellular carcinoma compared to HBV monoinfection 2,6,7. Despite administering optimal treatment and achieving good virological control of the two infections, liver disease progression continues to occur in about 10 to 20% of treated individuals 6. To prevent this scenario, it is recommended that PLWH undergo serological testing for HBV surface antigen (HBsAg), HVB core antibody (anti-HBc total), and HVB surface antibody (anti-HBs) to identify chronic HBV infection, and that all those without chronic HBV infection with anti-HBs <10 mIU/mL) should be vaccinated 8. However, PLWH show protective levels of HBV antibodies (anti-HBs >10 mIU/mL) after vaccination less frequently (20 to 70%) than the general population (90 to 95%). 2,6-9.The immune response conferring protection against exposure to the HBV after a full HBV vaccination scheme consisting of a total of three intramuscular doses is defined as Anti-HBs) > 10 IU/l evaluated between 4 and 16 weeks after the last vaccine dose 7,9,10. Despite insufficient evidence on their effectiveness, revaccination, increased vaccine doses, and alternative routes of administration have been suggested to optimize HBV vaccine immunogenicity for PLWH 9,11-14. In order to shed light on potential interventions to improve HBV prevention, this study aimed to determine factors associated with the lack of seroconversion after HBV vaccination in PLWH under routine health care.
Material and Methods
Study design and population
We conducted a retrospective cohort study in two HIV outpatient clinics in Cali, Colombia. Adult patients registered for the first time between March 2017 and March 2020, with HIV confirmed according to international guidelines 15, and with available reports of HBV surface antigen (HBsAg), anti-HBs, and antibodies against HBV core antigen (Anti-HBc) on admission were screened. Those patients with reported levels of anti-HBs ≤ 10 IU/ml on admission were included if they received at least one dose of HBV vaccine and were followed up to assess anti-HBs post-vaccination. Pregnant women, individuals with active or previous HBV infection according to serological markers 8) were excluded. The outcome was lack of seroconversion defined as anti-HBs ≤10 IU/ml post vaccination 8. The sample size was estimated in 195 patients based on an expected incidence of lack of seroconversion of 40%, 36% exposed to CD4+ T-cell count < 200 cells 12,16, RR of 1.6, 95% confidence level, and 80% statistical power. All eligible patients were included. The study was approved by both clinics and the Ethical Review Board of Universidad del Valle (E037-022).
Data collection and quality control
Sociodemographic, clinical, laboratory and vaccination-related data were obtained from the electronic and on paper (when necessary) clinical records at both study sites by a single person. For the screening process, clinical records of all patients registered during the study period were reviewed. Subsequently, the data of included patients were collected by the same researcher in a case record form predesigned with closed options and pre-defined plausible ranges in Epi-Info V7.5. For quality control, data inconsistencies were verified with the primary data source and modified if necessary. To minimize information bias, data was collected by a single researcher (LM), following a standardized procedure and in a relatively short time (over three weeks).
Statistical analysis
We estimated the prevalence of PLWH with under the protective levels of HBV (≤ 10 IU/ml) on admission separately for each institution, and the weighted mean prevalence with 95% confidence interval using as weights the size of the population screened in the corresponding study site. The same method was used to calculate the incidence and weighted mean incidence of lack of seroconversion and their corresponding 95% confidence intervals (95% CI). A descriptive analysis was performed with absolute and relative frequencies, means with standard deviations or medians with ranges as appropriate. We estimated the incidence and relative risk (RR) of lack of seroconversion with their corresponding 95% CI using contingency tables and Chi-squared or Fisher's exact test for categorical variables. For quantitative variables, we used Student's t-test or Mann-Whitney test as appropriate. Multiple logistic regression models were fitted using the backward approach with variables with clinical relevance and those with a P-value <0.2 in the bivariate analysis. Multiple models were compared using the LR test and Akaike's information criterion. A P-value <0.05 was considered as statistically significant. STATA Version 15 was used for data analysis (StataCorp. 2017. Stata Statistical Software: Release 15. College Station, TX: StataCorp LP).
Results
Characteristics of the study population
A total of 1041 patients (20% in clinic A and 80% in clinic B) were screened, of these 529 were excluded because did not have information on anti-HBs on admission (31.1%), had evidence of HBV infection (15.8%), were pregnant (1.6%), with un- confirmed HIV (0.1%), or had an incomplete clinical record (1.3%). Of the remaining 512 patients, 75 had anti-HBs ≤ 10 IU/ml on admission on clinic A (83.3%) and 302 (71.8%) on clinic B with a weighted mean prevalence of 73.78% (95%CI: 73.41 - 74.17).
Of the 377 patients eligible for HBV vaccination, we included in the cohort 224 patients and 135 were excluded because they were not vaccinated (25%) or did not have anti-HBs post vaccination (15.6%) (Figure 1). The 224 patients were followed from the date of first registration at the corresponding clinic (day 0) until the date of the report of anti-HBs post-vaccination (date of outcome) with a median of 714 (IQR: 520-1028.5) days. In the included patients, the median age was 34.8 years (IQR: 27.1-46.6), 70.1% were males, and 24.48% were Afro-Colombian. Chronic non-communicable disease was reported in 21.9% of the patients, with hypertension as the most prevalent (9.8%). Alcohol consumption was reported in 30.45%, active smoking in 20.72% and use of a psychoactive substance in 18.8% (Table 1). Regarding HIV status, 41% were classified as CDC´s stage II (2014), with median CD4 count of 360 cells (IQR: 261-581) pre-vaccination, and median viral load of 40 (IQR: 0 - 3115). According to current guidelines, 98.2% received treatment based on nucleoside reverse transcriptase inhibitors, mainly accompanied by non-nucleoside reverse transcriptase inhibitors (68.3%), or protease inhibitors (20.1%). There were 66 patients (29.5%) received prophylaxis for opportunistic infections, mostly trimethoprim-sulfamethoxazole (24.1%). Coinfection was documented in 40.28% of patients, with syphilis being the most frequent (18.3%) (Table 2).
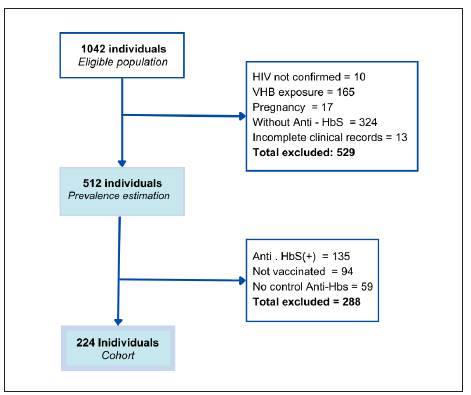
Table 1 Clinical and sociodemographic characteristics of study population
| Absence of seroconversion | RR | CI 95% | p | |||||
|---|---|---|---|---|---|---|---|---|
| Anti- Hbs≤10mUI/ml | Anti-HbS>10mUI/ml | |||||||
| Clinical characteristics | N=224 (%) | n=89 | (%) | n= 135 | (%) | IC95% | ||
| Age (Years), Me (IQR) | 34.8 (27.1 - 46.6) | 36.8 | (30.1 - 48) | 32.8 | (25.6 - 45.5) | 0.023 | ||
| Sex category | 0.28 | |||||||
| Female | 67(29.9) | 23 | (34.33) | 44 | (65.67) | . | ||
| Male | 157 (70.1) | 66 | (42.04) | 91 | (57.96) | 1.22 | (0.84 -1.79) | |
| Race (n=192) | 0.474 | |||||||
| White | 145 (75.52) | 61 | (42.07) | 84 | (57.93) | . | ||
| Afrocolombian | 47 (24.48) | 17 | (36.17) | 30 | (63.83) | 0,86 | (0.56 - 1.31) | |
| Comorbidities | ||||||||
| No | 175 (78.13) | 65 | (37.14) | 110 | (62.86) | . | 0.134 | |
| Yes | 49 (21.87) | 24 | (48.98) | 25 | (51.02) | 1.31 | (0.93 - 1.86) | |
| Alcohol consumption(n=220) | ||||||||
| No | 153 (69.55) | 60 | (39.22) | 93 | (60.78) | . | 0.88 | |
| Yes | 67 (30.45) | 27 | (40.30) | 40 | (59.70) | 1.02 | (0.72 - 1.46) | |
| Smoking (n=222) | ||||||||
| No | 176 (79.28) | 67 | (38.07) | 109 | (61.93) | . | 0.349 | |
| Yes | 46 (20.72) | 21 | (45.65) | 25 | (54.65) | 1.19 | (0.83 - 1.73) | |
| Drug abuse | ||||||||
| No | 182 (81.25) | 71 | (39.01) | 111 | (60.99) | . | 0.646 | |
| Yes | 42 (18.75) | 18 | (42.86) | 24 | (57.14) | 1.09 | (0.74 - 1.63) | |
| Weight (Kg), Me (IQR) | 65 (57.5-67.8) | 69 | (59.5 - 79.5) | 64 | (56-74.5) | 0.0211 | ||
| BMI, Me (IQR) | 23 (21-26) | 23 | (21-27) | 23 | (20-25) | 0.1582 | ||
| ≤24,9 | 144 (64.29) | 54 | (37.50) | 90 | (62.50) | . | ||
| 25 -29,9 | 57 (25.45) | 20 | (35.09) | 37 | (64.91) | 0,94 | (0.62 - 1.41) | 0.749 |
| ≥30 | 23 (10.27) | 15 | (65.22) | 8 | (34.78) | 1.73 | (1.21 - 2.51) | 0.012 |
Table 2 HIV-associated characteristics of the study population.
| Absence of seroconversion | RR | CI 95% | p | |||||
|---|---|---|---|---|---|---|---|---|
| Anti- Hbs≤10mUI/ml | Anti-HbS>10mUI/ml | |||||||
| Clinical characteristics | N=224 (%) | n=89 | (%) | n= 135 | (%) | IC95% | ||
| CD4+ (cells), Me (IQR) | 360 (261- 581) | 314 | (200-501) | 401 | (303-631) | 0.0007 | ||
| >200 cells | 35 (15.63) | 67 | (35.45) | 122 | (64.55) | |||
| ≤200 cells | 189 (84.37) | 22 | (62.86) | 13 | (37.14) | 1.77 | (1.29 - 2.43) | 0.002 |
| Viral load, Me (IQR) | 40 (0-3115) | 57 | (40-2074) | 40 | (0-3351) | 0.2992 | ||
| HIV Stage (CDC 2014) | ||||||||
| 1 | 52 (23.21) | 19 | (36.53) | 33 | (63.46) | . | ||
| 2 | 92 (41.07) | 33 | (35.87) | 59 | (64.13) | 0.98 | (0.63 - 1.54) | 0.93 |
| 3 | 80 (35.71) | 37 | (46.25) | 43 | (53.75) | 1.27 | (0.82 - 1.94) | 0.27 |
| ART regimen (n=222) | ||||||||
| NRTIs/NNRTIs | 153 (68.92) | 59 | (38.56) | 94 | (61.44) | . | ||
| NRTIs/Pis | 45 (20.27) | 18 | (40.00) | 27 | (60.00) | 1.03 | (0.69 - 1.56) | 0.861 |
| Regimens with INSTIs | 24 (10.81) | 12 | (50.00) | 12 | (50.00) | 1.29 | (0.82 - 2.02) | 0.288 |
| Antibiotic prophylaxis | ||||||||
| No | 158 (70.54) | 53 | (33.54) | 105 | (66.46) | . | 0.03 | |
| Yes | 66 (29.46) | 36 | (54.55) | 30 | (45.45) | 1.62 | (1.19 - 2.22) | |
| Coinfections | ||||||||
| No | 134 (59.82) | 48 | (35.82) | 86 | (64.18) | . | 0.144 | |
| Yes | 90 (40.18) | 41 | (45.56) | 49 | (54.44) | 1.27 | (0.92 - 1.75) | |
| Specific distribution | ||||||||
| Tuberculosis | 13 (5.8) | 4 | (30.77) | 9 | (69.23) | 0.76 | (0.33 - 1.75) | 0.496 |
| Syphilis | 41 (18.30) | 16 | (39.02) | 25 | (60.98) | 0.98 | (0.64 - 1.49) | 0.918 |
Characteristics of HBV vaccination and time to anti-HBs post vaccination
The median anti-HBs titers on admission were 0.6 mU/ml (IQR: 0-2). Most patients (91.9%) received the recommended HBV vaccine dose of 20 μg and 8.1% received 40 μg. The compliance with the three-dose schedule was 73.2%, of whom 5% completed it within the suggested times 0, 1 and 6 months. We found that 18.5% patients have received at least one dose of HBV vaccine during adulthood prior to being registered at the corresponding clinic. A relatively high frequency (69.2%) of patients received concomitant vaccination, with the influenza vaccine (52.2%) being the most frequently co-administered. The time elapsed from registration at the corresponding clinic to the first dose of HBV vaccine was 173.5 (IQR: 61-515) days. The median number of days between the last HBV vaccine dose administered and the anti-HBs sample collection after vaccination was 224 (IQR: 126-405) days (Table 3).
Table 3 Characteristics of HBV vaccination and anti-HBs.
| Absence of seroconversion | RR | CI 95% | p | |||||
|---|---|---|---|---|---|---|---|---|
| Anti- Hbs≤10mUI/ml | Anti-HbS>10mUI/ml | |||||||
| Characteristics associated with the vaccine | N=224 (%) | n=89 | (%) | n= 135 | (%) | IC95% | ||
| Number of doses | . | |||||||
| 1 | 18 (8.04) | 12 | (66.67) | 6 | (33.33) | . | ||
| 2 | 42 (18.75) | 18 | (42.86) | 24 | (57.14) | 0.64 | (0.39 - 1.04) | 0.09 |
| 3 | 164 (73.21) | 59 | (35.98) | 105 | (64.02) | 0.54 | (0.37 - 0.79) | 0.011 |
| Dose | ||||||||
| 20 µg | 204 (91.07) | 83 | (40.69) | 121 | (51.31) | . | ||
| 40 µg | 20 (8.93) | 6 | (30.00) | 14 | (70.00) | 0.74 | (0.37 - 1.47) | 0.351 |
| Time between D1 y D2 (d), Me(IQR) (n=206) | 33.5 (30-58) | 32.5 | (30 - 51,5) | 34.5 | (30 - 60) | 0.619 | ||
| Time between D2 y D3 (d), Me(IQR) (n=206) | 154 (146-184,5) | 154 | (146 - 181) | 154 | (144 - 186) | 0.700 | ||
| Scheme in suggested times | ||||||||
| No | 117 (52.23) | 49 | (41.88) | 68 | (58.12) | . | ||
| Yes | 107 (47.77) | 40 | (37.38) | 67 | (62.62) | 0.89 | (0.64 - 1.23) | 0.492 |
| Time between LD and Anti- HbS (d), Me (IQR) | 224 (126-405) | 261 | (161 - 455) | 196 | (106 - 373) | 0.01 | ||
| Previous vaccination | ||||||||
| No | 182 (81.25) | 74 | (40.66) | 108 | (59.34) | . | ||
| Yes | 42 (18.75) | 15 | (35.71) | 27 | (64.29) | 0.89 | (0.56 - 1.36) | 0.555 |
| Concomitant vaccine administration | ||||||||
| No | 69 (30.80) | 27 | (39.13) | 42 | (60.87) | . | ||
| Yes | 155 (69.20) | 62 | (40.00) | 93 | (60.00) | 1.02 | (0.72 - 1.45) | 0.923 |
Incidence and factors associated with lack of seroconversion
There were 37.1% patients in clinic A and 40.74% in clinic B with anti-HBs ≤ 10 IU/ml post vaccination, with a weighted mean incidence of lack of seroconversion of 39.73% (95%CI: 39.52-39.95). In the bivariate analysis, patients with lack of seroconversion were older (Me: 36.8 IQR: 30.1 - 48 years) than patients with seroconversion (32.8; 25.6-45.5). TCD4+ ≤ 200 cells both before (1,7; 1,3-2,4) and after (2,31; 1,76 - 3,05) HBV vaccination, a BMI ≥30 (RR=1.73 95%CI 1.21-2.51), the use of chemoprophylaxis for opportunistic pathogens (1,62; 1,19-2,22) and mycosis as coinfection (1.98; 1.37-2.87) showed an increased risk of lack of seroconversion. In contrast, receiving three doses of HBV vaccine instead of one was protective for lack of seroconversion (RR = 0.54, 95% CI: 0.37-0.79). The time elapsed between the last HBV vaccine dose and the date of anti-HBs post vaccination was higher in the group without seroconversion (Me = 261 IQR: 161- 455) compared to those who seroconverted (Me= 196 IQR: 106-373) (p=0.01) (Table 3). In the multiple model, age (aOR 1.03 95% CI 1.01- 1.05), BMI ≥30 (aOR 5.49 95% CI 1.90 - 15.84), and TCD4 ≤ 200 cells (aOR 95% 7.83 CI 2.05 - 29.85) remained statistically significantly associated with lack of seroconversion; and receiving two (aOR 0.246 95% 0.07 - 0.91 CI) or three (aOR 95% 0.20 CI 0.06 - 0.65) HBV vaccine doses instead of one remained protective. In the final model, the interaction between smoking and sex was statistically significant with non-smoking males (aOR 95% 2.66 CI 1.24 - 5.75) and smoking females (aOR 95% 11.46 CI: 1.62 -80.92) associated with lack of seroconversion compared to non-smoking females (Table 4). The model had a good fit (p= 0.35) with McFadden´s R2 of 0.149 and area under the ROC of 0.747.
Table 4 Analysis of factors associated with lack of seroconversion to HBV vaccine.
| Logistic regression analyses | |||
|---|---|---|---|
| Adjusted OR | CI 95% | P | |
| Age (yr) | 1.027 | (1.001 - 1.053) | 0.037 |
| BMI | |||
| < 25 | . | ||
| 25 - 29 | 1.042 | (0.514 - 2.109) | 0.910 |
| > 30 | 5.49 | (1.903 - 15.841) | 0.002 |
| CD4+ | 0.998 | (0.996 - 0.999) | 0.001 |
| >200 | . | ||
| ≤200 | 7.830 | (2.05 - 29.85) | 0.003 |
| Number of doses | |||
| 1 | . | ||
| 2 | 0.246 | (0.067 - 0.906) | 0.035 |
| 3 | 0.202 | (0.063 - 0.647) | 0.007 |
| Smoking / Sex | |||
| No Smoking / Female | . | ||
| No Smoking / Male | 2.665 | (1.235 - 5,752) | 0.013 |
| Smoking / Female | 11.46 | (1.623 - 80.922) | 0.014 |
| Smoking / Male | 2.375 | (0.908 - 6.209) | 0.078 |
Discussion
In this study, we identified a high prevalence of under the protective levels of HBV in newly registered PLWH (73.78%), a 39.73% incidence of lack of seroconversion to HBV vaccine, and clinical and vaccine-related factors associated with lack of seroconversion. The prevalence of PLWH that require HBV vaccination in our study falls between the 53% reported in Brazil 17 and 85.22% in Chile 18. This variability may be explained by the differences in the studies design, in Brazil this prevalence was measured indirectly with the vaccination card, overestimating the results. Additionally, in Colombia, the vaccination program aims to ensure universal coverage regardless of health insurance.
The incidence of lack of seroconversion found in our study is similar to the 40.12% reported in Brazil 19 and the 35% after three intramuscular doses of 20 μg HBV vaccine according to a multicenter clinical trial in France 20. Patient and clinical characteristics, such as age, BMI, and TCD4 count were associated with a lack of seroconversion. Regarding age, In Brazil most of the studies did not find association, and this could be partially explained by the differential HBV vaccination strategies for PLWH where double doses (40μg) are used 17,19,21-23. In Peru 24, the vaccine schedule is the same as that administered in Cali, and the results were similar. Our BMI results differ from those of Potsch et al., who did not find an association with BMI possibly due to the cut-off used (≥25 kg/m2) 25 instead of ≥ 30 we used. BMI as a continuous variable has shown an association between low BMI and better seroconversion rates 20, suggesting that obesity is a modifiable factor that could influence HBV vaccine response in PLWH. Despite the differences in the cutoff point criteria (<500, <350, <200 cells/mm3) used for the analysis, low TCD4+ counts have been frequently associated with lack of seroconversion in PLWH 12,20,24,26,27, for this reason, some studies prefer to exclude patients with CD4<200 cells 22, which explains the heterogeneity in finding the association with the outcome. On the other hand, although suppression of HIV viral load has been found to be associated with an improved response to vaccination 10,25,27,28, we did not find this finding as 79.46% of patients had undetectable viral load (<40 copies) during follow-up. Of note, most of the studies cited were conducted more than 10 years ago and currently, ART coverage and drug tolerability have improved, achieving greater adherence to treatment with a consequent better virological control, which could explain the lack of association in the most recent studies.
Female sex has been described as a predictor of seroconversion 20 and we found that non-smoking males have an increased risk of lack of seroconversion compared to non-smoking women; however, the protective effect of the female sex was not observed in active smokers. This could be partially explained by the increased risk of lack of seroconversion in tobacco users, as smoking has been found to modify the levels of soluble tumor necrosis factor receptor, which has been identified as a predictive indicator of HBV vaccine response 29. Launay et al., in France found better seroconversion in non-smokers patients compared to smokers 20 and several reviews highlighted the role of smoking as a modifier of vaccine response 6,7,9; however, it is important to note that the number of female smokers in the study was small, which raises concerns about the existence of sparse data bias therefore, further studies are required to confirm the interaction between sex and smoking.
Vaccine-related factors such as dose and total number of doses have been previously reported to be associated with the immune response to HBV in PLWH 7,9,10,12-14,20,25,27, in the cohort, approximately 65% of patients received the three doses of HBV vaccine over the recommended time frame of 0-2-6 months. Failure to adhere to this schedule was not associated with seroconversion rates. Evidence in the general population showed that the time between the first and second doses of HBV can be as long as 10 months, and between the second and third doses can be as long as 11 months without significant changes in serological protection rates 30-32. This indicates that the administration of the HBV vaccine leaves room for flexibility that could facilitate the completion of the three-doses regimen. As expected, a complete three-doses schedule or even two doses of HBV vaccine decreased the lack of seroconversion; therefore, this must be encouraged. We were not able to study the effect of dose as most patients received the standard 20 µg; however, we found that only 6% of the patients who received 40 µg showed anti-HBs ≤ 10 IU/ml.
International guidelines recommend the measure of anti- HBs titers between 4 -16 weeks after the last dose; anti-HBs is usually measured at 60 days post-vaccination 1,33-35. In our cohort in Cali, the time until anti-HBs measurement was much longer (Me: 224 days from the last dose of the HBV vaccine). In PLWH, immune senescence is faster that in the general population 32,35,36; hence, the lack of seroconversion in our study could be partially explained by the decrease in anti-HBs titers with time after vaccination.
This study has some limitations that need to be considered. The retrospective design cannot avoid the information bias introduced by the poor quality of some clinical records. However, we believe that the impact on the findings is relatively low because of the use of standardized electronic clinical records and an exhaustive review of data sources. Information bias is likely to be non-differential which would bias the associations to the null, underestimating the force of the found associations. Finally, we did not gather information on other variables, such as hepatitis C coinfection, and time on antiretroviral therapy, which could be considered in future studies. Some strengths of the study are the precision in the estimates, exploration of a variety of co-infections, use of prophylaxis for opportunistic infections, and concomitant vaccines in their association with lack of seroconversion. Our study reflects a real- life scenario under routine clinical practice with vaccination regimens different from the standard recommendations and delays in anti-HBs control post-vaccination.
In conclusion, the results showed that a high proportion of PLWH in our setting required HBV vaccination, and that there was variability among the HBV used schemes, but most patients received the standard 20 µg dose two or three times. The incidence of a lack of seroconversion was comparable to that reported in Latin America. Increasing age, TCD4 count ≤ 200 cells, obesity, and smoking in the female sex are associated with a lack of seroconversion. These factors could be considered to update the current guidelines for HBV infection in PLWH in Colombia. However, the implementation of more effective HBV vaccination strategies and anti-HBs follow-up post-vaccination adapted to the characteristics of PLWH is urgently needed to improve the prevention of HBV infection in this population.

