


 Spanish (pdf)
 Article in xml format
 Article references
 Send this article by e-mail
 Cited by SciELO
  Cited by Google
  Similars in
SciELO
Similars in
SciELO  Similars in Google
 Permalink
Introduction
The human immunodeficiency virus (HIV) is an RNA virus that belongs to the Retroviridae family, specifically to the Lentivirus genus. This virus was isolated for the first time in 1983, and since then, extensive research efforts have been made to determine the pathogenesis, transmission mechanisms, and epidemiology of the infection 1,2. According to data from the WHO and UNAIDS, it was estimated that in 2022, there were 39.0 million people in the world living with HIV. 3.
This virus has several target cells, including dendritic cells, macrophages, and CD4+ T cells. Consequently, the presentation of HIV-infected patients is given by the degree of compromise of the immune system, for this reason, the CD4+ T cell count is used for clinical staging 4.
Currently, HIV infection is treated with antiretroviral therapy, which has significantly improved patient survival and has slowed the progression to acquired immunodeficiency syndrome (AIDS). These drugs act by inhibiting viral enzymes such as reverse transcriptase (abacavir, lamivudine, efavirenz), integrase (dolutegravir, raltegravir), protease (ritonavir, atazanavir), and receptors that allow the virus to enter cells (enfuvirtide, maraviroc) 5.
Early and adequate management of these patients is very important, since infection by this virus causes a multisystemic inflammatory response. For this reason, the clinical practice guideline of the HIV Medicine Association of the Infectious Diseases Society of America (IDSA) recommends as an initial evaluation to perform some basic tests, such as kidney function, liver function, glucose, lipid profile, among others 6.
In addition to these metabolic markers, there are micronutrients that function as cofactors, enzymes, or hormones, that are necessary for an adequate immune response, such as vitamin D (VD). This hormone was initially only described in bone metabolism, since it increases intestinal calcium and phosphate absorption, stimulates renal calcium reabsorption, and thus facilitates bone mineralization 7; however, VD has effects on most nucleated cells since its receptor can bind to more than 10,000 loci and affects the transcription of 200-1,000 genes in the human genome 8. In such a way that the effects of this vitamin go far beyond calcium and bone homeostasis.
Currently, the US Preventive Services Task Force (USPSTF) states that there is insufficient evidence to support screening for VD deficiency in asymptomatic adults 9. Though, regarding HIV-infected patients, the European AIDS Clinical Society (EACS) guidelines recommend measuring VD levels in all HIV-infected patients with low bone mass density, a history of fracture, high risk of fracture, or any other predisposition for low VD levels 10. Multiple clinical trials have observed a higher proportion of hypovitaminosis in HIV-infected patients and a positive impact on bone mineral density and immune response when performing supplementation 11,12. However, most of the studies were carried out in Europe and North America, while in Colombia there are no studies that evaluate the association of hypovitaminosis D with multiple variables in HIV-infected patients, then this work is a first approach in our country. The objective of this study is to determine and establish possible associations between the serum level of VD and clinical, immune, metabolic, and nutritional variables in a cohort of adult patients diagnosed with HIV who attended a health provider institute in Bogotá in the year 2016-2017.
Materials and Methods
An observational, cross-sectional study was carried out in adults diagnosed with HIV infection who attended a health provider institution in Bogotá, Colombia (Servicios y Asesorías en infectología) during 2016 and 2017 for the control and management of their disease.
The present study was approved by the ethics committee of the Facultad de Medicina de la Universidad Nacional de Colombia, with the evaluation act No. 006 - 052 - 17 of April 27, 2017. It was conducted in accordance with Declaration of Helsinki and the International Ethical Guidelines for Biomedical Research in Human Subjects indicated by the Council for International Organizations of Medical Sciences (CIOMS) and the World Health Organization. Furthermore, considering that it is a risk-free investigation (according to “Resolución 8430 de 1993 del Ministerio de Salud de Colombia”), it was determined that it does not require the use of informed consent, however all patients, signed an agreement to participate in this study under confidentiality and anonymity.
Inclusion criteria were age more than 18 years and previous diagnosis of HIV infection, regardless of whether the patient was on antiretroviral treatment or has other infections (such as tuberculosis, hepatitis B). Exclusion criteria were inactivity in the follow-up program, use of VD supplements at therapeutic doses (more than 600-800 IU/day) and pregnancy or breastfeeding.
All data were collected through review of the patients medical and nutritional histories between May and August 2017. These included data such as serum level of calcidiol (25(OH)D) (measured by electrochemiluminescence), a basic metabolic panel (fasting blood glucose, total cholesterol, HDL, LDL, triglycerides, serum creatinine), HIV viral load, CD4 count, total lymphocytes and parameters related to the anthropometric classification of nutritional status (based on weight, body mass index, mid-upper arm muscle area and mid-upper arm fat area). All body measurements of all patients were performed by the same nutritionist, as part of an institutional protocol for routine follow-up of anthropometric measurements of all patients.
Similarly, important demographic and clinical data from the medical history were recorded, such as age, sex, race, area of residence, HIV staging, history of diabetes mellitus, chronic kidney disease, tuberculosis, previous use of medications and/or nutritional supplements, sun exposure, physical activity, alcohol consumption, and smoking.
Currently, there is controversy regarding the definition of adequate VD levels, since there is no consensus among experts 13, In this way, 25(OH)D levels (the best indicator of body stores of VD) were classified as follows: sufficiency (> 30 ng/ml), insufficiency (20 ng/ml - 29,99 ng/ml), and deficiency (< 20 ng/ml), All the paraclinical data were obtained between May and August 2017 from the medical records, since the institution routinely requests these data every 6 months. The anthropometric variables were taken from the closest nutritional follow-up to the date when the 25(OH)D levels were measured.
Initially, a univariate descriptive analysis was performed using STATA Software version X. Subsequently, the bi-serial correlation coefficient for those categorical variables and the Spearman correlation coefficient were calculated, determining p<0.2 as a statistically significant value. Finally, a linear regression was developed where p<0.05 was defined as a value, and a predictive model was made with 2 variables of interest. The present study was approved by the ethics committee of the Facultad de Medicina de la Universidad Nacional de Colombia, with the evaluation act No. 006 - 052 - 17 of April 27, 2017.
Results
A database of 163 patients was obtained, of which 2 were not included in the study due to exclusion criteria. In this way, the final sample was 161 patients, however, all the variables were only recorded in 132 patients (statistical power of 87%). The mean age was 45.48 years (normal distribution with p value = 0.765 in the Shapiro-Wilk Test), 7.45% were women, and 92.55% were men. Regarding race, 71.43% of the patients self-identified as belonging to the "other" group, which includes mestizos, mulattoes, Zambos, and/or indigenous people, followed by the "white" race (27.33%) and “Afro-Colombian” (1.24%). Most of the sample resided in Bogotá, Colombia (81%) (Table 1).
Table 1 Description of qualitative variables of HIV-infected patients
| Item | N | Percentage | Item | n | Percentage | ||
|---|---|---|---|---|---|---|---|
| Sex | Male | 149 | 92,55% | Mid-upper arm muscle area | Normal (10<=p<=90) | 121 | 75,38% |
| Female | 12 | 7,45% | Moderate deficit (5<=p<=10) | 9 | 5,38% | ||
| Race | Others | 115 | 71,43% | Severe deficit (p<5) | 19 | 11,54% | |
| White | 44 | 27,33% | High muscle (p>90) | 12 | 7,69% | ||
| Afro-Colombian | 2 | 1,24% | Currently receiving treatment | Yes | 154 | 95,65% | |
| Habits of life | Physical activity | 51/137 | 37,23% | No | 7 | 4,35% | |
| Alcohol consumption | 2 | 1,24% | Types of combinations | None | 8 | 1,86% | |
| Active smoking | 17 | 10,56% | 2 NRTI + 1 NNRTI | 91 | 56,52% | ||
| Comorbidities | Hypothyroidism | 31 | 19,25% | 2 NRTI + 1PI | 47 | 29,19% | |
| Tuberculosis | 9 | 5,59% | 2 NRTI + 1 II | 11 | 6,83% | ||
| Type 2 Diabetes Mellitus | 1 | 0,62% | Other | 4 | 2,48% | ||
| Chronic Kidney Disease | 1 | 0,62% | Current stage | Indeterminate* | 4 | 2,48% | |
| Metabolic profile | Hyperglycemia | 3 | 2% | A1 | 72 | 44,72% | |
| Hypertriglyceridemia | 11 | 7% | A2 | 33 | 20,50% | ||
| Hypercholesterolemia | 19 | 12% | A3 | 5 | 3,11% | ||
| Low HDL | 16 | 10% | B1 | 4 | 2,48% | ||
| Mixed dyslipidemia | 49 | 30% | B2 | 4 | 2,48% | ||
| Hyperglycemia with dyslipidemia | 31 | 19% | B3 | 0 | 0% | ||
| Normal | 31 | 19% | C1 | 12 | 7,45% | ||
| Indeterminate* | 1 | <1% | C2 | 21 | 13,04% | ||
| Body Mass Index (BMI) | Mild thinness | 4 | 2,48% | C3 | 6 | 3,73% | |
| Moderate thinness | 2 | 1,24% | Viral load | Detectable | 40 | 24,84% | |
| Normal | 97 | 60,25% | Undetectable | 121 | 75,26% | ||
| Overweight | 52 | 32,30% | Current CD4 count | >500 cells/mm3 | 93 | 57,70% | |
| Obesity | 6 | 3,73% | 200-499 cells/mm3 | 61 | 37,80% | ||
| Weight loss | No deficit | 117 | 72,70% | <200 cells/mm3 | 7 | 4,34% | |
| Mild deficit | 9 | 5,59% | Use of supplements | Previous | 23 | 7,01% | |
| Moderate deficit | 2 | 1,24% | Current | 34 | 10,37% | ||
| Severe deficit | 3 | 1,86% | VD levels | Deficiency | 37 | 22,98% | |
| Indeterminate* | 30 | 18,63% | Insufficiency | 61 | 37,89% | ||
| Mid-upper arm fat area | Normal (10<=p<=90) | 99 | 61,54% | Sufficiency | 63 | 39,13% | |
| Moderate deficit (5<=p<=10) | 19 | 11,54% | |||||
| Severe deficit (p<5) | 38 | 23,85% | |||||
| Excess fat (p>90) | 5 | 3,08% | |||||
*Indeterminate: It was not possible to obtain such information from the patient's medical history
BMI: Body mass index, HDL: High density lipoprotein, NRTI: Nucleoside Reverse Transcriptase Inhibitor, NNRTI: Non-Nucleoside Reverse Transcriptase Inhibitor, VD: Vitamin D.
Habits of life and comorbidities
Exposure to sunlight was inquired through the question "How many minutes a day do you expose yourself to the sun directly without physical barriers between 6 am and 6 pm?" Data from only 132 patients were collected, and the mean was 19.25 minutes/day (SD=43.35 minutes). Regarding physical activity, of 137 patients, 51 (37.23%) reported doing physical activity. Additionally, of 161 patients, 2 reported alcohol consumption (1.24%) and 17 active smoking (10.56%).
The most frequent comorbidities were hypothyroidism (31 patients, 19.25%), tuberculosis (9 patients, 5.59%), type 2 diabetes mellitus (1 patient, 0.62%) and chronic kidney disease (1 patient; 0. 62%). The most frequently used medication was levothyroxine (31 patients, 19.25%) and fibrates (13 patients; 8.07%).
Classification and history related to HIV infection
Most patients were between 3 and 12 years after the diagnosis of HIV infection, with an average of 8.23 years. At the time of the study, 95.65% of the patients were being treated with antiretroviral therapy (ART), of which 52.17% had only had one type of ART regimen, 22.98% had two different regimens, and 14.28% had 3 or more ART combinations since diagnosis. The most frequent ART regimens were TDF+FTC+EFV (29%), AZT+3TC+EFV (21%), ABC+3TC+EFV (15%), TDF+FTC+ATV+RTV (14%), and AZT+3TC+NVP (12%). The average time of an ART combination was 4 years. On the other hand, 5 patients did not have treatment because it was a de novo diagnosis at the time the blood tests were taken, 1 patient was considered an elite control and 2 patients had not started ART therapy by their own decision.
Based on the classification by the Center for Infectious Diseases (CDC) 14, most of the patients were stage A1 (31.68% at the time of diagnosis and 44.72% at the time of the study). Additionally, it was found that 75.26% of individuals had an undetectable HIV viral load, 57.7% of patients have a CD4+ T cells count greater than 500 cells/mm3, 37.8% had a count between 200 and 499 cells/mm3, and 4.34% had less than 200 cells/mm3 at the time of the study. The mean total lymphocyte count was within the normal range, and more than 50% of the patients had counts greater than 1500 cells/mm3, which is within the normal range. (Table 2)
Table 2 Description of quantitative variables of HIV-infected patients
| Variable | N | Mean | Standard deviation (SD) |
|---|---|---|---|
| Age (years) | 161 | 45,48 | 11,34 |
| Exposure to sunlight (min) | 132 | 19,25 | 43,35 |
| Time since diagnosis (years) | 161 | 8,23 | 6,3 |
| Weight (kg) | 161 | 69,98 | 10,23 |
| BMI (kg/m2) | 161 | 24,41 | 3,13 |
| CD4+ count (cells/mm3) | 161 | 586,97 | 254,49 |
| Total lymphocytes (Cells/mm3) | 160 | 2296,94 | 692,44 |
| Glycemia (mg/dL) | 161 | 94,24 | 11,49 |
| Triglycerides (mg/dL) | 160 | 199,36 | 91,39 |
| Total cholesterol (mg/dL) | 160 | 200,16 | 46,09 |
| LDL cholesterol (mg/dL) | 160 | 119,21 | 33,55 |
| HDL cholesterol (mg/dL) | 160 | 47,14 | 12,44 |
| Creatinine (mg/dL) | 161 | 1,03 | 0,21 |
| Vitamin D levels (ng/ml) | 161 | 28,5 | 10,37 |
BMI: Body mass index, HDL: High density lipoprotein, LDL: Low density lipoprotein
Metabolic profile and anthropometric classification of nutritional status
Out of the patients included in the study, 80% had some metabolic alteration, the most common disorder observed was mixed dyslipidemia (30%). The mean of these lipid profile values was triglycerides 199.36 mg/dL (SD=91.39), total cholesterol 200.16 mg/dL (SD=46.09), LDL cholesterol 119.21 mg/dL (SD=33.55), and HDL cholesterol 47.14 mg/dL (SD=12.44). On the other hand, the mean of basal glycemia was 94.24 mg/dL (SD=11.49) and creatinine was 1.03 mg/dL (SD=0.21).
Regarding anthropometric measurements, 1.24% had moderate malnutrition, 2.48% had mild malnutrition, 60.25% had a normal body mass index (BMI), 32.3% were overweight and 3.73% had obesity. Additionally, 70% of the sample did not present a nutritional deficit based on the percentage of weight change compared to usual. The average abdominal circumference was 87.26 cm (SD: 9.45 n=135) and 63% did not have abdominal obesity. On the other hand, most of the patients were between the 10th and 90th percentile for fat and muscle mass, which represents adequate reserves according to the Frisancho and The Third National Health and Nutrition Examination Survey (NHANES III) tables for age and sex 15,16.
Use of nutritional supplements
Regarding the use of nutritional supplements containing VD (no more than 800 IU daily), 7.01% reported consuming in the last 3 months prior to the test and 10.37% were taking supplements at the time of the study.
Vitamin D levels
The serum level of 25(OH)D in the study sample was 28.12 ng/ml (SD: 10.37). 60.87% of the patients had values below the minimum threshold of sufficiency (<30 ng/ml), and the majority (60.87%) were classified as "insufficient" (20 ng/ml - 29,99 ng/ml) (Table 1). A correlation was made between VD levels and the other variables recorded in the clinical history. A significant correlation (p<0,05) was found with sun exposure (p<0.0001), current ART duration (p = 0,05), triglycerides (p = 0.014), and total lymphocyte count (Table 3). Subsequently, variables with p values <0.2 were included in a regression model, and a significant correlation was found with sun exposure, creatinine levels, and the type of antiretroviral therapy (Table 4). There was also a significant correlation with triglycerides, total cholesterol, and time elapsed after diagnosis, nevertheless, these were not included due to being possible confounding variables. It was considered appropriate to use a backward method to determine the variables that should remain in the analysis, for which a cut-off point of 0.05 was used to eliminate the other variables (Table 5).
Table 3 Correlation of Vitamin D with important variables
| Variable | Spearman's Rho (Correlation coefficient) | P value |
|---|---|---|
| Age | 0,1005 | 0,2048 |
| Sex | -0,0179 | 0,8216 |
| Sun exposure time | 0,3503 | <0,0001* |
| Hypothyroidism | -0,0423 | 0,5939 |
| HIV diagnosis | -0,1205 | 0,1278* |
| CD4 cell count | -0,0161 | 0,8364 |
| HIV viral load | -0,0173 | 0,8274 |
| Current antiretroviral therapy (ART) | 0,0141 | 0,8586 |
| Type of ART | -0,1059 | 0,1882* |
| Duration current ART | -0,1543 | 0,05* |
| Use of zidovudine (AZT) | -0,1074 | 0,1751* |
| Use of efavirenz (EFV) | 0,0916 | 0,2478 |
| Use of atazanavir (ATV) | 0,0113 | 0,8866 |
| Use of darunavir (DRV) | 0,0096 | 0,9042 |
| Use of lopinavir (LPV) | -0,0083 | 0,9171 |
| Use of ritonavir (RTV) | 0,075 | 0,3442 |
| Use of tenofovir disoproxil fumarate (TDF) | 0,1434 | 0,0696* |
| TDF use time | -0,041 | 0,606 |
| AZT use time | -0,0721 | 0,3636 |
| EFV use time | -0,1353 | 0,087* |
| Time of use of protease inhibitors | -0,0405 | 0,6096 |
| Creatinine | 0,1151 | 0,146* |
| Triglycerides | -0,1934 | 0,014* |
| Glycemia | 0,0329 | 0,6797 |
| Total cholesterol | -0,1363 | 0,085* |
| Body Mass Index | -0,097 | 0,2209 |
| Mid-upper arm muscle area classification | -0,0189 | 0,8312 |
| Mid-upper arm fat area classification | 0,0888 | 0,3149 |
| Abdominal circumference | -0,0622 | 0,4736 |
| Total lymphocytes count | -0,1666 | 0,0352* |
Variables with a p value <0.2 were included for the regression model*
Table 4 Full regression model
| 25(OH)D | Coefficient | Standard error | T | P>t | [95% confidence interval] | |
|---|---|---|---|---|---|---|
| Sun exposure time | 0,0851 | 0,0189 | 4,5 | 0,000* | 0,0477 | 0,1225 |
| Total lymphocytes count | -0,0020 | 0,0012 | -1,74 | 0,084 | -0,0043 | 0,0003 |
| Type of scheme | ||||||
| 2 NRTIs + 1 NNRTI | 0,0433 | 6,6361 | 0,01 | 0,995 | -13,0981 | 13,1846 |
| 2 NRTIs + PI | 0,1657 | 6,7541 | 0,02 | 0,98 | -13,2093 | 13,5408 |
| 2 NRTIs + II | -5,8669 | 7,2543 | -0,81 | 0,42* | -20,2325 | 8,4986 |
| Other | -19,6846 | 9,9990 | -1,97 | 0,051 | -39,4853 | 0,1161 |
| Creatinine | 11,5710 | 4,1404 | 2,79 | 0,006* | 3,3720 | 19,7700 |
| Constant | 19,2800 | 8,0262 | 2,4 | 0,018 | 3,3858 | 35,1741 |
II = Integrase inhibitor; NNRTI= Non-Nucleoside Reverse Transcriptase Inhibitor; NRTI = Nucleoside Reverse Transcriptase Inhibitor; PI = Protease inhibitor
*These variables were included for the reduced regression model based on a backward method (a cut-off point of 0.05 was used to eliminate the other variables)
Table 5 Reduced regression model
| 25(OH)D | Coefficient | Standard error | T | P <0,05 | [95% confidence interval] | |
|---|---|---|---|---|---|---|
| Sun exposure time | 0,0911816 | 0,019187 | 4.75 | <0.0001 | 0.053214 | 0.1291491 |
| 2 NRTIs + II | -9.310259 | 3.128052 | -2.98 | 0.003 | -15.50011 | -3.120408 |
| Creatinine | 9.438927 | 3.810221 | 2.48 | 0.015 | 1.899188 | 16.97867 |
| Constant | 16.90027 | 3.973048 | 4.25 | <0.0001 | 9.038324 | 24.76222 |
II = Integrase inhibitor; NRTI = Nucleoside Reverse Transcriptase Inhibitor
Furthermore, a prediction of VD levels was made for a patient with adequate sun exposure (60 minutes daily) and VD levels were compared in each of the ART regimens. Thus, it was found that even correcting for sun exposure, the use of 2 nucleoside reverse transcriptase inhibitors + 1 integrase inhibitor was associated with VD levels in the range of insufficiency. Meanwhile, the other combinations obtained sufficient ranges of VD, although very close to the lower sufficiency cutoff (Figure 1 and 2).
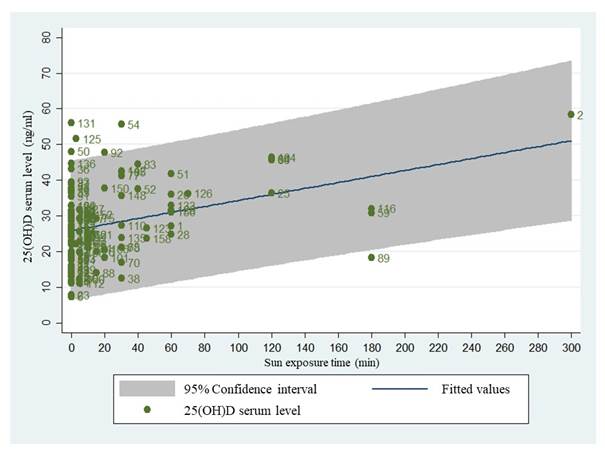
Figure 1 Linear regression of Vitamin D according to time of sun exposure. Linear regression of the relationship between sun exposure (in minutes) with vitamin D levels (in ng/ml), and dispersion of the study data in green.
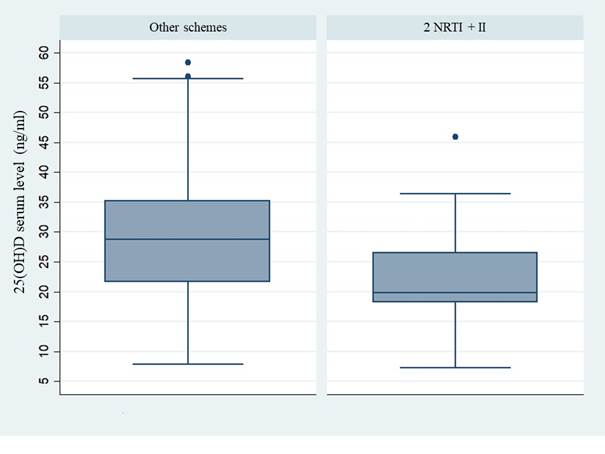
Figure 2 Linear regression of Vitamin D levels when there is use of 2 NRTIs + II vs other types of antiretroviral therapy
Discussion
VD is widely known as an important agent in calcium metabolism and bone homeostasis. However, in recent years it has been found to have multiple pleiotropic effects in multiple organs other than bone 17. Recent research has found that hypovitaminosis D is associated with increased cytokine production in patients infected with other retroviruses, such as HTLV-1 18. Thus, it is of great clinical relevance to know the manifestations and consequences of low levels of VD, especially in HIV-infected patients.
A major determinant of the course of the disease in HIV-infected patients is the condition of the immune system. This defines the number of opportunistic infections that could affect the patient, among other clinical outcomes. A study found that low levels of VD could worsen the course of the disease, while calcidiol supplementation was associated with increased CD4+ T-cell counts and decreased viral load 19.
Studies have been conducted to determine the prevalence of low levels of VD in HIV-infected patients. A 2023 study in Pakistan found a prevalence of vitamin D deficiency and insufficiency of 15% and 39%, respectively 20. In our study, the prevalence of low levels of VD (including deficiency and insufficiency) was 60.8%.
Multiple factors associated with VD regulation have been described, among which exposure to UVB rays is the greatest determinant, since they allow the cutaneous conversion of 7-dihydrocholesterol to cholecalciferol 21. In this study, a statistically significant direct association was found between VD levels and the time of sun exposure reported by the patient (rho=0.35).
One of the identified risk factors for low vitamin D levels is living at a low latitude 22, still, most of the participants in this research were residents of Bogotá, Colombia. This city has a latitude of 4°N, at 2640 m above sea level, in a region where there is solar radiation throughout the year, without seasonal variations. Nonetheless, when participants were questioned about their limited sun exposure time, the main justification provided was the perceived risk of UV radiation and its association with dermatological conditions.
According to the regression model performed, it was found that the VD increases 0.09 ng/ml for each minute of sun exposure. When comparing the different combinations of ART, it is shown that the use of 2 NRTI (Nucleoside Reverse Transcriptase Inhibitor) + II (Integrase inhibitor) was associated with 9.31 ng/ml of 25(OH)D lower compared to the other schemes. Also, when correcting the values with a sun exposure time of 60 min/day, it was found that VD levels are 7 ng/ml lower (insufficiency range) compared to the other ART combinations.
The association of hypovitaminosis D with specific types of antiretroviral therapy has been described in some previous studies. Brown TT and McComsey GA found in their study that initiation of ART that included efavirenz was associated with a decrease in 25(OH)D levels compared to combinations that did not include efavirenz 23. The mechanism that explains this finding could be due to the efavirenz-induced decrease in the expression of cytochrome P450, important for 25-hydroxylation of the VD 24.
In our study, no associations were found with the use of EFV, even though most patients had the TDF + FTC + EFV regimen. In contrast, the use of two types of schemes: AZT + 3TC + FTC + TDF and combinations with raltegravir (2 NRTI + II) were shown to be associated with hypovitaminosis D. In the first regimen, the deficiency could be explained by TDF nephrotoxicity, especially to the cells of the proximal convoluted tubule, responsible for the activation of 25(OH)D. However, regimens that include raltegravir could not be explained by its interaction with the cytochrome 25. Raltegravir is a drug used in patients with resistance to other therapies. Therefore, it is possible that these patients present multiple comorbidities that could be associated with hypovitaminosis D. Future studies are necessary to include a larger number of patients with this therapy.
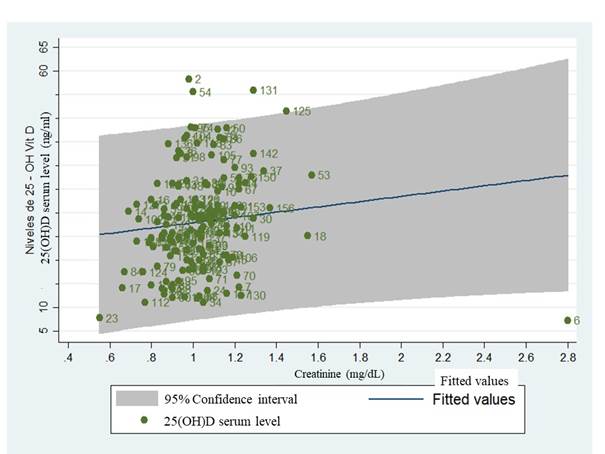
Multiple ART combinations (especially those that include protease inhibitors) are associated with impaired insulin sensitivity and metabolic syndrome 26. In our study, there was no significant correlation between VD levels and these metabolic alterations. On the other hand, creatinine showed a direct association with hypovitaminosis, finding that for every 0.1 mg/dL increase in creatinine, VD increases 9 ng/ml (Figure 3). However, since the rho of the initial correlation was very low, it is considered that future research should be carried out to evaluate other variables that were not included in this study, such as renal function and muscle metabolism.
At the end of the study, important strengths were identified, for example, variables that are not frequently included in other studies were analyzed (arm anthropometry, total lymphocytes, among others). These variables were kept as continuous variables, which helped to avoid the loss of valuable statistical information. In addition, the measurements were consistently taken by the same professional using the same instruments, which effectively controlled for measurement bias. On the other hand, within the limitations, some important variables were not included in the analysis, such as GFR, phototype, daily intake of VD, among others.
In summary, this research found that there is a high prevalence of low VD levels in HIV patients. Among the multiple factors that regulate this hormone, it was observed that there is a direct correlation with sun exposure. Additionally, serum creatinine also had a direct correlation, though, this study did not evaluate variables that could explain this phenomenon, therefore it should be the objective of future research.
The use of antiretrovirals was shown to be related to low levels of VD, especially the combination of 2 NRTI + II. This finding was observed even after correcting VD levels for a patient with adequate sun exposure. In this way, it is proposed to carry out routine screening and proper supplementation when indicated, not only for bone function but also to improve the immune response of patients.

