


Services on Demand
Journal
Article
 English (pdf)
 Article in xml format
 Article references
 Send this article by e-mail
Indicators
-
 Cited by SciELO
 -
 Access statistics
Related links
-
 Cited by Google
 -
 Similars in
SciELO
Similars in
SciELO -
 Similars in Google
Share

 Permalink
Perspectivas en Nutrición Humana
Print version ISSN 0124-4108
Perspect Nut Hum vol.13 no.1 Medellín Jan./June 2011
ARTÍCULOS DE INVESTIGACIÓN
Development of a food frequency questionnaire and a comparison with food records
Desarrollo de un cuestionario de frecuencia de consumo de alimentos y su comparación con registros de alimentos
Anne Chinnock1
1 Escuela de Nutrición, Universidad de Costa Rica. San José-Costa Rica. anne.chinnock@ucr.ac.cr
Artículo recibido: 27 de abril de 2011 Aceptado: 29 de junio de 2011.
Como citar este artículo: Chinnock A. Development of a food frequency questionnaire and a comparison with food records. Perspect Nutr Humana. 2011;13:57-69.
Abstract
Objective: Develop a food frequency questionnaire (FFQ) and assess its ability to rank a group of adults according to nutrient intake by a comparison with food records. Methods: This study consisted of 2 stages. A) Development of FFQ. Analysis of a food consumption database from a group of 60 adults from communities in the Central Valley of Costa Rica led to the identification of 10 food groups which contributed to most of between-person variance in energy and nutrient intake. A quantitative FFQ containing 111 foods from the 10 groups and covering 7 days was developed. B) Data was collected using the FFQ and a 4-day food record from a group of 52 adult inhabitants of an urban community in San José. Energy and nutrient intake as estimated by both methods were compared using Pearson's correlation coefficients and Student's t-test. Results: Pearson's correlation coefficients were above 0,4 for 18 of the 22 crude nutrient intakes. The degree of association was lower for energy-adjusted intakes, reflecting underestimation of energy intakes by the FFQ. Conclusions: When compared with the food record, the FFQ was able to rank the individuals according to crude nutrient intake. However, due to underestimation of total energy intake by the FFQ, the correlations for the energy-adjusted values were poorer. The FFQ requires some modifications in its design and its reproducibility and validity must be demonstrated before being used in epidemiological studies in Costa Rica.
Key words: food consumption, energy intake, nutritional epidemiology, nutrition surveys, dietary assessment, epidemiologic studies, questionnaires.
Resumen
Objetivo: desarrollar un cuestionario de frecuencia de consumo de alimentos (CFCA) y evaluar su habilidad para ordenar un grupo de adultos según su ingesta de nutrientes por medio de una comparación con registros de alimentos. Materiales y metódos:el estudio consistió en dos etapas. A) Elaboración de un CFCA. Un análisis de una base de datos de consumo de 60 adultos de comunidades del Valle Central de Costa Rica, identificó 10 grupos de alimentos que contribuyeron a la mayor parte de variación entre individuos en la ingesta de energía y nutrientes. Se elaboró un CFCA cuantitativo con 111 alimentos pertenecientes a los 10 grupos y que cubría 7 días. B) Se recolectaron datos por medio del CFCA y registros de 4 días en 52 adultos de una comunidad urbana de San José. Se compararon las ingestas de energía y nutrientes estimados por ambos métodos por medio de coeficientes de correlación de Pearson y la prueba t de Student. Resultados: las coeficientes de correlación de Pearson para 18 de los 22 nutrientes crudos fueron mayores a 0,4. El grado de asociación para las ingestas ajustadas por energía fue menor, debido a subestimación en la ingesta de energía por el CFCA. Conclusiones:en comparación con el registro, el CFCA logró ordenar los adultos según su ingesta de nutrientes no ajustados por energía. Sin embargo, debido a una subestimación en la ingesta total de energía por el CFCA, las correlaciones para los valores ajustados por energía fueron más pobres. El CFCA requiere algunas modificaciones y su reproducibilidad y validez debe ser demostrado antes de poder utilizarlo en estudios epidemiológicos en Costa Rica.
Palabras clave: consumo de alimentos, ingesta de energía, epidemiología nutricional, encuestas nutricionales, estudios epidemiológicos, cuestionarios.
INTRODUCTION
In the field of nutrition, there is great interest in developing methods that can be used in epidemiological studies to identify groups of individuals at increased risk of disease due to inadequate nutrient intakes, as well as to study the relationship between food and nutrient intake and health/disease occurrence. Such a method must be able to measure food consumption relatively easily, with sufficient accuracy and at a reasonable cost. One of the early studies in this field was reported by Heady (1), who tried to develop a 'short-cut method of classifying diets of thousands of middle-aged men'. Later on, the Food Frequency Questionnaire (FFQ) has been widely studied as a method which can estimate energy and nutrient intake in large groups of population for epidemiological studies. Cade (2), in a review of the literature on FFQs, reports 227 validation studies using this method. Among the most widely used FFQ are those developed by Willet and Hankin, authors who have described different methods for developing this type of questionnaire (3, 4). The FFQ has not been used widely in Costa Rica. The only validation study of a FFQ has been reported by Kabagambe et al (5) who assessed the validity and reproducibility of a modified version of the 135-item FFQ developed by Willett et al (6) among 120 adults. This leads one to the question of how a FFQ, using a food list developed from data on food consumption among a group of Costa Rican adults, would perform in terms of its ability to rank individuals according to nutrient intake. This article presents the results of the first stage in the development of such a method. Firstly, the method used to develop a quantitative FFQ is described and then the ability of the questionnaire to rank a group of adults according to their intake of different nutrients is tested using data from Food Records as a standard.
METHODS
Identification of indicators
At the start of this study, an attempt was made to identify food consumption variables that could serve as indicators of energy and nutrient intake. In order to do this, a database of food consumption and nutrient intake from Costa Rican adults was used. The database comes from an earlier investigation involving 60 Costa Rican adults (15 men and 15 women from a rural community and 15 men and 15 women from an urban area all within the Central Valley of Costa Rica) who carried out 7-day weighed food records. The methods and characteristics of this investigation have been published (7). The food composition table used to estimate nutrient content of foods consumed was developed for Central America and Panamá (8-9) with the addition of nutrient values for foods fortified by law in Costa Rica 2.
The following dependent variables were obtained for each of the 60 adults from this data base: average intake of energy and nutrients (protein, carbohydrates, total fat, monounsaturated fat, polyunsaturated fat, saturated fat, retinol equivalents, vitamin C, thiamin, riboflavin, vitamin B6, folate, vitamin B12, iron, magnesium, phosphorus, zinc, calcium, potassium, dietary fibre and cholesterol).
The following independent variables were developed:
Consumption of 39 different food groups. The food groups were not exclusive, for example chicken is included in 5 of the groups: chicken, fast foods, raw meats, raw and processed meats, foods of animal origin. Consumption of each food group was expressed as frequency and quantity, frequency being the number of occasions that a food group was consumed over the 7-day period, and quantity as the average daily consumption in grams. A list of the food groups is included in Appendix 1. Consumption of meats, some cereals and legumes were converted from crude to cooked amounts, and milk powder converted to the liquid equivalent prior to estimating average daily consumption for these foods.
Food habits for each subject. Three types of food habit variables were calculated for each person: a) frequency of mealtimes (total number of mealtimes reported by the person, and number of individual mealtimes, for example number of breakfasts, morning snacks, lunch, afternoon snacks, evening meals and evening snacks during the 7-day period) b) total number of foods eaten and number of different foods eaten during the 7 days3 c) number of fried foods eaten during the 7 days.
Development of the FFQ
An quantitative FFQ was developed based on the following 10 food groups which contributed towards a large degree of the between person variation in energy and nutrient intake: sugars, rice, red meat, milk products, legumes, eggs, milk, non starch vegetables, pasta and fruit. The questionnaire contained a list of 111 foods, all of which were from these food groups and were chosen as being commonly consumed by a group of adults in Costa Rica, according to the database used for the identification of indicators (7). The questionnaire was designed to be used during an interview, in which the interviewer read out each food item, and asked the person whether it had been eaten during the previous week. A period of one week was chosen as it was considered easier for individuals to remember food consumption over the past week compared to longer periods of time. Once the list was completed, the interviewer asked for the frequency of consumption during the previous week (on how many occasions the food had been eaten during the past 7 days) and the average portion size for each food consumed. Portion sizes were determined with reference to photos of food portions for 45 items (using photos of 3 or 6 different portion sizes for each food), as number of units (such as slices of pieces of fruit) for 23 items, as number of teaspoons and tablespoons for 13 items, with reference to a set of plastic cups for 12 items, and with reference to drawings of slices for 3 items. The food portion photos have been previously described (10). 15 food items were not quantified during the interview but converted to amount consumed using average portion sizes derived from the data base of 60 individuals (7). Interviews were carried out in 10 adults using the FFQ in order to detect any problems with the questions or their order in the questionnaire.
Comparison of FFQ with Food Records
A simple random sample of 213 houses was selected from a map of a small urban community (San Rafael de Montes de Oca) in the province of San José. Of these houses, 21 were not accessible or weren't found. The remaining houses were then visited and adults selected according to the following criteria: a) Costa Rican b) between 20 and 65 years of age c) if not literate, lived with someone who was literate. Only one adult was selected per house. Of the 192 houses that were located, in 72 cases no one was found at home despite several visits to the house, in 18 cases none of the family members possessed the selection criteria, and in 50 houses, the person refused to participate. So of the 102 houses where contact was made and an adult possessed the selection criteria, 52 (51,0 %) agreed to take part, 11 men and 37 women with an average age of 39 years. Each subject gave their written consent, after which they were interviewed in their home to obtain data on their socio-demographic characteristics and the interviewer asked for information on food consumption over the previous 7 days, recording the information in the FFQ. The FFQ interview took between 20 and 30 minutes to perform. After completing this part of the interview, the person was instructed on how to complete an Estimated Food Record (EFR) for 4 consecutive days, including one weekend day. This data collection process was carried out during a 28 week-period, between November, 2007 and May, 2008. The EFR method has been previously described (7).
Of the 52 subjects, 49 completed the EFR during 4 days, 2 during 3 days and one person for 2 days.
DATA ANALYSIS
Identification of indicators
The following analysis was carried out in order to identify the potential indicators:
The above analysis found that several of the distributions of the independent variables were significantly different from normal (number of mealtimes, frequency of consumption of food groups) and for this reason, Spearman's correlation coefficients were used to test for association with nutrient intake. The distributions of nutrient intake were, in the majority of cases, normal, except in the case of vitamin A, riboflavin, vitamin B12 and cholesterol. These nutrients were converted to natural logarithms for the multiple linear regression analysis
Comparison of FFQ with Food Records
The estimated amounts of foods consumed according to the EFR were converted to gram weights by the investigator using local tables of food portion sizes (11) and using the weights of foods displayed in photos (12). As mentioned previously, all food consumption data (EFR) was converted to nutrient values using Central American Food Composition Tables (8, 9) and software created in Epi Info (13). The average daily nutrient intakes for the EFR were calculated. Data from the FFQ was analyzed as follows: portion sizes as estimated in the FFQ from photos, household measures, number of units or slices, were converted to gram weights using locally-produced tables (11-12). For the 15 food items for which only frequency of consumption and not portion size was obtained during the interview, the amount consumed was calculated using average portion sizes derived from the data base of 60 individuals (7). Average daily consumption in grams was calculated as:
with 7 representing the number of days in the week.
Statistical analysis was performed using SPSS, version 12.0 for Windows (SPSS Inc. 2003). All nutrients with a non-normal distribution were converted to natural logarithms. The degree of association was measured by the Pearson's correlation coefficient for absolute and energy-adjusted nutrient intakes, using the energy-adjusted method recommended by Willet (14). A comparison of predicted and real energy and nutrient intake was made and significant differences were tested for using the Student's t-test.
Ethical considerations
The Ethical Scientific Committee of the University of Costa Rica granted permission for the study comparing the FFQ with EFR in 52 adults in the urban community of the province of San José
RESULTS
Identification of indicators
Table 1 shows the correlation coefficients for energy and each nutrient and the food group most associated with each nutrient intake. Food group consumption was expressed in two different ways, firstly as the amount consumed resulting from frequency X portion size and secondly, as frequency of consumption alone. As would be expected, when food group consumption was expressed in terms of average amount, rather than as frequency alone, there was a much higher degree of association with nutrient intake. This was true for all nutrients except for vitamin B6 (in this case quantity and frequency of food group consumption were associated to the same degree with nutrient intake).
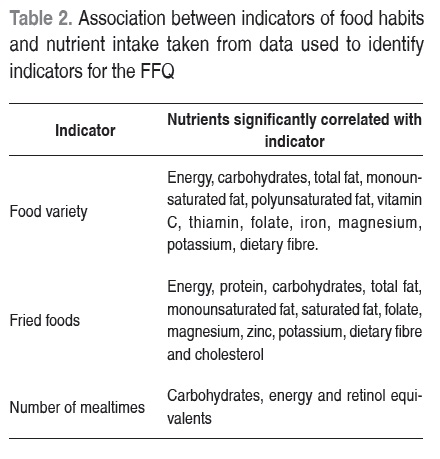
The variables reflecting variety in food habits were significantly correlated with 13 nutrients, the frequency of fried foods was significantly associated with 12 nutrients and the number of mealtimes was significantly associated with 3 nutrients. However, the degree of association was low for all these variables of food habits. (93,6 % of the correlation coefficients were below 0,4. See Table 2 for the nutrients that were significantly associated with each indicator of food habits).
Results of the multiple linear regression analysis showed that for energy and 14 of the 21 nutrients, it was possible to produce equations with an adjusted r value equal or above 0,7 (results not shown). This was not possible for the following nutrients: polyunsaturated fat, monounsaturated fat, retinol equivalents and vitamins B6 and B12; in all these cases the adjusted r values were below 0,5. This analysis identified the following 10 food groups as contributing towards a large degree of the between person variation in energy and nutrient intake: sugars, rice, red meat, milk products, legumes, eggs, milk, non starch vegetables, pasta and fruit.
Comparison of FFQ with Food Records
Tabla 3 shows the Pearson's correlation coefficients for energy and nutrient intake as determined by the EFR and as estimated by the FFQ. Also included are the Pearson's correlation coefficients for nutrient intake adjusted for energy intake. The correlation coefficients for most (16 of 22) of the nutrients when unadjusted for energy were above 0,5. The Pearson's correlation coefficients for energy-adjusted nutrient intakes were lower for most of the nutrients compared to the unadjusted values. The correlation coefficients for the energy-adjusted nutrient intakes were above 0,4 for most of the nutrients (13 of 22) and were significant for 18 of the 22 nutrients. When the values from the FFQ and the EFR for energy and nutrient intakes were compared (see Tabla 4), the average intakes from the FFQ were in most cases (17 of 22) less than EFR average intakes and in almost all cases (18 of 22) the difference reached statistical significance. It can be seen from Table 4 that the FFQ underestimated total energy consumption by a large degree, and this produced the lower correlation coefficients when the nutrients were adjusted for energy intake.
DISCUSSION
While information on an individual's food habits such as variety of foods eaten, number of mealtimes and frequency of consumption of fried foods can be obtained relatively easily by asking simple questions, this study found the degree of association between these variables and energy and nutrient intake was consistently low. After this, the study concentrated exclusively on consumption of specific food groups as indicators of energy and nutrient intake.
The design of a FFA involves determining which food items to include in the list, whether and how to include information on portion sizes and then deciding which categories to use for reporting frequency of food consumption. In terms of the construction of the food list, Willett (3) describes different approaches that can be used. One approach is to identify foods that are important sources of nutrients either by using information from food composition tables, or from food consumption data collected by food records or 24-hour recalls. An alternative method is to use regression analysis to identify those foods which contribute to the between-person variance in nutrient intake. As the objective of many epidemiological studies of diet and health status is to rank individuals rather than estimate absolute intake, this second method would seem more appropriate in the development of a FFQ. For example, a specific food could be an important source of a particular nutrient amount a group of individuals. However, if all individuals in the group consume the same amount of this food, it will not be important in discriminating between those individuals with a high or low intake of that nutrient.
Willett et al (6) used stepwise regression analysis to develop the list of foods to include in his FFQ. The present study used a similar approach but instead of including individual foods as the independent variables in the regression analysis, food groups were used. Once these groups which accounted for most of the between-person variance were identified, all foods belonging to that group and which are known to be consumed in Costa Rica were included.
The advantage of using this approach is that the number of items in the food list is lower, making the FFQ easier and less costly to apply and more likely to avoid producing fatigue in respondents which could occur when a longer list of foods is used. Apart from these advantages, the results of the correlation analysis show that this method of choosing which foods to include in the FFQ produced an acceptable ranking of the subject's nutrient intake as compared with the food record. However, due to the considerable underestimation of the energy intake by the FFQ (on average the FFQ estimated 67,4% of the energy intake of the EFR), nutrient intake estimates from the FFQ when adjusted for energy were correlated to a lower degree with those obtained from the food record. This indicates that the FFQ needs to be modified to include additional foods that are important sources of energy in the diet.
A comparison of food frequency (without portion size) and average daily amount of foods consumed (obtained from frequency of consumption and portion size) confirmed the findings of Nelson (15) that FFQ without quantity consumed is a much weaker indicator of exposure in epidemiological studies. For this reason, a decision was made to include portion sizes in the FFQ developed in the present study.
Both Willett (3) and Nelson (16) describe the different options available for including portion sizes in a FFQ. Firstly, an average portion size can be used for each food item. This has the advantage of simplicity in completing and analyzing the questionnaire, but this approach will reduce the instrument's sensitivity (16). Another approach is to include the average portion size in the questionnaire but allow the subject to describe their individual portion in terms of fractions or multiples of this average. And finally, the subject can be asked to describe the portion size in terms of household measures, standard portions or with the aid of photos, models, abstract forms or drawings. This latter method will capture a greater degree of between-person variation in portion sizes but will lengthen the time needed to complete the FFQ. The present study used this last method for estimating portion size. Photos of different portion sizes of foods have previously been developed (12) based on food consumption data from a rural and urban community in Costa Rica (17) and have been proved to be useful in previous studies (10). Using this method of estimating portion size, the FFQ took between 20 and 30 minutes to administer, an acceptable length of time for this type of questionnaire.
While this is not a validation study, it is possible to compare the results of the correlation analysis between the FFQ and the food records with similar analysis reported in the literature.
Nelson (15) presents correlation coefficients (unadjusted for energy intake) found in 12 studies of validation of FFQs published between 1968 and 1991. The results from the present study compare favourably with these studies: the correlation coefficients are greater than those found in the majority of these studies for energy, protein, total fat, carbohydrate, cholesterol and vitamin C and in the case of saturated fat, dietary fibre, calcium, iron and vitamin A, the correlation coefficients are around the middle of the range reported in these studies. A comparison with more recent studies reveals similar results. 15 validation studies of FFQs were identified (18-32). For all but one of these studies (32), around half of the correlation coefficients (including unadjusted and energy-adjusted) were higher in the present study. In the case of the study by Shatenstein and co workers (32), all the correlation coefficients (unadjusted for energy) reported were considerably higher than those reported in the other studies (18-31) and the present study.
Cade (2) published in 2004, a review of the design, validation and utilization of FFQs. For the review, databases were searched from 1980 to 1999. The authors published the mean correlation for energy, total fat, vitamins A and C, calcium and iron for 171 studies where the FFQ was compared against another dietary assessment method. The correlation coefficients reported in the present article are above the mean correlation coefficients presented by Cade for energy, total fat, vitamin C and iron.
Cade (2) found higher correlation coefficients in the following situations: a) when subjects were able to describe their own portion size rather than using a specified portion size or no portion size on the questionnaire b) an interview-administered rather than a self-administered questionnaire (in the case of fat, energy and vitamin A) c) newly developed questionnaires rather than a modified questionnaire (in the case of energy and fat) and d) a higher number of food items compared with a lower number. This last characteristic was also observed by Molag and co workers (33). The FFQ in the present study has all the first 3 characteristics mentioned by Cade.}
It is important to mention the limitations of this study. Firstly, the FFQ was developed using a database of food consumption information from 60 Costa Rican adults. In an ideal situation, food consumption data collected at the national level should be used to develop such questionnaires. However, this information is not currently available at the national level in Costa Rica. The national nutrition surveys use an 'apparent' food consumption questionnaire that enquires into the use, at family level, of a list of basic foods from the Costa Rican diet.
A second aspect of this study that is important to mention is the fact that the FFQ covered food consumption for the previous 7 days. This period was chosen as being more comparable to the 4 days used for the reference method. It was also probably easier for the individuals to remember food consumption over the 7 days rather than for longer periods. However, for epidemiological studies, a FFQ is required to estimate 'usual' or long-term intake of energy and nutrients and this must be taken into account in future studies.
This study has shown that a quantitative FFQ with a list of foods from those food groups which account for most of the between-person variance in energy and nutrient intake, can be interview-administered in a short period of time and allow an acceptable degree of accuracy in ranking a group of adults according to their nutrient intake. However, further work is needed in order to produce an instrument suitable for epidemiological studies in Costa Rica. The food list must include more items in order to increase the proportion of energy estimated by the FFQ, the questionnaire should be used to estimate 'usual' or long-term food consumption and finally, a reproducibility and validation study, ideally with the inclusion of biochemical indicators of nutrient intake, should be performed.
CONCLUSIONES
This preliminary study used a different approach in selecting the foods to include in a FFQ. While the questionnaire permitted a quick and easy assessment of energy and nutrient intakes in a group of adults, certain modifications are needed in its design and a complete study of its reproducibility and validity must be performed before it can be used epidemiological studies of diet and health status in Costa Rica.
ACKNOWLEDGEMENTS
I am grateful for the assistance provided by Dr. Xinia Fernández and MSc Miriam León both from the Nutrition School, University of Costa Rica. My gratitude extends to the nutrition students Ivania Mata, Melisa Vega, Annette Mora and Jessica Troyo and to all those whose willingness to provide information about their food consumption, made this study possible.
FINANCIAL SUPPORT
Part of this research was made possible by the financial support provided by the Vice Rectory for Investigation of the University of Costa Rica.
Appendix 1: List of food groups
Milk and milk products; eggs; chicken; pork; beef; processed meats; fish and shellfish; legumes; seeds and nuts; starchy vegetables; non-starchy vegetables; fruits; cereals; bread and biscuits; sugar; fats; beverages; pastries and puddings; soups and sauces; fast food; milk; milk products; rice; pasta; breakfast cereals; bread; biscuits; tortillas and popcorn; coffee and tea; milk beverages; red meat; vegetables and fruit; milk and milk beverages; non-starchy vegetables and fruit; rice and pasta; biscuits, pastries and puddings; meat; meat and meat products; foods of animal origin.
REFERENCIAS
1. Heady JA. Diets of bank clerks. Development of a method of classifying the diets of individuals for use in epidemiological studies. J Roy Statist Soc. 1961;124:336-61. [ Links ]
2. Cade JE, Burley VJ, Warm DL, Thompson RL, Margetts BM. Food-frequency questionnaires: a review of their design, validation and utilization. Nutr Res Rev. 2004;17:5-22. [ Links ]
3. Willett W. Food frequency methods In: Willett W. Nutritional epidemiology New York: Oxford University Press; 1990. p.69-91. [ Links ]
4. Hankin JH. 1986 23rd Lenna Frances Cooper Memorial Lecture: A diet history method for research, clinical and community use. J Am Diet Assoc. 1986;86:868-75. [ Links ]
5. Kabagambe EK, Baylin A, Allan DA, Siles X, Spiegelman D, Campos H. Application of the method of triads to evaluate the performance of food frequency questionnaires and biomarkers as indicators of long-term dietary intake. Am J Epidemiol. 2001;154:1126-35. [ Links ]
6. Willet WC, Sampson L, Stampfer MJ, Rosner B, Bain C, Witschi J, et al. Reproducibility and validity of a semiquantitative food frequency questionnaire. Am J Epidemiol. 1985;122:51-65. [ Links ]
7. Chinnock A. Validation of an estimated food record. Public Health Nutr. 2006;9:934-41. [ Links ]
8. Menchú MT, Méndez H, Barrera MA, Ortega L. Tabla de composición de alimentos de Centroamérica. Guatemala: PAHO/INCAP; 1996. [ Links ]
9. Menchú MT, Méndez H, Lemus L. Tabla de composición de alimentos de Centroamérica. 2 ed. Guatemala: PAHO/INCAP; 2000. [ Links ]
10. Chinnock A. Validation of a diet history questionnaire for use with Costa Rican adults. Public Health Nutr. 2007;11:65-75. [ Links ]
11. Chaverri MA, Rodríguez AM, Chinnock A. Peso de medidas caseras y porciones de alimentos y preparaciones comunes en Costa Rica. San José: Universidad de Costa Rica; 2001. [ Links ]
12. Chinnock A, Sedó Masis P. Porciones de alimentos y preparaciones comunes en Costa Rica y equivalencias del sistema de listas de intercambio. San José: Universidad de Costa Rica; 2001. [ Links ]
13. Dean AG, Arner TG, Sangam S, Sunki G, Friedman R, Lantinga M, et al. Epi Info 2002. Atlanta; Center for Disease Control and Prevention; 2002. [ Links ]
14. Willett W. Implications of total energy intake for epidemiologic analyses In: Willett W. Nutritional epidemiology. New York: Oxford University Press; 1990. p. 69-91. [ Links ]
15. Nelson M. The validation of dietary questionnaires. In: Margetts BM, Nelson M, eds. Design concepts in nutritional epidemiology. New York: Oxford University Press; 2009. p. 284-5. [ Links ]
16. Nelson M & Bingham SA. Assessment of food consumption and nutrient intake in Margetts BM and Nelson M (Eds) Design Concepts in Nutritional Epidemiology USA. Oxford University Press 2000:123-69. [ Links ]
17. Chinnock A. Consumo de algunos alimentos y preparaciones en niños preescolares y adultos de un área rural y una comunidad urbana del Valle Central de Costa Rica. Revista en Tecnología y Ciencia Alimentaria. 1993;2:1-6. [ Links ]
18. Nath SD, Huffman FG. Validation of a semiquantitative food frequency questionnaire to assess energy and macronutrient intakes of Cuban Americans. Int J Food Sci Nutr. 2005;56:309-14. [ Links ]
19. Mikkelsen TB, Osler M, Olsen SF. Validity of protein, retinol, folic acid and n–3 fatty acid intakes estimated from the food-frequency questionnaire used in the Danish National Birth Cohort. Public Health Nutr. 2005;9:771-8. [ Links ]
20. Meei-Shyuan L, Wen-Harn P, Kai-Li L, Mei-Shu Y. Reproducibility and validity of a Chinese food frequency questionnaire used in Taiwan. Asia Pac J Nutr. 2006;15:161-9. [ Links ]
21. Paalanen L, Mannisto S, Virtanen MJ, Knekt P, Rasanen L, Montonen J, et al. Validity of a food frequency questionnaire varied by age and body mass index. J Clin Epidemiol. 2006;59:994-1001. [ Links ]
22. Roddam AW, Spencer E, Banks E, Beral V, Reeves G, Appleby P, et al. Reproducibility of a short semi-quantitative food group questionnaire and its performance in estimating nutrient intake compared with a 7-day diet diary in the Million Women Study. Public Health Nutr. 2005;8:201-13. [ Links ]
23. Flood VM, Smith WT, Webb KL, Mitchell P. Issues in assessing the validity of nutrient data obtained from a food-frequency questionnaire: folate and vitamin B12 examples. Public Health Nutr. 2004;7:751-6. [ Links ]
24. Ishihara J, Yamamoto S, Iso H, Inoue M, Tsugane S, JPHC FFQ Validation Study Group. Validity of a self-administered food frequency questionnaire (FFQ) and its generalizability to the estimation of dietary folate intake in Japan. Nutr J. 2005;4:26. [ Links ]
25. Ke L, Toshiro T, Fengyan S, Ping Y, Xiaoling D, Kazuo T. Relative validity of a semi-quantitative food frequency questionnaire versus 3 day weighed diet records in middleaged Inhabitants in Chaoshan Area, China. Asia Pac J Cancer Prev. 2005;6:376-81. [ Links ]
26. Kelemen LE, Anand SS, Vuksan V, Yi Q, Teo KK, Devanesen S, et al. Development and evaluation of cultural food frequency questionnaires for South Asians, Chinese and Europeans in North America. J Am Diet Assoc. 2003;103:1178-84. [ Links ]
27. Lacey JM. Zinc-specific Food Frequency Questionnaire. Rev Can Prat Rech Diet. 2007;68:150-2. [ Links ]
28. Brantsaeter AL, Haugen M, Alexander J, Meltzer HM. Validity of a new food frequency questionnaire for pregnant women in the Norwegian Mother and Child Cohort Study (MoBa). Matern Child Nutr. 2008;4:28-43. [ Links ]
29. Chen Y, Ahsani H, Parvezi F, Howe GR. Validity of a food-frequency questionnaire for a large prospective cohort study in Bangladesh. Br J Nutr. 2004;92:851-9. [ Links ]
30. Goulet J, Nadeau G, Lapointe A, Lamarche B, Lemieux S. Validity and reproducibility of an interviewer-administered food frequency questionnaire for healthy French-Canadian men and women. Nutr J. 2004;3:13. [ Links ]
31. Hartwell DL, Henry CJK. Comparison of a self-administered quantitative food amount frequency questionnaire with 4-day estimated food records Int J Food Sci Nutr. 2001;52:151-9. [ Links ]
32. Shatenstein B, Nadon S, Godin C, Ferland G. Development and Validation of a Food Frequency Questionnaire. Can J Diet Pract Res. 2005;66:67-75. [ Links ]
33. Molag ML, de Vries JHM, Ocke MC, Dagnelie PC, van den Brandt PA, Jensen MCJF, et al. Design characteristics of Food Frequency Questionnaires in relation to their validity. Am J Epidemiol. 2007;166:1468-78. [ Links ]
Notas
2 The following foods are fortified in Costa Rica: rice, milk, wheat and maize flour and sugar.
3 Where a food was repeated in the same mealtime, it was counted once.