


 Spanish (pdf)
 Article in xml format
 Article references
 Send this article by e-mail
 Cited by SciELO
  Cited by Google
  Similars in
SciELO
Similars in
SciELO  Similars in Google
 Permalink
INTRODUCTION
The importance of variables such as temperature and dissolved oxygen in lake ecosystems lies fundamentally in the fact that these factors influence most of the organic and inorganic processes within the water body, playing an important role in the intensity of physicochemical processes, remineralization of organic matter and release of nutrients and metals from sediments (Bostrom et al., 1988; Chang et al., 2021; Christianson et al., 2020, Harris, 1999; Lewis Jr., 2000; Roldán & Ramírez, 2008; Wang et al., 2019).
Thermal stratification is the most important hydroclimatological factor driving biological processes in lake ecosystems, since density differences define the vertical mixing depth which in turn regulates the distribution of ions and suspended particles, which implies nutrient distribution and productivity (Branco et al., 2009; Melack, 1979). For temperate lakes, thermal stratification is defined when a difference of 1 °C per meter is reached in the water column (Cole, 1988; Wetzel, 1981). However, in tropical ecosystems, thermal differences of less than 2 °C between the surface and the bottom at elevated temperatures close to 24 °C can cause enough density difference to generate stable stratification (Branco et al., 2009; Lewis Jr., 1996; 2000).
There are four main time scales in lake stratification variation: interannual, annual, intra-annual and diurnal or nictameral (Richerson, 1991). Hutchinson and Löffler (1956) developed a classification of six types of lakes based on annual mixing patterns and predicted that lowland tropical lakes should be oligomictic (i.e., with periods of mixing more frequently than once a year) while those at high altitudes would be polyomictic (i.e., permanently mixed).
Although this classification was adjusted as data on tropical lakes became available (Lewis Jr., 1973; 1983b; Löffler, 1964; 1968), it was only when Lewis Jr. (1983a) revised it to include shallow tropical lakes, meromictic or incompletely mixed lakes and cold lakes with temperatures close to 4 °C, that eight classes of lakes were defined according to the type of mixing.
Richerson (1991) and Lewis Jr. (1996) state that although very little long-term data exist for tropical lakes, there is little difference between tropical lakes deep enough to stratify with subtropical or temperate lakes, insofar as these appear to show a strong degree of repetition in the seasonality of predictable annual mixing at a particular period of the year, the difference being that the mixing period in tropical lakes can be as short as one month or six weeks.
This paper presents for the first time the analysis of long-term records (ten years) of temperature, dissolved oxygen, pH and electrical conductivity in a tropical island reservoir, obtaining information that complements the revision of the classification of lakes based on mixing patterns made by Lewis Jr. (1983a).
MATERIALS AND METHODS
Study area
The Dominican Republic is located in the subregion of Middle America insular, in the Greater Caribbean Antilles, between latitudes 17º00'-20º00' N and longitudes 68º71'-72º00' W, with an area of 48,670.82 km² and occupies two thirds of the island of Hispaniola, which it shares with the Republic of Haiti (National Office of Educational Planning and Development [ONAPLAN], 2000).
The Hatillo reservoir, located in the Sánchez Ramírez province (Figure 1), was built in 1984 to store water for electric power generation and irrigation district purposes, in addition to playing an important role in flood control in the lower basin of the Yuna River (Gómez-Achecar, 1997). Table 1 summarizes the main morphometric and hydraulic characteristics of the reservoir, as well as the depth and transparency at the point where records were taken in the reservoir's limnetic zone.
Table 1 Main characteristics of the Hatillo reservoir
| Features | Value | Unit | Source |
|---|---|---|---|
| Altitude | 88 masl | msnm | Guzman et al., (2013). |
| Maximum surface area | 50 | km2 | |
| Maximum volume | 710 | hm3 | |
| Average inlet flow rate | 63.21 | m3 | |
| Total depth | 14.1-28 | m | In situ records |
| Secchi Depth | 0.8 - 4.0 | m | |
| Maximum length | 10.5 | km | Measured cartographically |
| Maximum width | 3.5 | km | |
| Average width | 4.8 | km | Calculated according to Wetzel (1981) |
| Average depth | 14.2 | m | |
| Relative depth | 0.35 | % | |
| Hydraulic retention time | 0.36 | years |
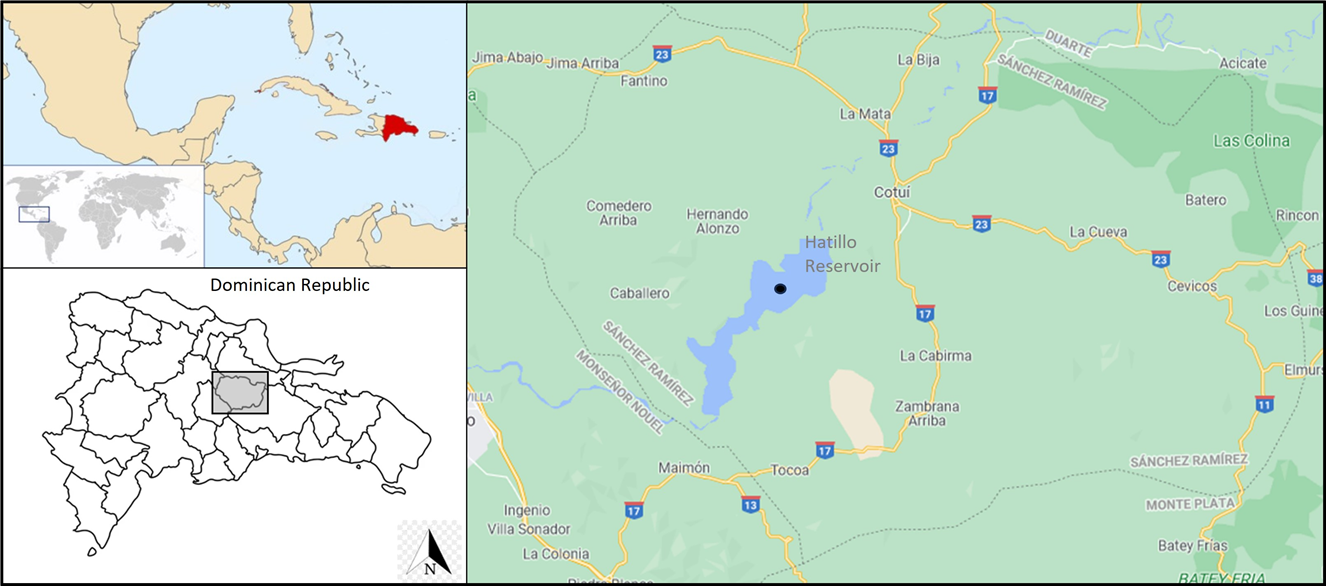
Figure 1 Geographical location of the Hatillo reservoir. The approximate location of the sampling point is marked in black.
The Yuna River basin, considered the most abundant river in the Dominican Republic, covers an area of 2905.49 km² (Ministerio de Economía, Planificación y Desarrollo [MEPYD], 2018). The highest inflows of the Yuna River to the Hatillo reservoir occur in the months of May, June, November and December (Figure 2; Bautista de los Santos, 2014).
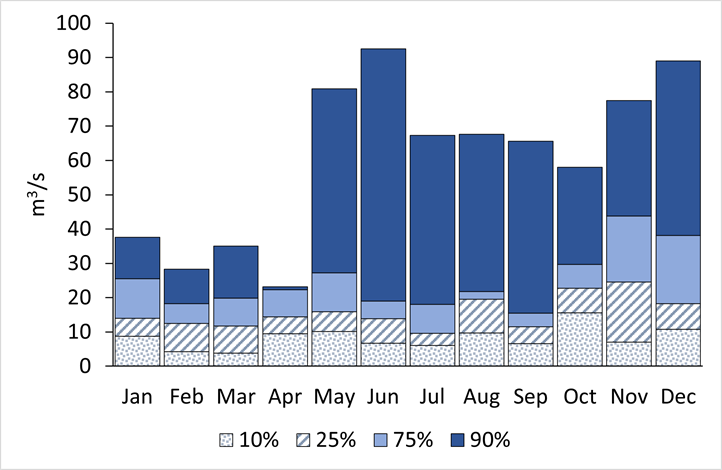
Figure 2 Multi-year average percentages of recurrence (1950-1999) of Yuna River flows at the entrance of the Hatillo reservoir.
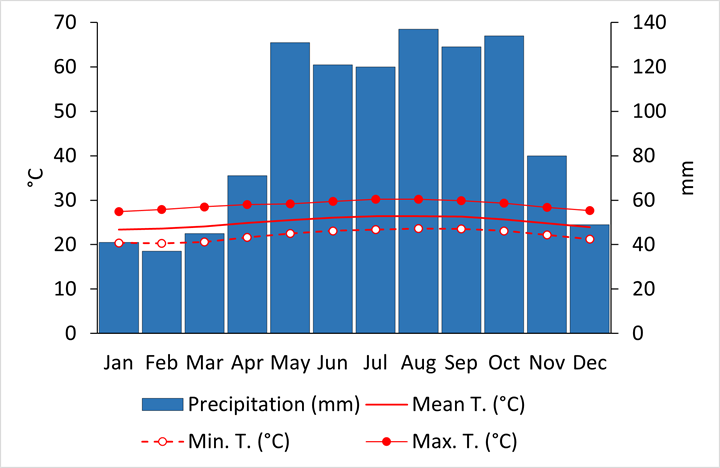
There is a dry period from December to March with average monthly precipitation between 37 and 49 mm, average temperature of 23.9-24.1 °C, minimum of 20.3-21.2 °C and maximum of 27.7-28.5 °C. The rainy period is from May to October with mean monthly precipitation of 120 to 137 mm, mean temperature 25.5-26.4 °C, minimum 22.5-23.6 °C and maximum 29.2-30.2 °C (Figure 3). The months of November and March would be transitional between the two climatic periods (Climate-Data, 2023).
Data collection and analysis
For the definition of the thermal behavior of the Hatillo reservoir, 52 diurnal temperature records taken in the limnetic zone of the reservoir (19°0'12''N and 70°12'44''W; Figure 1) were collected from February 2011 to July 2021 as part of the environmental monitoring program of the Pueblo Viejo mine (RESCAN, 2004; 2005; 2008). Measurements were made between 6:00 am and 7:00 am using YSI-556 and YSI-EXO 2016 multiparameter probes with properly calibrated temperature, electrical conductivity, dissolved oxygen and pH sensors.
To evaluate the presence and intensity of thermal stratification in the reservoir, the Relative Thermal Resistance (RTR) to mixing was used, which is based on the density differences generated by the thermal gradients between adjacent water masses, being able to identify the location and intensity of the thermocline according to the RTR peak (Cole, 1988; Kortmann, 2003; Wetzel, 1981).
As criteria for defining reservoir mixing conditions, it was considered that the difference between surface and bottom temperatures should not exceed 1 °C, taking into account Basak and Sarkar (2006), as well as obtaining RTR values of less than 20 between adjacent layers of 1 m depth, which, as stated by Kortmann (2003), higher values already generate resistance to mixing of the adjacent water masses.
RESULTS
Temporal dynamics
During the ten years of monitoring in the Hatillo reservoir, higher temperatures have been recorded in the surface waters, with values between 25.08 °C and 30.88 °C, while at the bottom they have been between 23.26 °C and 28.51 °C. December and January are the months with the lowest surface temperatures and the lowest thermal differences between the surface and the bottom, so that these are the periods in which mixing of the reservoir water masses is possible, while the rest of the time the differences in density generated by the thermal differences favor the presence of thermal stratification (Table 2).
Table 2 Water temperature, thermal gradients and Relative Thermal Resistance (RTR) values in the Hatillo Reservoir from February 2011 to July 2021
| Sampling | Depth (m) | Temperature (°C) | °C/m | Relative Thermal Resistance (RTR) | |||
|---|---|---|---|---|---|---|---|
| Surface (Ts) | Background (Tf) | Ts-Tf | Total | Per meter | |||
| Feb 11 | 17 | 26.11 | 24.74 | 1.37 | 0.081 | 44 | 2.6 |
| Apr 11 | 17 | 28.09 | 26.00 | 2.09 | 0.123 | 70 | 4.1 |
| Jun 11 | 21.42 | 30.10 | 25.21 | 4.89 | 0.228 | 168 | 7.8 |
| Aug 11 | 20 | 28.77 | 26.01 | 2.76 | 0.138 | 94 | 4.7 |
| Dec 11 | 16 | 27.07 | 26.48 | 0.59 | 0.037 | 20 | 1.2 |
| May 12 | 20.8 | 29.82 | 24.50 | 5.32 | 0.256 | 179 | 8.6 |
| Jun 12 | 21.2 | 30.03 | 24.78 | 5.25 | 0.248 | 178 | 8.4 |
| Jan 13 | 20.3 | 25.86 | 24.80 | 1.06 | 0.052 | 34 | 1.7 |
| Mar 13 | 19.4 | 27.96 | 26.12 | 1.84 | 0.095 | 62 | 3.2 |
| May 13 | 19.1 | 29.57 | 27.05 | 2.52 | 0.132 | 88 | 4.6 |
| Jul-13 | 20.9 | 28.68 | 25.66 | 3.02 | 0.144 | 102 | 4.9 |
| Oct 13 | 21.9 | 29.57 | 28.21 | 1.36 | 0.062 | 48 | 2.2 |
| Jan 14 | 21.7 | 26.07 | 25.90 | 0.17 | 0.008 | 6 | 0.3 |
| Apr 14 | 20 | 28.90 | 25.86 | 3.04 | 0.152 | 103 | 5.2 |
| Jul 14 | 19.4 | 30.19 | 28.50 | 1.69 | 0.087 | 61 | 3.1 |
| Nov 14 | 18.2 | 29.55 | 28.51 | 1.04 | 0.057 | 37 | 2.0 |
| Jan 15 | 14.9 | 26.04 | 25.85 | 0.19 | 0.013 | 6 | 0.4 |
| Apr 15 | 17.1 | 27.21 | 26.18 | 1.03 | 0.060 | 34 | 2.0 |
| Jan 16 | 17.4 | 26.66 | 26.48 | 0.18 | 0.010 | 7 | 0.4 |
| Jul 16 | 19 | 30.05 | 27.05 | 3.00 | 0.158 | 110 | 5.8 |
| Oct 16 | 20.2 | 29.00 | 27.62 | 1.38 | 0.068 | 50 | 2.5 |
| Dec 16 | 21 | 27.40 | 25.8 | 1.6 | 0.076 | 53 | 2.5 |
| Jan 17 | 21.2 | 25.52 | 24.11 | 1.41 | 0.067 | 44 | 2.1 |
| Apr 17 | 21.7 | 27.81 | 23.69 | 4.12 | 0.190 | 132 | 6.1 |
| Jul 17 | 21.7 | 29.36 | 25.13 | 4.23 | 0.195 | 155 | 7.1 |
| Aug 17 | 21.8 | 30.77 | 25.66 | 5.13 | 0.235 | 179 | 8.2 |
| Oct 17 | 22 | 29.67 | 26.62 | 3.05 | 0.139 | 106 | 4.8 |
| Jan 18 | 21.9 | 26.91 | 26.40 | 0.51 | 0.023 | 19 | 0.9 |
| Feb 18 | 23.001 | 25.08 | 23.26 | 1.82 | 0.079 | 67 | 2.9 |
| Apr 18 | 21.1 | 27.04 | 23.36 | 3.68 | 0.174 | 135 | 6.4 |
| Jul 18 | 21.1 | 30.34 | 26.11 | 4.23 | 0.200 | 155 | 7.3 |
| Oct 18 | 18.6 | 29.77 | 28.00 | 1.77 | 0.095 | 65 | 3.5 |
| Jan 19 | 20.6 | 26.3 | 25.81 | 0.49 | 0.024 | 18 | 0.9 |
| Apr 19 | 17.5 | 27.63 | 26.43 | 1.2 | 0.069 | 44 | 2.5 |
| Jun 19 | 18.1 | 28.00 | 26.58 | 1.43 | 0.079 | 52 | 2.9 |
| Jul 19 | 16 | 30.88 | 27.23 | 3.65 | 0.228 | 134 | 8.3 |
| Oct 19 | 14.1 | 29.57 | 26.82 | 2.75 | 0.195 | 101 | 7.1 |
| Dec 19 | 15.2 | 27.97 | 27.63 | 0.34 | 0.023 | 13 | 0.8 |
| Feb 20 | 17.8 | 26.72 | 25.31 | 1.41 | 0.079 | 52 | 2.9 |
| Apr 20 | 22.8 | 27.91 | 23.59 | 4.32 | 0.189 | 158 | 6.9 |
| Jul 20 | 18 | 30.4 | 28.17 | 2.23 | 0.124 | 82 | 4.5 |
| Aug 20 | 19 | 29.63 | 27.27 | 2.36 | 0.124 | 86 | 4.5 |
| Sep 20 | 20 | 29.71 | 27.10 | 2.61 | 0.131 | 95 | 4.8 |
| Oct 20 | 17 | 29.21 | 27.52 | 1.69 | 0.099 | 62 | 3.6 |
| Nov 20 | 22 | 27.92 | 26.84 | 1.073 | 0.049 | 39 | 1.8 |
| Dec 20 | 18 | 26.96 | 26.75 | 0.21 | 0.012 | 8 | 0.4 |
| Jan 21 | 19 | 26.20 | 25.94 | 0.26 | 0.014 | 10 | 0.5 |
| Feb 21 | 19 | 26.36 | 25.82 | 0.54 | 0.028 | 20 | 1.0 |
| Apr 21 | 19 | 26.67 | 26.02 | 0.65 | 0.034 | 24 | 1.3 |
| May 21 | 19 | 28.86 | 25.20 | 3.66 | 0.193 | 134 | 7.0 |
| Jun 21 | 19 | 28.74 | 25.62 | 3.12 | 0.164 | 114 | 6.0 |
| Jul 21 | 22 | 29.36 | 25.82 | 3.54 | 0.161 | 144 | 6.6 |
Mixing months are highlighted
During the months when mixing of the water masses occurred, the thermal gradients between the surface and the bottom were between 0.17 °C and 1.07 °C (i.e., less than 0.06 °C/m). These thermal differences yielded total RTR values from 6 to 39 units (i.e., from 0.3 to 2.0 units per meter) whereas, in the rest of the year, under thermal stratification conditions, their gradient from the surface to the bottom was between 1.2 °C and 5.32 °C (i.e., from 0.06 °C/m to 0.26 °C/m), yielding total RTR values between 44 and 179 units, which corresponds to a range between 2.1 and 8.6 units per meter (Figure 4).
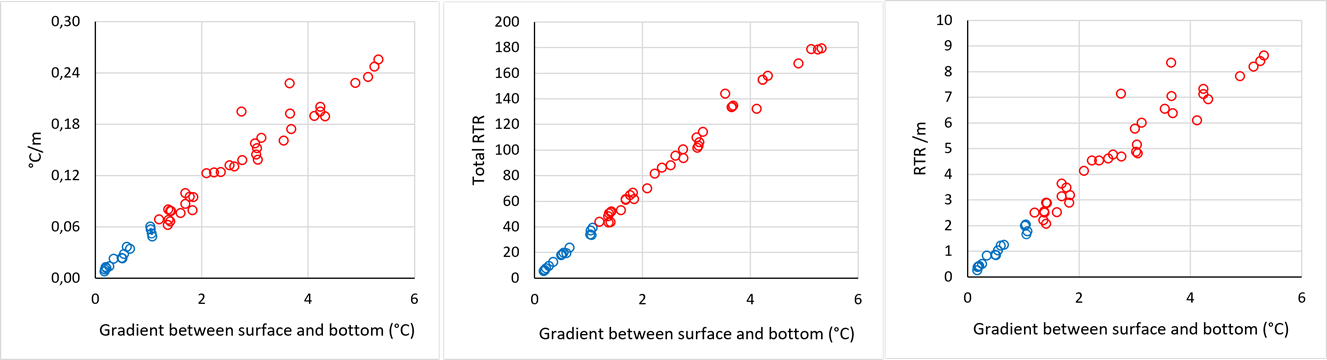
Figure 4 Variation of temperature per meter and Relative Thermal per meter and Relative Thermal Resistance in relation to the thermal gradient between the surface and the bottom of the Hatillo Reservoir from February 2011 to July 2021. Mixing is shown in blue and stratification in red.
The highest oxygen concentrations also occurred at the surface of the water column, with an average of 7.3 mg/L, while the average at the bottom was 2.9 mg/L. The highest oxygen concentrations at the bottom and the lowest differences with the surface records also occurred in the months when the water masses were mixed. Surface water also had a higher pH, with values between 6.7 and 9.5 units, while the bottom of the reservoir had a minimum value of 6.1 and a maximum of 9.0 units. Similar to what was observed with temperature and dissolved oxygen, the lowest pH differences between the surface and the bottom of the water column were obtained in December and January (Figure 5).
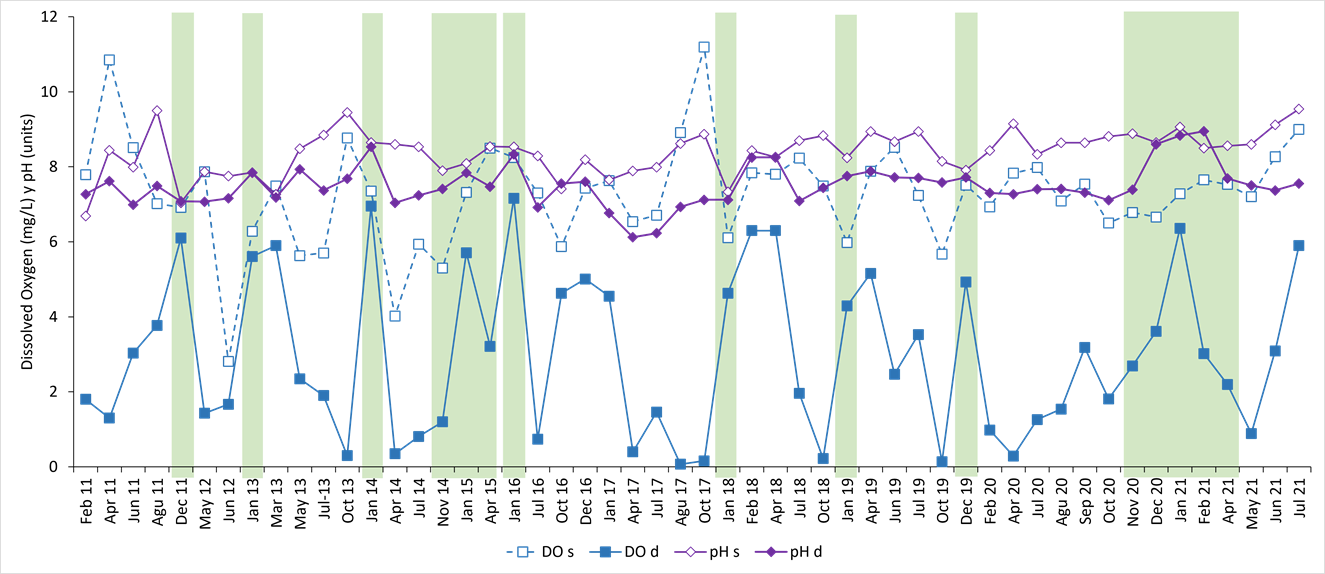
Figure 5 Dissolved oxygen concentration (DO mg/L) and pH (units) of water at the surface (s) and bottom (f) of the Hatillo Reservoir from February 2011 to July 2021. Mixing months are highlighted.
The electrical conductivity in the reservoir showed values between 193 µS/cm and 481 µS/cm, with very little difference between the surface and the bottom, with respective average values of 339 µS/cm and 332 µS/cm. Unlike what was observed with the variables mentioned above, the variations between the surface and deep waters were not related to the mixing processes of the water masses in the reservoir.
Vertical profiles
As shown in Figure 6, throughout the ten years of study, the reservoir water masses remained thermally stratified for most of the year, with mixing events occurring between December and March of each year. The vertical profiles of three notable moments for each of the mixing conditions (January 2013, November 2020, April 2021) and reservoir thermal stratification (June 2012, January 2017, May 2021) are described below.
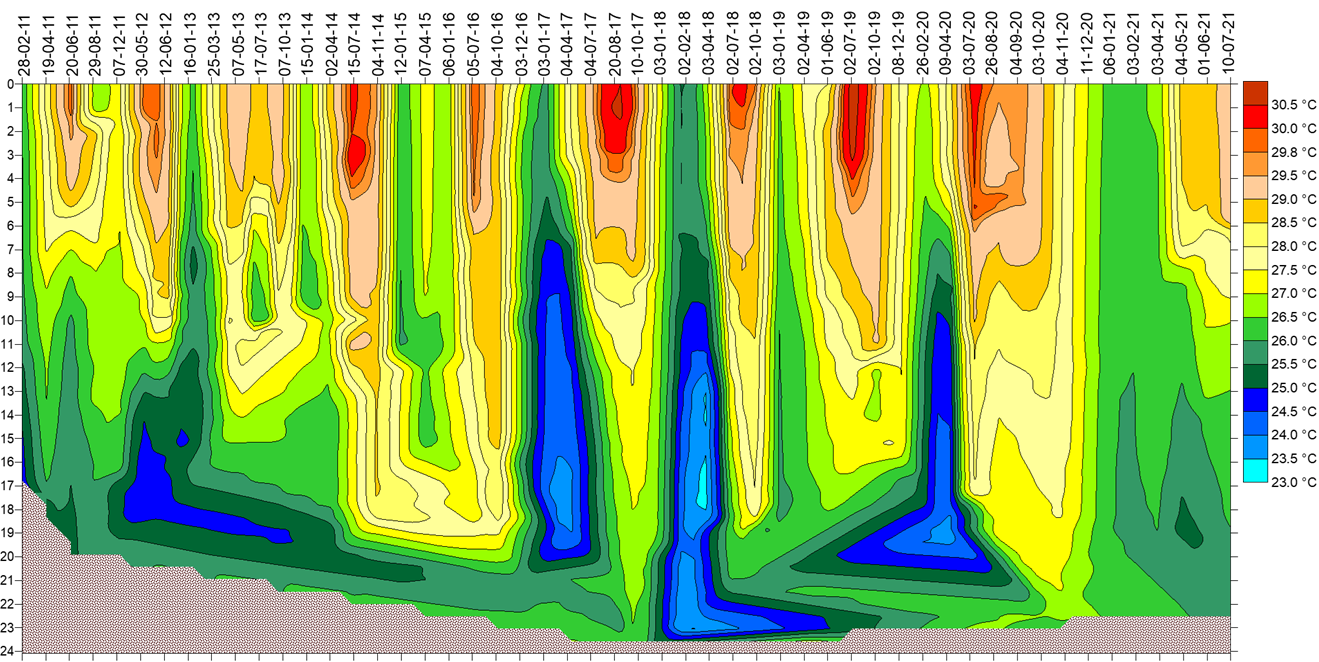
Figure 6 Temperature isolines (°C) obtained at the center of the Hatillo Reservoir between February 2011 and December 2021.
Of all the mixing periods, January 2013 displayed the greatest difference between the surface and the bottom, when 25.86 °C was recorded in the surface waters and 24.8 °C at the bottom, with a gradient of 0.05 °C/m, whose density variations between adjacent layers yielded RTR values of less than 16 to 17, corresponding to 1.7 units per meter. For the year 2020, the mixing of the water masses was evident from November, with a thermal gradient of 0.049 °C/m, whose profile was between 27.92 °C and 26.84 °C, with a maximum RTR of 12 between 18 and 19 m depth (i.e., 1.8 per meter). This mixing period lasted until April 2021, when the temperature was 26.67 °C at the surface with a slight reduction with increasing depth, reaching a minimum of 26.02 °C at the bottom, with the highest RTR value of five at 4-5 m depth (Figure 7).
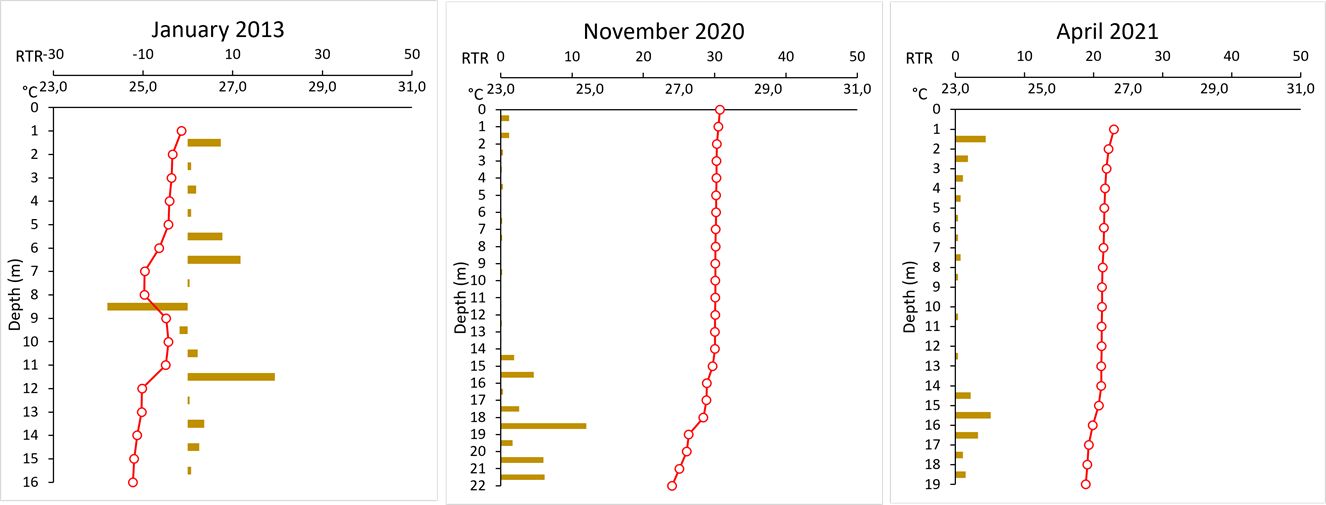
Figure 7 Thermal profiles and Relative Thermal Resistance (RTR) in the Hatillo Reservoir at three moments of mixing conditions between February 2011 and July 2021.
In January 2013 dissolved oxygen decreased from 6.28 mg/L at the surface to 5.61 mg/L at the bottom, similar to the electrical conductivity profile with values between 264 µS/cm at the surface and 262 µS/cm at the bottom of the water column. The pH also showed very little variation along the profile with values between 7.76 and 7.85 units. In November 2020 dissolved oxygen showed a continuous decrease in concentration from 6.78 mg/L at the surface to 3.18 mg/L at 18 m and then increasing to 4.67 mg/L at the bottom. The electrical conductivity profile was similar, with 458 µS/cm at the surface, a minimum of 396 µS/cm at 21 m and a slight increase to 410 µS/cm at the bottom. The pH showed little variation in the profile with 8.86 units at the surface and 8.63 units at the bottom of the water column. In April 2021 dissolved oxygen was between 7.53 mg/L and 8.34 mg/L up to 15 m depth, then a sharp reduction to concentrations between 2.57 mg/L and 2.2 mg/L in the 4 m band at the bottom of the water column. The pH with very little variation in the profile was between 8.88 units at the surface and 8.56 at the bottom and the electrical conductivity was between 424 µS/cm at the surface and 432 µS/cm at the bottom (Figure 8).
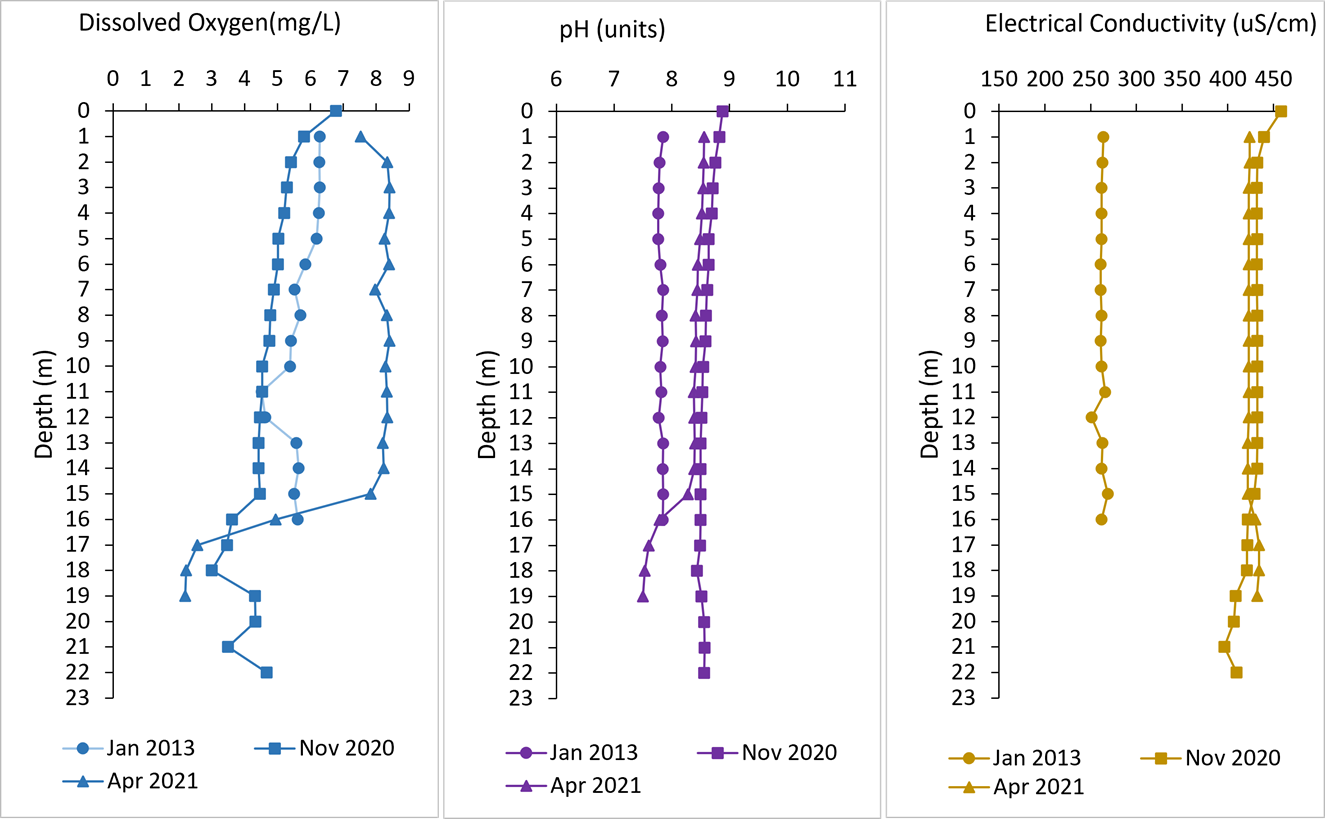
Figure 8 Dissolved oxygen, pH and electrical conductivity profiles in the Hatillo Reservoir at three moments of mixing conditions between February 2011 and July 2021.
Under reservoir thermal stratification conditions, the June 2012 record was the most intense thermal stratification. The surface nine meters of the water column was between 30.2 °C and 29.34 °C, then the temperature decreased to 25.65°C at 13 m whose RTR values were between 23 and 44, locating the thermocline there. Below this layer, at 18 m, the temperature decreased to 24.78 °C, with RTR values less than 10. For this month the thermal gradient was 0.25 °C/m and the total RTR was 184 (i.e., 8.4 per meter). The January 2017 record differed from the other January records by presenting thermal stratification, in that the surface temperature was 25.52 °C and 24.11 (0.07 °C/m) at the bottom of the water column, whose thermal gradient yielded a total RTR of 44 (2.1/m), locating the thermocline between 4 and 7 m depth, a range in which an RTR of 36 was reached. In May 2021 the thermocline was clearly identifiable, as in the shallow seven meters the temperature decreased from 28.86 °C to 28.07 °C. The thermocline, with a thermal gradient of 1.44 °C and RTR of 53, was located between 7 and 8 m depth of the water column. From 8 m to the bottom, the temperature gradually decreased from 26.63 °C to 25.2 °C with RTR values less than 11.3. For this month, a thermal gradient of 0.19 °C/m was obtained with total RTR of 134 (i.e., 7 units per meter) (Figure 9).
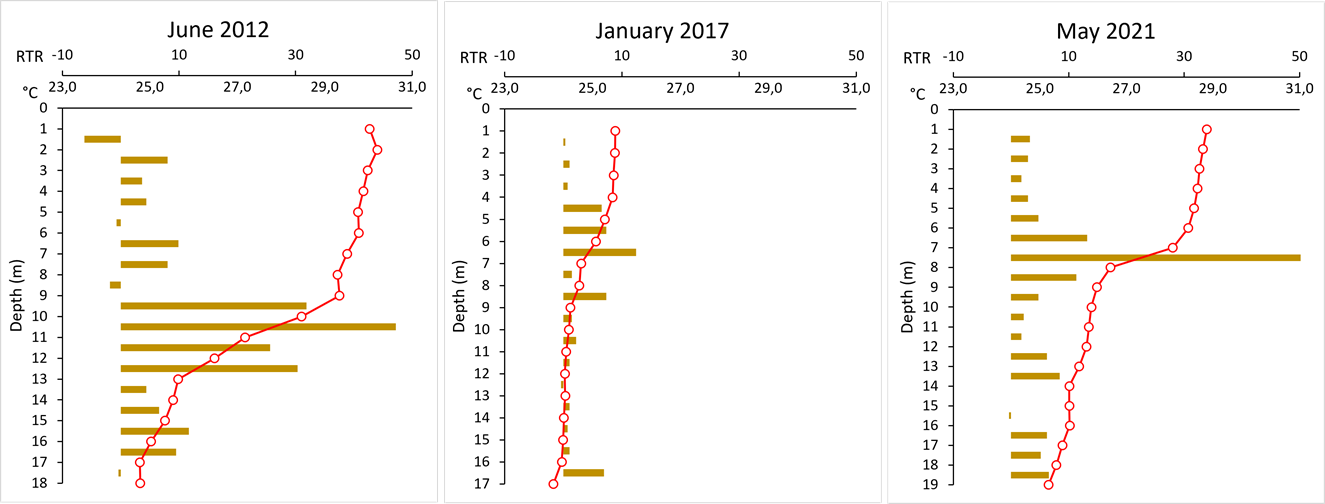
Figure 9 Thermal profiles and Relative Thermal Resistance (RTR) in the Hatillo Reservoir at three moments of thermal stratification between February 2011 and July 2021.
In June 2012, the dissolved oxygen profile showed a slight decrease from 2.81 mg/L at the surface to 1.67 mg/L at the bottom. The pH was between 7.75 units at the surface and 7.26 units at the bottom, with a slight increase at 3 m depth, while the vertical electrical conductivity profile was between 208 µS/cm and 107 µS/cm, with a slight increase to 260 µS/cm at 13 m depth (Figure 10).
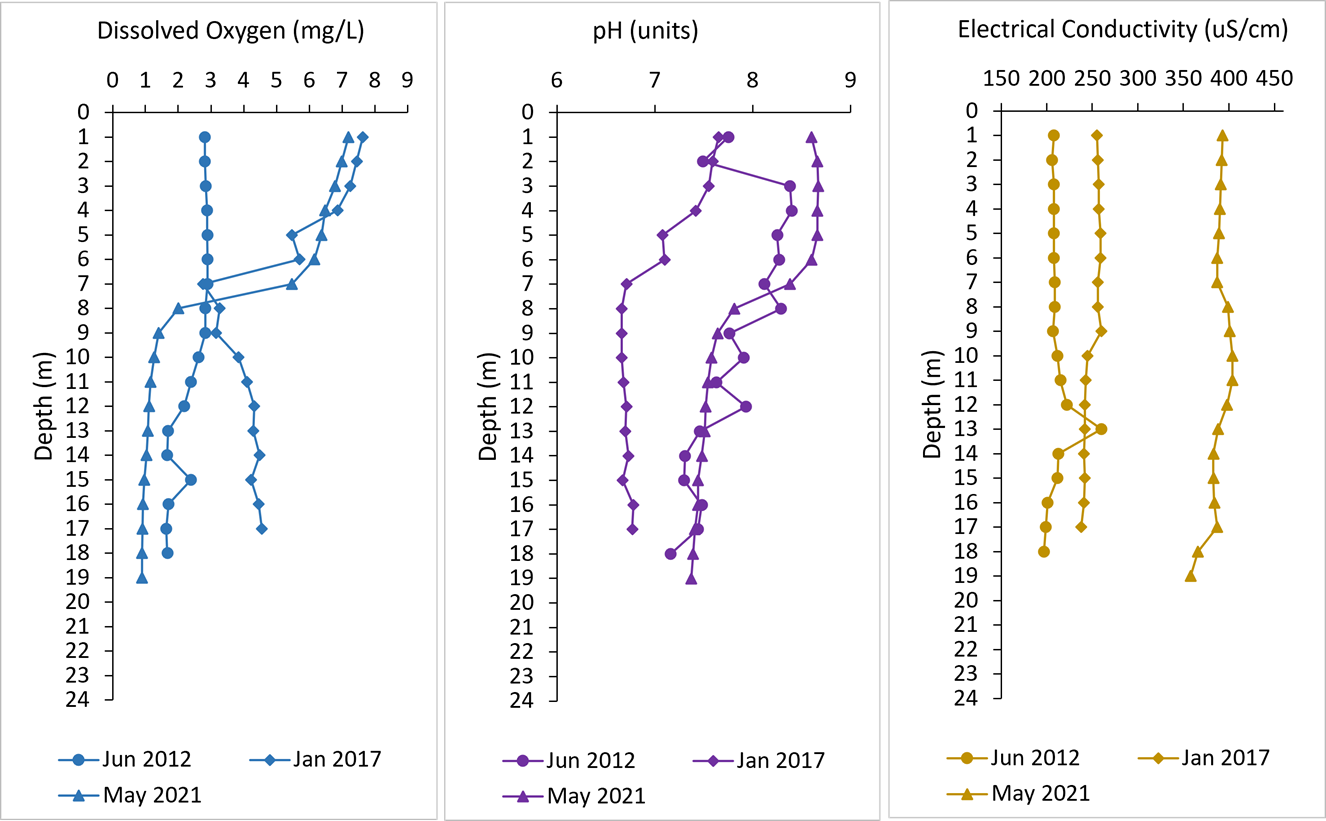
Figure 10 Dissolved oxygen, pH and electrical conductivity profiles in the center of the Hatillo Reservoir at three times of thermal stratification between February 2011 and July 2021.
In January 2017 dissolved oxygen presented decrease from 7.63 mg/L at the surface to 2.76 mg/L at 7 m and subsequent increase to 4.55 mg/L at the bottom of the water column. The pH also presented a gradient related to depth, with 7.65 units at the surface and 6.77 units at the bottom of the water column. Electrical conductivity showed a slightly decreasing profile from 255 µS/cm at the surface to 238 µS/cm at the bottom. Dissolved oxygen in May 2021 was between 7.2 mg/L and 5.47 mg/L in the surface seven meters, decreased to 2.01 mg/L at 8 m and then reached near anoxia at the bottom of the water column. The pH profile showed the same clinograde pattern as the oxygen, remaining at 8.6 units up to 6 m, then decreasing to 7.81 units at 8 m and continuing to decrease to a minimum of 7.37 units at the bottom. The electrical conductivity decreased from 393 µS/cm at the surface to 358 µS/cm at the bottom of the water column (Figure 10).
DISCUSSION
Considering that the minimum surface temperature recorded in the Hatillo Reservoir between the years 2011 and 2021 was 25.08 °C and the minimum annual average was 26.63 °C, this reservoir can be defined as a warm tropical lake according to the criteria indicated by Salas and Martino (2001). Although the Hatillo Reservoir meets most of the generalizations described for tropical lakes at sea level, it differs in some of them, such as the minimum temperature of the bottom of the reservoir water column (23.3 °C), which was slightly lower than the minimum of 24 °C defined by Lewis Jr. (1996). Likewise, the difference between the surface and the bottom during mixing periods between 0.17 °C and 1.07 °C in the Hatillo Reservoir (Table 2) is well below the 1.5 °C gradient indicated by the aforementioned author. These differences may result from the fact that these studies did not include insular lentic ecosystems, so that with the information from the Hatillo Reservoir it is possible to modify the limits of these ranges defined by Lewis Jr. (1996).
In more than 70% of the 52 samples taken over the ten years of study in the Hatillo reservoir, the water masses of the reservoir have remained thermally stratified, whose thermal gradients in stratification time from 1.2 °C to 5.32 °C (Table 2), are greater than the 1 to 4 °C difference that Alcocer et al. (2000) indicate was sufficient to establish a functional thermocline in Lake Alchichica in Mexico, because as indicated by Lewis Jr. (1996, 2000) and Branco et al. (2009) relatively low differences of 2 °C between the surface and the bottom at these elevated temperatures in tropical lakes can generate enough density difference to sustain seasonal stratification.
Towards the end or beginning of each year and for a period of less than three months, there were mixing conditions in the Hatillo Reservoir, whose temperature differences between the surface and the bottom were close to or less than 1 °C, so that the thermal gradients were less than 0.06 °C per meter, resulting in a total RTR of less than 40, which means a maximum of 2.0 units per meter (Figure 4).
Considering the altitude and geographic location of the Hatillo reservoir, it would be expected that this reservoir would be oligomictic, as proposed by Hutchinson and Löffler (1956) (i.e., with permanent stratification and only eventual mixing processes that may occur more frequently than annually). However, under the revision of the classification made by Lewis Jr. (1983a) this category disappeared.
Talling (1969), Richerson (1991), Lewis Jr. (1996; 2000) and Branco et al. (2009) indicate that tropical lakes with moderate to great depth, as would be the case of the Hatillo Reservoir, are predominantly warm monomictic, showing great regularity in the seasonal mix, which typically coincides with the winter of the corresponding hemisphere, as has been observed in Venezuela in Lake Valencia (Lewis Jr., 1984), in Ecuador in Lake São Paulo (Gunkel & Casallas, 2000), in Brazil in the Tucurí (Tundisi et al., 1993), Lajes (Branco et al., 2009) and Barra Bonita (Tundisi et al., 2010), in Mexico in Lake Zirahuén (Tavera & Martínez-Almeida, 2005), Picachos Dam (Beltrán-Álvarez et al., 2012) and Lake Alchichica (Salas de León et al., 2015) as well as in Australia in Tingalpa Reservoir (Wang et al., 2019).
The thermal stratification of the Hatillo Reservoir during most of the year occurs due to heat energy inputs as a result of the intensity of solar radiation and low evaporation, so that most of this energy is stored in the surface layers. Since this heat storage is faster than its mixing at depth by atmospheric events such as wind or precipitation, an epilimnetic layer of lower density and higher temperature is formed (Richerson, 1991). During the night, in the absence of solar radiation, this heat energy gained during the day by the surface water masses is expected to be transferred to the atmosphere, which in the case of polymictic lakes may be sufficient to allow mixing of the water column (Lewis Jr., 1983a; 1996; 2000; Richerson, 1991). In the case of the Hatillo Reservoir, this cooling of the surface water masses is not sufficient to increase their density and favor mixing, so that even in the early morning hours the thermal gradients are maintained and intensify throughout the day.
The stratification conditions are ratified by the oxygen clinograde profiles, which, by keeping the bottom water layers isolated from the surface water layers for sufficient time, both during the day and at night, cause dissolved oxygen to be consumed below the photic zone boundary, where breathing conditions are present, while at the surface, due to phytoplankton production and atmospheric reaeration, conditions close to saturation are maintained (Beltrán-Álvarez et al., 2012; Lewis Jr., 2000). Despite maintaining thermal stratification conditions most of the year, dissolved oxygen is not fully depleted in the hypolimnion, possibly as a result of the oxygen load contributed by the Yuna River, which could be entering the deep water masses of the reservoir due to its lower temperature than the surface waters (Margalef, 1983; Richerson, 1991; Roldán & Ramírez, 2008; Tundisi et al., 1993), as has been observed in the Picachos dam in Mexico (Beltrán-Alvaréz et al., (2012), in the Jurimirim and Chavantes Reservoirs in Brazil (Gomes-Nogueira & Pomari, 2018), in the La Fe Reservoir in Colombia (Gómez-Giraldo et al., 2013) or in the Tingalpa Reservoir in Australia (Wang et al., 2019). However, this aspect could be evaluated in the Hatillo Reservoir when simultaneous environmental information from the reservoir and the Yuna River is available.
Although throughout the year the water masses of the reservoir remain at basic or near neutral pH, the reductive conditions in the deep layers where the processes of respiration and decomposition of organic matter predominate make them more acidic than the oxygenated surface layers (Elci, 2008; Lewis Jr., 2000; dos Anjos Neves et al., 2016), finding for this variable profiles similar to those of oxygen most of the year under thermal stratification conditions.
Considering that the Hatillo Reservoir is located on an island in the tropical belt, defined between 20° north latitude and 20° south latitude by Roldán and Ramírez (2008) it is expected then that in this insular condition its thermal behavior is defined by the large mass of water surrounding the island, so that the thermal stability of the Antillean Sea would favor the thermal stability of the water masses of the Hatillo Reservoir throughout the year (Chowdhury et al., 2014).
The mixing of the water masses in the Hatillo Reservoir towards January and February is mainly associated with several climatic elements, which allow the dissipation of the heat energy of the water stored in the preceding stratification period, given that from November to January is when the least amount of sunshine hours per day are recorded with averages of 7.5 to 7.9 hours while from March to October they are between 8.2 and 9.0 hours per day (Climate-Data, 2023), which implies less solar radiation, as well as lower atmospheric temperatures (Figure 3). These lower atmospheric temperatures at this time of the year are due to the advance of the cold air masses that descend from the northern hemisphere during the winter season that begins in December (Lewis Jr., 2000), whose reduction in atmospheric temperature allows for the cooling of the surface water masses in the reservoir, causing an increase in their density and therefore their sinking to a depth with similar temperature and density.
This sinking, in turn, implies the displacement or upward movement of the lower water layers, as well as the transfer of heat from the warm water masses to the colder ones, whose density changes allow greater vertical movements of the water masses, a phenomenon described in physics as advection or advective movements, which could finally result in the total mixing of the water masses (Imboden & Wüest, 1995).
With the increase in the density of the surface water masses, due to their loss of temperature, the sinking of these surface water layers rich in dissolved oxygen begins, which is gradually transferred to the deeper water layers as the recirculation of the water masses is generated, finding during these periods of mixing the smallest differences in the concentration of dissolved oxygen between the surface and the bottom. Likewise, mixing is confirmed by the smallest differences in pH values throughout the water column.
Although there is no information on the inflows of the Yuna River to the reservoir simultaneously with the vertical records of the monitoring program, between January and April is when the lowest flows of the Yuna River occur (Bautista de los Santos, 2014), as well as the lowest rainfall (Climate-Data, 2023), so it is presumed that the Yuna River plume or local atmospheric events would have little influence on the thermal structure of the reservoir in this mixing season. However this is an aspect that could be evaluated when the corresponding information is available.
It is necessary to consider the exceptional situation of January 2017, a period in which the temperature difference between the surface and the bottom was 1.4 °C, with a total RTR of 44 (i.e., 2.1 per meter). For this month when mixing conditions were expected, the presence of the thermocline was identified between 4 and 9 m depth with respective temperatures of 25.46 °C and 24.5 °C. As indicated by Lewis Jr. (1996), large density differences at high temperatures generate high stability, so that, with thermal differences as low as 2 5°C, an RTR of 37 was reached between these depths.
For this period, since December 2016, there was an intense drought in the Dominican Republic that added to unusually high ambient temperatures in January 2017, whose average maximum and minimum temperature at the Cibao Airport, was 28.4 °C and 19.2 °C, while the range of the average maximum temperature from January 2010 to 2021 was 28 °C to 28,2 °C and the minimum from 18.9 °C to 19 °C (World Meteorological Organization [WMO], 2022), events attributed to that year's El Niño phenomenon (National Oceanic and Atmospheric Administration [NOOA], 2021), so that the regular reduction in ambient temperature that allows the annual mixing processes in the reservoir did not occur.
The opposite situation was observed in the period between November 2020 and April 2021, when the mixed condition was maintained for at least four consecutive months. In November 2020, intense cyclonic activity was experienced in the Atlantic Ocean, with the formation of several tropical storms and hurricanes that affected the Dominican Republic, causing heavy rains in January and February 2021 as well as unusually low temperatures, reaching below 0 ºC in some parts of the country (NOOA, 2021).
The stratified condition of the Hatillo Reservoir observed in January 2017 is considered an atypical condition with only one occurrence during the ten years of records, since during the other nine years of records in this period of the year there has been mixing in the entire water column. In this sense, the Hatillo Reservoir is a stratified body of water that presents a single period of mixing at the end or beginning of each year, so it is defined as a warm monomictic lake according to the revision made by Lewis Jr. (1983a) to the Hutchinson and Löffler (1956) classification, whose mixing periods are defined by surface-bottom temperature differences of less than 1 °C, thermal gradients of less than 0.06 °C per meter, RTR values between adjacent one-meter layers of less than 20, and total RTR of less than 40 (i.e., less than 1.8 units per meter).
The condition of the Hatillo Reservoir as a warm monomictic lake corresponds to the distribution of the eight types of lakes according to their mixing pattern, considering the relationship between latitude and mean depth made by Lewis Jr. (1983a), as well as the relationship between latitude and relative depth and the relationship between area and mean depth (Lewis Jr., 2000).

