




 English (pdf)
 Article in xml format
 Article references

 Automatic translation
 Send this article by e-mail
 Cited by SciELO
 Cited by Google
 Similars in
SciELO
 Similars in Google

 Permalink


Introduction
According to the UN Sustainable Development Goals (Manu et al, 2023; Katila et al, 2019), water availability and quality are major indicators of living standards. Metal/ metalloid concentrations and their species are pollutants in water resources. Metalloids are a class of metals and semimetals known to exist in the earth's crust; they have specific gravities over 5 g/cm3 or at least five times that of water (DuffUs, 2002) and comprise elements with an atomic number over 20 according to a recent definition (Ali & Khan, 2018; Ali et al., 2019).
Metal and metalloid pollution have a deleterious effect on the ecosystem due to its toxicity, non-biodegradability, and persistent nature, accumulating quickly in the soil, water, and sediment (Bhairo et al., 2023; Heidari et al., 2019; Kumar et al., 2019).
Some of these metalloids, described as non-essential metals, render no benefits to living systems, and many of them are toxic even at low concentrations (Idowu, 2022). Non-essential metalloids include lead (Pb), cadmium (Cd), mercury (Hg), arsenic (As), tin (Sn), aluminum (Al), silver (Ag), gold (Au), antimony (Sb), bismuth (Bi), palladium (Pd), platinum (Pt), vanadium (V), strontium (Sr), tellurium (Te), titanium (Ti), uranium (U), and chromium (Cr) (Tchounwou et al., 2012).
The concerns and studies on metalloids hinge on the fact that they can get into the food chain via bioaccumulation in plants and animal species and contaminate potable water sources. Water resource pollution is common, especially in developing countries where many rural communities depend on unprotected and vulnerable surface and ground water sources for drinking and other domestic purposes.
According to Rajmohan & Elango (2005), tracing metals or metalloids in groundwater is important for public health, plant growth, and academic research to understand the mobility of metals in aqueous environments. In this sense, Rehman et al. (2023), Shahid et al. (2023), Zhu et al. (2023), and Feng et al. (2022) have concluded that AS poses a serious concern to human health in drinking water, as it is a pervasive pollutant in groundwater, affecting more than 100 million people in 50 countries (Soldatova et al., 2022).
Arsenic occurs in inorganic and organic forms in natural geochemical environments (Hassan, 2008) and is one of the potentially toxic elements in the natural environment (Chandrasekar et al., 2020). This potentially toxic mobile metal exists naturally in its elemental state or as a compound within the earth's crust. It occurs in the form of arsenic-bearing minerals such as sulfides, oxides, arsenates, arsenites, etc., in sedimentary, metamorphic, and igneous rocks. Like most potentially toxic metals in the environment, arsenic occurrence and mobilization have been attributed to a combination of natural and anthropogenic reactions (Khan & Rai, 2022; Soldatova et al., 2022; Keskin & Özler, 2020; Shankar et al., 2014; Smedley & Kinniburgh, 2013; Smedley & Kinniburgh, 2002).
García et al. (2007) have reported that As concentration in groundwater is controlled by lithology, but the spatial and temporal variation in concentrations is controlled by pH changes, climatic factors, and human perturbations. Li et al. (2021) suggest that arsenic is released into groundwater due to hydrochemical and geological processes. Arsenic anthropogenic mobilization is exacerbated by mining, fossil-fuel combustion, and the use of synthetic arsenical compounds (pesticides, herbicides, crop desiccants, and arsenic-based additives in livestock feed) (Smedley & Kinniburgh, 2013).
Some of the highest aqueous arsenic concentrations are found in groundwater due to the high solid-to-solution ratios in aquifers, which threaten health (Smedley & Kinniburgh, 2013; Stollenwerk, 2003). Groundwater within aquifers is vulnerable to water-rock interactions, leading to arsenic release. Aquifers have physical and chemical conditions more favorable for arsenic mobilization and transport than surface waters (Smedley & Kinniburgh, 2013). However, As high concentrations in groundwater are rare, as background concentrations are usually less than 10 ng L-1, which is the maximum acceptable level (WHO, 2011).
Arsenic contamination of water sources poses a serious risk to human health. Excessive and prolonged exposure to inorganic As in drinking water causes arsenicosis, a deteriorating and disabling disease characterized by skin lesions and pigmentation and patches on hand palms and feet soles (Li et al., 2021; Shankar et al., 2014; Stollenwerk, 2003).
Metals in soils and groundwater are present in varied chemical forms known as species. Metalloid species play a role in determining groundwater health effects rather than the total concentration levels (Zhang et al., 2017). The distribution of these chemical species in different forms is known as speciation, and it determines metals transport, retention, and bioavailability and their impact (Lofts & Tipping, 1999). Many computer-based mathematical models have been developed to simulate speciation and predict metal behavior, which is usually easy for metallic components and oxyanions (Lofts & Tipping, 1999). However, natural systems have chemical complexation and heterogeneity that play a crucial role in determining speciation.
The interest in ascertaining arsenic species in groundwaters in the study area is hinged on the fact that its toxic effects are solely connected to its chemical forms and oxidation states (Bose et al., 2011). Species identification and quantification give insight into arsenic toxicity and bioavailability.
The Oban massif hosts several rock aggregate quarries that have been zoned based on their operational longevity as old (more than twenty years of operations) and younger (less than twenty years of operations). These quarrying activities are believed to have impacted, at some levels, the geoenvironment and groundwaters within the massif and its environs (Ekwere & Edet, 2021, 2023).
This study aimed to establish the status of As concentration, possible origin, and distribution by speciation modeling, and the hazard prognosis of groundwater concentrations in sections of the Precambrian basement at the Oban Massif in southeastern Nigeria.
Study area
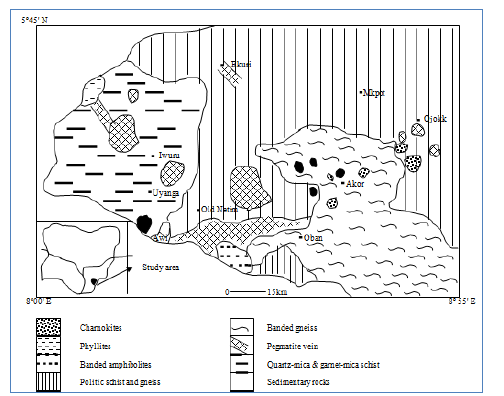
The Oban Massif forms part of the giant spurs of the western elongation of the Cameroon Mountains into the Cross River Plains of southeastern Nigeria (Ekwere, 2023a). The Precambrian basement complex is built primarily of granites, metamorphic rocks, and other rock units expressed as migmatitic and sheared gneissic rocks, paraschists, phyllites, metaconglomerates and quartzites, amphibolites and metadolerite, foliated pegmatites and aplites, pyroxenite, and others. There are also synkinematic to late-kinematic older granite intrusive series that comprise rocks varying in composition from meladiorites, granodiorite, and adamellite to granitic rocks, weakly foliated to unfoliated pegmatite, aplite, quartz veins, and unmetamorphosed dolerite to microdioritic intrusives.
These series of rocks exhibit variations across the sectors of the massif, encompassing a landmass of approximately 8,740 km2, located between longitudes 8° 00' E-8° 55' E and latitudes 5° 00' N-5° 45' N (Figure 1). The relief of the massif is rugged and undulating, straddling isolated hills of up to 1,200 m above sea level (Ekwere & Edet, 2012). Deeply incised v-shaped valleys are also found, and the hills are typically forested at their highest peaks (Ekwere, 2023a).
Drainage within the massif is through weathered zones and fractured and jointed areas, coursing dominantly in two directions: southwards (seawards) and northwards to join the upper course of the Cross River in the Ikom depression (Ekwere & Edet, 2012, 2023).
The Oban Massif and environs lie within a tropical climate belt characterized by two seasons: a rainy period from May to October and a dry one from November to April. Temperatures are generally high, with negligible diurnal and annual variations and monthly averages of 27-34° C (Ekwere et al., 2012). The yearly precipitation regime over the area is about 2,300 mm, and mean daily relative humidity and evaporation are 86% and 3.85 mm/day, respectively (Ekwere, 2012).
The massif's many rock types show diverse degrees of weathering. Pegmatites, granodiorites, diorites, tonolites, monzonites, charnokites, and dolerites have been found to penetrate these rocks (Ekwueme & Ekwere, 1989, 1991).
Hydrogeological settings
In terms of regional hydrogeological characterization, the study area belongs to the basement complex hydrogeological province of the Cross River area in southeastern Nigeria (Ekwere & Edet, 2012). Okereke et al. (1998) describe the Oban massif as a three-layer hydro-geoelectrical stratigraphic model composed of top unsaturated clayey sand (lateritic), middle gravelly sand-decomposed bedrock, and fresh fractured bedrock. Groundwater in the area is controlled by structural discontinuities such as fractures, joints, fissures, and regolith (Petters et al., 1989; Edet, 1993; Edet et al., 1994; Ekwere & Edet, 2012). The massif has a low to moderate lineament density that reflects the depth and extent of weathering profiles and their groundwater potential (Ekwere & Edet, 2012). There is no general water table for the area due to the variability of structural and geological controls. The thickness of the water-bearing formations has been estimated at 5-140 m (Edet et al., 1998; Okereke et al., 1998); the vulnerability of groundwater to pollution is dominantly controlled by the depth of the groundwater and, to a lesser extent, by the development of the vadose zone (Ekwere & Edet, 2015, 2017). Recharge rates and levels to porous aquiferous media are subject to impedance due to clay-rich top lateritic soil cover characterized by low permeabilities (Petters et al., 1989; Ekwere & Edet, 2012). Groundwater occurs under water table conditions in the weathered and fractured units, with static water levels ranging from 0.00 to 10.00m across the massif (Ekwere, 2010).
Methodology
Sixty-four (64) groundwater samples were collected from 32 locations during the dry and rainy seasons. The samples were retrieved from hand-dug wells and motorized boreholes straddling the various geologic units that cover the entire area. Duplicate samples were collected at each location in 75 cl-polyethylene bottles. The sample bottles were soaked in 10% HNO3 for 24 hours and rinsed several times with de-ionized water before use. The sampling bottles were thoroughly rinsed with aliquots of the sampled waters before collection at each location. One sample from each site was preserved by acidifying to pH ca.2 with 0.5 ml of concentrated HNO3 acid for trace metal analysis.
In situ parameters, including temperature, electrical conductivity, total dissolved solids, pH, and Eh, were measured using standard field equipment (PHT-027 multi-parameter water quality probe). Before measuring the pH, the electrode was calibrated using pH 6.88 and 4.01 buffer solutions at a temperature similar to water samples. The same meter and an Ionode ORP electrode were used to measure Eh.
The ion concentrations of water samples were analyzed using standard procedures. Sodium and potassium were determined by flame photometry, and magnesium and calcium were determined with the titrimetric method using EDTA titration. The turbidimetric method was used to calculate sulfate (SO4 2-) levels, and the titrimetric method was used for bicarbonate (HCO3 -). Nitrate (NO3 -) was determined by the Brucine colorimetric method in Ademoroti (1996) using a UNICAM UV2 spectrophotometer. Trace metal contents were also determined by atomic absorption spectrometry (AAS). Ions and nutrients were analyzed to aid in water type characterization and speciation modeling to identify arsenic species. The spectrophotometer wavelength and transmittance accuracies were ±1nm and ±0.5%T, respectively.
Analytical data quality was tested using charge balances of the groundwater composition and species distribution. The charge balance is calculated as follows:
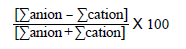
The negative charge in all cases ranged from -4.082x10~3 to 6.046x10 5. The percentage error was given by 100* (Cation - [Anion]) / Cation (Cation + [Anion]) ranging from -14.26 to 10.41. Based on the resulting groundwater metals composition, hydrochemical modeling was done using the Visual-MINTEQ software to identify metallic species. The model provides a flexible, cutting-edge example of equilibrium solution chemistry software for diluted aqueous systems in metal speciation prediction (Ekwere, 2023b). In contrast to other modeling programs, it has a sizable mineral and aqueous species database for interpretation reasons. For a saturation index (SI) equal to 0, the groundwater or solution is in equilibrium as regards the specific mineral. If SI <1, it is deemed undersaturated; if SI > 1, it is considered oversaturated.
Results and discussion
Table 1 provides a statistical summary of the physicochemical data from sample analysis. The measurements were taken throughout the dry and wet seasons, and the information was compared with the World Health Organization's (WHO, 2010) permissible limits for each parameter. The groundwater was acidic to alkaline (5.63-8.65) throughout the sampling seasons. Total dissolved solids (TDS) levels below 1000 mg/l are another factor supporting the freshness of the waters. Indicative of weak acidic activity, often carbonic acid and lesser levels of organic acids like fulvic acid, mean pH values in the dry season are greater acidity, which is within the range of 4.5-7.0 (Langmuir, 1997). According to Ekwere et al. (2012), the mean pH value during the rainy season showed a rise in alkalinity, possibly due to the effects of dissolved salts from the weathering of silicates, carbonates, evaporites, and sulfide minerals besides atmospheric contributions.
Electrical conductivity (EC), which represents the ionic strength of the solution, had a higher mean during the rainy season, indicating increased ion concentrations from salt dissolution over the period, as verified by matching increases in TDS values.
According to a nutrient evaluation, cations tended to be Ca>K>Na>Mg, and anions tended to be Cl>SO4>HCO3>NO3 during the dry season. The trends for cations and anions during the rainy season were Ca>Na>K>Mg and SO4>HCO3>Cl>NO3, respectively. The concentration of cations generally decreases from the dry to the rainy season. The fact that calcium was the most prevalent cation in both the dry and rainy seasons (78% and 61%, respectively) may be explained by the chemical weathering of silicates and the widespread presence of calcium carbonate (Langmuir, 1997). This may also determine the water-rock reactions of mineral phases such as plagioclase, calcite, aragonite, anhydrite, and dolomite from the basement and the sedimentary landscape near the study location. Magnesium and potassium came next in order of dominance among the cations, a pattern throughout all sampling seasons. Compared to other cations, potassium had the lowest concentrations, frequent in natural waters due to its propensity to be fixed by clay minerals and precipitate to form secondary minerals (Matheis, 1982).
Table 1 Statistical summary of physicochemical parameters measured in groundwater (all values in mg/l except where specified and pH)
| Dry season | Rainy season | ||||||
|---|---|---|---|---|---|---|---|
| Parameter | Min. | Max. | Mean | Min. | Max. | Mean | WHO |
| Temp.(0c) | 26 | 30.4 | 28 | 26 | 28 | 26.89 | - |
| pH | 5.88 | 8.65 | 6.75 | 5.63 | 8.10 | 7.18 | 6.5-8.5 |
| Eh (mV) | 20 | 84 | 29.79 | 14 | 67 | 27.44 | - |
| EC(nS/cm) | 60 | 580 | 247.38 | 210 | 800 | 566.67 | 1400 |
| TDS (ppm) | 40 | 890 | 233.45 | 140 | 790 | 462.22 | 1000 |
| Ca | 6.04 | 97.14 | 21.50 | 5.025 | 25.16 | 8.49 | 100 |
| Mg | 0.269 | 3.674 | 1.59 | 0.116 | 0.492 | 0.39 | 50 |
| Na | 1.762 | 6.974 | 4.35 | 1.162 | 2.113 | 1.43 | 200 |
| K | 0.192 | 32.18 | 8.51 | 0.278 | 1.314 | 0.82 | 12 |
| Fe | 0.001 | 9.80 | 1.71 | 0.128 | 1.108 | 0.547 | 0.3 |
| Mn | 0.005 | 0.224 | 0.081 | 0.008 | 0.165 | 0.075 | 0.1 |
| Ni | 0.003 | 0.061 | 0.016 | 0.003 | 0.036 | 0.011 | 0.1 |
| As | 0.001 | 0.013 | 0.008 | 0.001 | 0.030 | 0.006 | 0.01 |
| Cu | 0.001 | 0.036 | 0.012 | 0.002 | 0.015 | 0.008 | 0.05 |
| Cd | 0.001 | 0.018 | 0.004 | 0.001 | 0.025 | 0.006 | 0.005 |
| Pb | 0.001 | 0.021 | 0.004 | 0.001 | 0.041 | 0.010 | 0.05 |
| Zn | 0.020 | 0.210 | 0.090 | 0.180 | 0.350 | 0.273 | 0.01 |
| SO4 | 13.64 | 839.60 | 120.23 | 132.0 | 896.2 | 572.9 | 400 |
| NO3 | 0.094 | 11.721 | 2.69 | 1.439 | 6.714 | 4.41 | 10 |
| HCO3 | 12.14 | 384.3 | 68.42 | 72.3 | 878.4 | 454.36 | - |
| Cl | 22.14 | 596.6 | 127.35 | 98.5 | 380.2 | 197.48 | 250 |
Metal concentration assessments tended toward greater abundance with Fe > Mn > Zn > Ni > Cu > As > Pb > Cd in the dry season compared to Fe > Zn > Mn > Ni > Pb > Cu > As > Cd in the wet season.
The WHO (2010) tolerable standard of 0.3 mg/l for Fe was exceeded in the dry and rainy seasons with mean levels of 1.71 and 0.547 mg/l, respectively. According to Ekwere & Edet (2015), the increase in aquifer recharge from surface runoff during the rainy season may have had a dissolving effect on the mean concentration value that decreased during the rainy season. Since igneous and metamorphic rocks predominate in the research area, Fe is primarily mobilized and redistributed during the chemical weathering of these rocks (Ekwere & Edet, 2012). According to Deer et al. (1992), silicates and alumino-silicates like olivine, pyroxene, amphibole mineral groups, and mica biotite are the most likely sources of iron on the massif. Other widespread minerals that define metamorphic and igneous rocks include magnetite (Fe2O4) and pyrite (FeS2) (Ekwere, 2012).
The mean Mn concentrations during the dry and rainy seasons were 0.081 mg/l and 0.075 mg/l, respectively, whereas the mean Ni concentrations were 0.016 mg/l and 0.011 mg/l. The mean readings for these metals were significantly below the 0.1mg/l acceptable limit established by WHO (2010). Both metals are typically found alongside Fe in ferromagnesian igneous and metamorphic rocks, and just like with Fe, their evolution within aquifers is governed by redox potential-related processes.
The mean Cu concentrations during the dry and wet seasons were 0.012 mg/l and 0.008 mg/l, respectively, below the allowed limit of 0.05 mg/l. Hydrated minerals containing Cu2+ ions include antlerite, bronchantite, chalcanthite, atacamite, azurite, malachite, melanothallite, and tenorite. Their concentrations are influenced by the pH, redox, chlorinity, sulfate, and total copper in the study area (Ekwere et al., 2011; Ekwere, 2023b).
Pb showed average readings within the permissible range of 0.05 mg/l across all sample seasons. Other significant Pb species found in the research area, besides free mobile Pb2+ ions, include anglesite, cerussite, litharge, massicot, cotunnite, and many other abundant hydrated species (Ekwere, 2023b). Due to the low Pb concentration and absence of PbCO3, which would restrict this species' mobility, its presence is not a concern for groundwater contamination (Edet et al., 2004).
Cd mean readings ranged from 0.004 mg/l in dry conditions to 0.006 mg/l in wet ones. The average value throughout the wet season exceeded the allowable limit of 0.005 mg/l. Cd is mostly associated with the ultra-basic and basic minerals of the basement massif (Ekwere, 2010). Considered as the result of in-situ anthropogenic impacts, a few areas showed spike concentrations over the permissible level.
The trace element of primary concern in this study, arsenic (As), had mean concentrations of 0.008 mg/l in the dry season and 0.006 mg/l in the rainy season, substantially below the permissible limit of 0.01 mg/l. However, three locations, barely 4.68% of the study's total sampled groundwater, showed readings above the permitted threshold during the dry season. As observed, areas with relatively high As concentrations also had relatively high Fe, HCO3 -, and low NO3 - and SO4 2- concentrations, deemed indicative of the prevalence of iron oxyhydroxides' reductive dissolution (Khan & Rai, 2022; Soldatova et al., 2022). According to Vivona et al. (2007), this defies the presumption that Fe oxidation processes remove solutes (arsenates) from the solution.
Hydrochemical facies and water classification
The sampled groundwaters were classified based on Piper's (1944) trilinear plot and metal load according to Ficklin et al. (1992) and Caboi et al. (1999). The Piper plot in figure 2 shows the relative concentrations of the major ionic species in the groundwater based on recorded values. Closely followed by chloride, calcium was the dominant cation, and bicarbonate was the dominant anion, leading to two recognizable hydrochemical facies: Ca - (Mg) - HCO3 and Ca - (Na) - Cl - SO4.
The dominant alkaline-earth-bicarbonate facies [Ca-(Mg)-HCO3] has been defined as water's alkaline group, typical of basement terrains; it has developed regolith with limited mixing, perhaps reflecting a primary stage of the evolution of its groundwater system (Ekwere, 2012; Vivona et al., 2007; Elueze et al., 2004). Its composition reflects the dissolution of silicate minerals in the bedrock and alumino-silicates in the weathered regolith (Tijani, 1994).
The second hydrochemical facie, Ca - (Na) - Cl - SO4, reflects the constituents of atmospheric precipitation (Davis & Deweist, 1966) and its subsequent influence on groundwater recharge.
Zhu et al. (2023) report the alkali/alkaline - HCO3.SO4 water types are favorable for arsenic dissolution in groundwaters.
Figure 3 displays the metal load (Fe + Mn + Ni + As + Cu + Pb + Zn + Cd) against the pH plot. More than 85% of the water fall within the plot's nearly neutral low metal field. The cluster denotes that the region's naturally-weathered basement rocks are the main source of these metals. Plots in the acid-low metal field might depict how acid precipitation interacts with changed rocks to produce acidic groundwater (Ekwere & Edet, 2012). The intake of unpolluted water and the adsorption and precipitation processes can reduce the levels of metals in groundwater (Rosner, 1998; Paulson, 1999). As a result, adsorption and precipitation processes may be able to lower concentration levels of metal inputs from anthropogenic and weathering processes (Ekwere, 2023b).
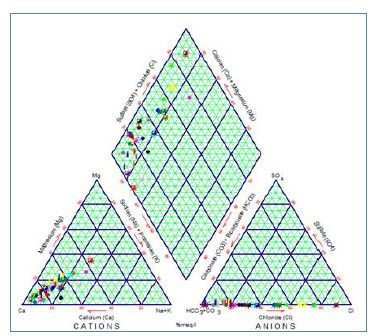
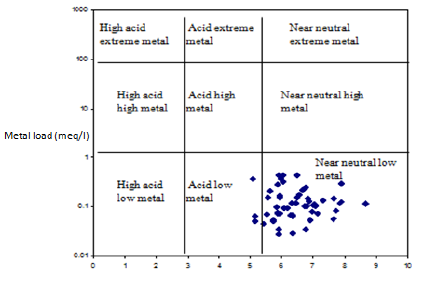
Figure 4 shows a plot adapted from Vivona et al. (2007) of an inverse association between Ca and As. It supports the chemical affinities of soluble hydrated calcic minerals (e.g., plagioclase) and arsenates (e.g. [Ca5(AsO4)3]) reported in the groundwaters of the research area (Ekwere, 2010).
Principal component analysis
Correlation analysis. At p=0.05 (5% level of significance), discernible correlations between variables were identified and interpreted using Pearson's correlation matrix (Table 2). Correlation indices between variables with coefficient r > 0.7 are considered strongly associated for ranking and classification purposes; coefficients between 0.3 and 0.6 are considered moderate correlations, and those < 0.3 are considered low. Both positive and negative correlation indices are possible.
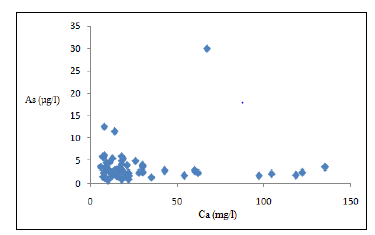
Table 2 Correlation analysis of parameters measured in groundwater
| pH | Fe | Mn | As | Cu | Pb | Zn | Cd | Cr | Cl | HCO3 | SO4 NO3 | |
|---|---|---|---|---|---|---|---|---|---|---|---|---|
| pH | 1 | |||||||||||
| Fe | -0.181 | 1 | ||||||||||
| Mn | 0.128 | 0.323 | 1 | |||||||||
| As | 0.421 | 0.526 | 0.304 | 1 | ||||||||
| Cu | -0.102 | 0.142 | -0.007 | 0.346 | 1 | |||||||
| Pb | -0.097 | -0.199 | -0.128 | 0.118 | -0.284 | 1 | ||||||
| Zn | 0.071 | 0.037 | 0.104 | 0.345 | 0.661 | -0.082 | 1 | |||||
| Cd | 0.958 | -0.039 | -0.018 | 0.067 | 0.412 | -0.174 | 0.273 | 1 | ||||
| Cr | 0.341 | -0.355 | -0.146 | 0.315 | 0.043 | 0.070 | 0.191 | 0.214 | 1 | |||
| Cl | 0.273 | 0.296 | 0.412 | 0.048 | 0.031 | 0.048 | 0.218 | 0.010 | 0.092 | 1 | ||
| HCO3 | 0.426 | -0.019 | 0.231 | 0.256 | 0.026 | -0.244 | -0.046 | 0.284 | -0.113 | 0.246 | 1 | |
| 0.259 | 0.396 | 0.086 | 0.198 | 0.166 | -0.340 | -0.034 | 0.278 | -0.078 | 0.059 | 0.384 | 1 | |
| NO3 | 0.191 | -0.946 | 0.304 | 0.204 | 0.014 | 0.256 | 0.208 | -0.106 | 0.025 | 0.681 | 0.103 | -0.188 1 |
In this matrix, pH has a strong positive correlation (0.958) with Cd, a moderately positive one with Cr (0.341), As (0.421), and HCO3 (0.426), and a weak positive correlation with SO4. According to the correlation, carbonic acid and bicarbonate (HCO3) concentration in groundwater regulates pH or acidity and these, the solubility and potential mobilization of related metals. The calcic plagioclase in aquifer matrixes and contents from recharge sources with meteoric origin are believed to be the sources of the bicarbonate ions (Ekwere, 2010).
Fe has a moderate positive correlation with As, Mn, and SO4, and a low one with Cu and Cl, which have to do with how water interacts under the surface with ferromagnesian rocks and other mineral complexes in the regolith.
Cu-Pb-Zn and arsenic have a weak to moderately favorable connection, and Cu and Cd-Zn have a moderately to strongly positive association, which suggests that groundwater in the catchment region interacts with the regolith and aquifers of chalcophile progenitor rocks. According to the apparent weak and faint positive association between some of the metals, there may be a common source but waning effect of environmental and subterranean processes.
Cluster analysis
Based on the water parameters measured, the cluster analysis resulted in the dendrogram shown in figure 5. Four clusters arose from an absolute correlation of a single linking iteration: water quality key indicators (pH, HCO3, SO4) and Fe, Pb, and Cr formed cluster one (1), with a 28.25 similarity level and geogenic control, as inferred from the correlation analysis; cluster 2 (Mn, Cl, NO3) showed a 28.41 similarity and suspected anthropogenic control reckoned by biogenic or nutrient inputs, and clusters 3 (As) and 4 (Cu, Zn, Cd) were related to rock mineralogy.
Predicted arsenic species in groundwater
The distribution of arsenic aqueous ionic species and their corresponding saturation indices were estimated from groundwater compositions using hydrochemical modeling with the Visual-MINTEQ software, which, in contrast to other modeling programs, has a sizable database of mineral and aqueous species facilitating interpretation (Ekwere, 2023b). Saturation index (SI) values equal to 0 indicate groundwater or solution in equilibrium concerning the specific mineral. If SI < 1, it is deemed undersaturated; if SI > 1, it is regarded as oversaturated.
An element's bioavailability, toxicity, and mobility are correlated with its physico-chemical speciation. Arsenic can be found in the environment in many forms and redox states, for which its toxicological study is challenging (Soldatova et al., 2022). Table 3 lists the aqueous species of arsenic. However, it should be noted that the geochemical modeling of the data predicted about 75% of ionic arsenic species. Other arsenic ionic species may be bound in mineral-species phases of elements not analyzed here; an approach to the projected species' potential effects on mineral solubility, adsorption and desorption behavior, and potential bioavailability is provided. Arsenic ionic species saturation indices may be used to identify substances precipitating, dissolving, or affecting groundwater composition. These calculations are based on an equilibrium model, and the results should only serve as a guide since kinetic factors could prevent them from achieving equilibrium (Ekwere, 2023b).
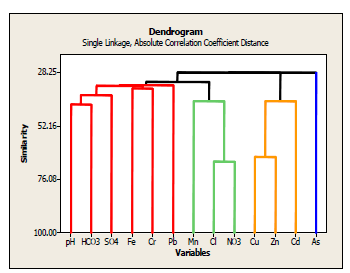
Table 3 Predicted aqueous arsenic (As) species from geochemical modeling
| Ionic species | Saturation index | %Total concentration |
|---|---|---|
| AsO4 -3 | -32.84 | 68.2 |
| As2O5 | -22.27 | 1.853 |
| Zn3AsO4.H2O | -10.90 | 1.652 |
| Mn3(AsO4)2.H2O | -7.98 | 1.278 |
| Ni3(AsO4)2.H2O | -14.74 | 0.966 |
| Pb3(AsO4)2 | -4.91 | 0.746 |
| Cu(AsO4)2.H2O | -5.78 | 0.046 |
| Cu3(AsO4)2.H2O | -12.42 | 0.038 |
| Ca3(AsO4)2.H2O | -21.84 | 0.072 |
AsO4 3+ contributed roughly 68.2% of the total arsenic ionic concentration, i.e., it was the dominating arsenic species composed of the hydrated ionic phases H2AsO4, H3AsO4, and HAsO4 2-; As2O5 (1.85%) came in second, and the other predicted species were identified as other metals' hydrated arsenates. The saturation indices revealed that all contributing species were undersaturated.
Fe and Mn oxyhydroxide coatings are known to adsorb arsenic (As), and Ekwere (2012) has detected these species in the area's groundwater. Adsorbed co-precipitated As is released as a result of the reduction of Fe and Mn hydroxides common in shallow groundwater. In shallow wells, an increase in the water table frequently causes the reductive dissolution of As-rich Fe oxyhydroxides. Qin et al. (2019) have suggested that adsorbed arsenate anions may also interact with dissolved carbonate anions and be discharged into groundwater. According to the geochemical model, arsenic predominately occurs as arsenates (As V), not as dangerous as the arsenite species (As III).
Conclusion
The groundwater in the study area is slightly acidic to alkaline across both sampling seasons, and the values of total dissolved solids indicate it can be considered fresh.
Ion concentrations generally decrease from the dry to the rainy season; the trend of dominance is similar, with slight variations in the major anions. Ionic concentrations reflect silicate weathering, resulting in two hydrochemical facies, Ca - (Mg) - HCO3 and Ca - (Na) - Cl - SO4, of the basement groundwaters primary evolution.
The principal component and correlation and clusters analyses evidenced an interrelation between measured parameters explained basically by geogenic processes.
Arsenic concentrations are well within acceptable limits, and geochemical modeling predicts undersaturated aqueous species, especially arsenates, in the current physicochemical conditions. The bioavailable forms of arsenic are less toxic and pose no danger.

