


 English (pdf)
 Article in xml format
 Article references
 Send this article by e-mail
 Cited by SciELO
  Cited by Google
  Similars in
SciELO
Similars in
SciELO  Similars in Google
 Permalink
Introduction
High Tc superconductors have been a topic of thorough research since their discovery (Bednorz & Müller, 1986), these cuprate type-perovskite ceramics reached a critical temperature above liquid nitrogen not long after their discovery, being YBCO ceramics their first representative (Wu et al., 1987).
YBCO ceramics made via solid state synthesis are composed by a multi-grain structure which divides the resistive superconducting phase in two different transitions: an intragranular pairing transition at Tc, where each grain reaches a superconducting state individually and an intergranular coherent transition at Tcs, where all the sample becomes superconductive (Rosenblatt et al., 1990). Near the coherent transition, phase fluctuations of the superconducting order parameter lead to electron tunneling through the insulating media between grains, that is, on the insulating-superconducting interface. These electron-tunneling phenomena have been called Josephson-like effects, which are thought to be grain size or porosity-dependent. Due to this dependence, to observe these fluctuations, grain size and/or porosity will have to be controlled; it has been observed that varying the sintering temperature causes a change in the sample's porosity (Prayoonphokkharat et al., 2013). Since Josephson effects occur near the coherent transition, or in other words, near a critical temperature, critical behavior is expected. In the process of this characterization, critical parameters of our YBCO samples are calculated and then corroborated with the reported values found on the literature.
YBCO samples are also type II superconductors, which exhibit a mixed state where magnetic field lines partially enter the sample in the form of vortices called Abrikosov vortices (Ostermann et al, 1998). It has already been mentioned the critical pairing temperature Tc and the critical coherence temperature Tcs, there is also a lower critical field H , which determines the moment these Abrikosov vortices start to flow inside the sample and an upper critical field Hc2 which turns the sample to the normal non-superconducting phase; related to these fields there is also a critical current density Jc that breaks superconductivity. Another critical parameter is the penetration depth λ which is a measure of the mean distance the magnetic field lines enter the sample at its borders and the coherence length ξ that relates to the mean distance two electrons need to be to form a cooper pair (those responsible for superconductivity and super-currents).
Analyzing magnetic isotherms (magnetization versus applied field curves) in the superconducting state, lead to hysteresis loops which are studied by the Bean's model (Cyrot et al., 1992). From this model, a relation between the change in magnetization AM and the critical current density Jc has the form of equation (1).
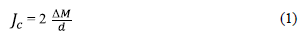
where d is the mean grain size of the sample being analyzed and ΔM is the change in magnetization observed in the magnetization M versus applied field H plot.
Recent papers have studied this coherent transition via doping and coating of the YBCO samples with different materials, and different synthesis methods, to achieve novel behaviors that may guide us to understand the electronic mechanisms around this transition. One example analyzes the magnetic properties of two different deposition methods (IBAD and RABiTS) and demonstrates the appearance of magnetic granularity, where the films trap super-particles and creates an opposing magnetic field that shifts the maximum in hysteresis isotherms loops (Palau et al., 2003); another one uses multilayers of YBCO/ PLCMO (Manganite) and finds a contrary effect of normal superconductors, where under the critical temperature Tc its properties are really resistive, while an increase in an applied magnetic field recovers the coherent state and the sample begins superconducting (Mallett et al., 2016).
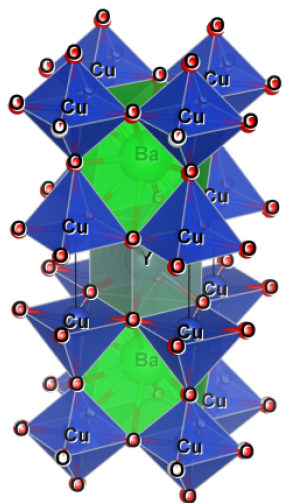
The YBa2Cu3O7-δ is a superconductor type-perovskite ceramic compound which has been observed to crystallize in the Pmmm (#47 Orthorhombic) space group and has the following lattice parameters at 297 K: a = 3.82030(8) Å, b = 3.88548(10) Å, c = 11.68349(23) Å \ and α = β = γ = 90°; its crystal structure is made up of a three floor perovskite with three Cu-O planes, two Ba-O planes and a single Y in the middle of the second floor (Williams et al., 1988).
The precursor oxides used to form our YBa2Cu3O7-δ were as follows: Y2O3, BaCO3 and CuO; purity details, synthesis process and other characteristics of the oxides used are found in the synthesis section.
Yttrium(III) Oxide (Y2O3) has been observed to crystallize in the Ia3 (#206 Cubic) space group with the following lattice parameters at 294 K: a = b = c = 10.6056(3) Å and α = β = y = 90° (Bladinozzi et al., 1998). It has a melting point of around 2410 °C, its crystal structure is similar to a cubic bixbyite (Mn2O3) (Yong-Nian et al., 1997).
Barium Carbonate (BaCO3) crystallizes in the Pmcn (#62 Orthorhombic) space group with lattice parameters: a = 5.3126(5) Å, b = 8.8958(5) Å, c = 6.4284(5) Å and α = β = γ = 90°; its crystal structure is similar to the aragonite (CaCO3) (De Villiers, 1971). At around 1000-1450 °C BaCO3 undergoes a decomposition into barium oxide (BaO) and carbon dioxide gas (CO2), which does not take part in the sintering process and leaves the reaction, letting BaO as the main precursor oxide in the diffusion of the grains (synthesis section); BaO has a melting point of around 1923 °C and the decomposition reaction is observed in equation (2) (Patnaik, 2002).

Copper(II) Oxide (CuO) crystallizes in the C2/c (#15 Monoclinic) space group with lattice parameters at 11 K: a = 4.6833(2) Å, b = 3.4208(1) Å, c = 5.1294(2) Å, β = 99.567(1)° and α = y = 90° (Brese et al., 1990). It has a melting point of 1326 °C and its crystal structure is in an approximately square planar configuration (Forsyth et al., 1991).
Experimental procedures
Annealing and sintering processes were made using a Thermo Scientific Lindberg/Blue tubular furnace. Phase identification was made through XRD measurements using a Panalytical Xpert Pro PW1710 diffractometer, with Cu Kα λ = 1.5406 Å radiation, ranging from 0° ≤ 2θ ≤ 90°; Rietveld refinement, using GSAS software, of these data was compared with CIF files taken from COD data base from previous phase identification, resulting images were done using VESTA software. Morphological analysis was made through SEM-EDX measurements using a Tescan VEGA 3 microscope; using ImageJ software, grain size and porosity measurements were done, EDX data was used to corroborate composition. VSM analysis was made using Quantum Design's VersaLab magnetometer; superconductive parameters were measured here.
Synthesis
The YBa2Cu3O7-δ samples were made via high-temperature solid-state synthesis. As mentioned before, the precursor oxides were Y2O3, BaCO3 and CuO with 99.99 %, 99.8 % and 99.995 % of purity, respectively. A total mass of 2 g was set, and based on this mass, stoichiometry calculations were made following the reaction in equation (3).

The stoichiometry calculations, taking purity into account, can be found in table 1.
Table 1 Stoichiometry calculations for oxides with their respective purity.
| Oxide | Purity (%) | Mass (g) |
|---|---|---|
| Y2O3 | 99.99 | 0.3026(2) |
| BaCO3 | 99.8 | 1.0599(2) |
| CuO | 99.995 | 0.6396(2) |
Before using the powder oxides, a sample drying was made for 18 hours at 120 °C. Then, after carefully weighing the amounts of oxides in table 1 on a balance, a grinding process on an agate mortar was done on the calculated bulk samples, this process took about a total of three hours. This, now single powder, was then turned into pellets of 0.9(1) cm in diameter and were pressed at 5.0 x 10⁸ Pa. This process was made two times, and four cylindrical pellets were made each time, two pellets were taken from the first four (the other two were lost in the sintering process) and the whole four samples from the second, adding to six samples total.
After the six pellets were made, they were subjected to an annealing process for 48 hours at T = 850 °C for the first two and at T = 880 °C for the other four. Following this annealing process, a 30-minute final grinding was done, together with another pelleting by which the same six samples were made. Finally, a sintering process was done to the six samples at T = 890, 900 °C for the first two and T = 860, 870, 880, 890 °C for the remaining four. In this sintering ramp there is a second thermal treatment that starts at T = 450 °C, this corresponds to an oxygenation process necessary in these oxygen deficient YBCO samples, since it ensures some gets trapped inside the sample increasing its oxygen content.
After the annealing process of the six samples was done (before differentiating them by its sintering temperature), XRD analysis was used to characterize them and to confirm the single YBa2Cu3O7-δ phase. Then, after the sintering process of each of the six pellets had ended, SEM and VSM analysis was applied to them.
Crystal structure
Since there were only two different sets of samples after the annealing process (one for each annealing temperature), two diffractograms were analyzed. It was observed from both raw diffractograms that the amorphous, low-angle phase, is significantly lower than the principal peaks. Considering this is only after the annealing process, the following sintering will be enough to confirm a reaction has taken place. Phase identification with peak comparison showed a single YBa2Cu3O7-δ phase from both, so a Rietveld refinement using these phases could be done.
Figure 1 exemplifies these Rietveld refinements. Lattice and Rietveld parameters are found in table 2.
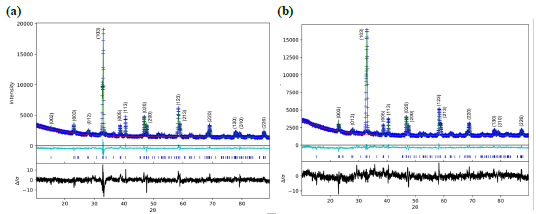
Figure 1 Rietveld refinement from both samples at different annealing temperatures. (a) T = 850 °C for the first two samples and (b) T = 880 °C for the other four.
Table 2 Lattice and Rietveld parameters for both refinements.
| Sample | a(Å) | b(Å) | c(Å) | R wP (%) | X 2 |
|---|---|---|---|---|---|
| YBa2Cu3O7-δ I | 3.8225(2) | 3.8841(2) | 11.6774(6) | 4.27 | 3.52 |
| YBa2Cu3O7-δ II | 3.8272(2) | 3.8847(3) | 11.670(1) | 4.17 | 3.21 |
It was found then that these YBa2Cu3O7-δ samples crystallized in the Pmmm (#47 Orthorhombic) space group as expected (Williams et al, 1988).
In both cases, a R wp below 5% was observed and a x 2 below 5, which represents a good fitting of the data. Figure 2 shows the crystal structure of both samples from the XRD analysis.
Morphological characterization
Following the sintering process, where the six samples were already differentiated by its sintering temperature, SEM pictures were taken to verify the mean grain size to sintering temperature relation. Figure 3 shows each picture and its corresponding sintering temperature.
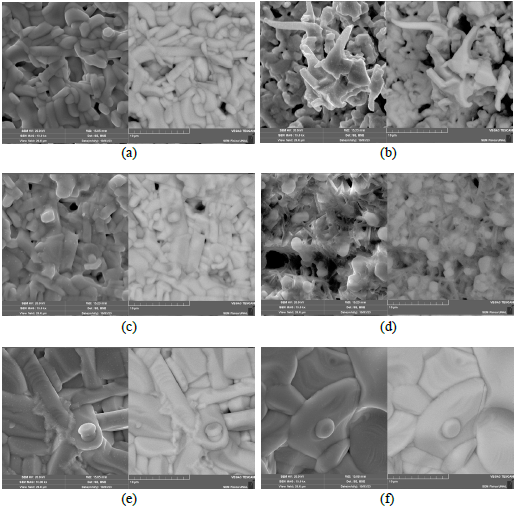
Figure 3 The previous plots show the SEM pictures at the following sintering temperatures: (a) 860 °C, (b) 870 °C, (c) 880 °C, (d) 890* °C, (e) 890 °C and (f) 900 °C.
The method used to calculate each grain size was through a measure of their area and determining a mean diameter using

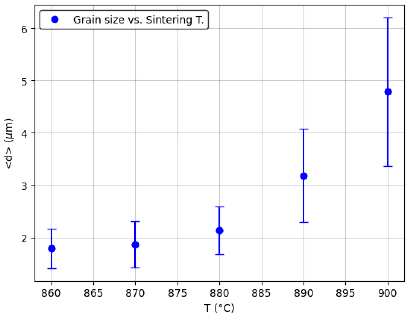
Figure 4 represents the mean grain size to sintering temperature relation after calculating the grain size from figure 3.
As can be observed, this is an increasing relation as expected from diffusion and merging between grains. This increasing behavior leads to the final step: calculating the critical superconducting parameters from magnetic measurements and calculate them as a function of the grain size. It is important to keep in mind that there are only five data points since one of the two samples at T = 890 °C (figure 3d) had a green phase during the sintering process and will not be part of the results.
Magnetic response
Magnetic measurements on VSM were taken to calculate the superconducting parameters. Three curves were extracted from these measurements for each sample: a T = 300 K and T = 50 K magnetization M versus applied field H isotherms and a constant H = 10 Oe magnetization M versus temperature T curve.
In figure 5 the M versus H relation at T = 50 K is plotted.
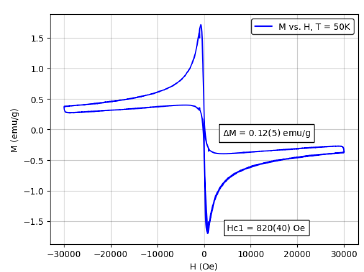
A hysteresis loop corresponding to Bean's model is observed, at this temperature the sample has already had a superconducting transition. Here, the lower critical field Hc1 and the change in magnetization ΔM can be extracted, ΔM is used to calculate the critical current density Jc from Bean's model (equation 1).
To calculate the lower critical field H , it was used a convention which takes a linear regression after the magnetization minimum, that is, on the mixed superconducting region, the Hc1 will be where this regression intersects its minimum. A value of Hc1 = 0.82(4) kOe was obtained. ΔM was calculated taking a lower and upper linear regression on the region furthest from the exponential behavior and computing the difference between them at H = 28 kOe, resulting in ΔM = 0.12(5) emu/g.
In figure 6 the magnetization M versus temperature T at H = 10 Oe is plotted.
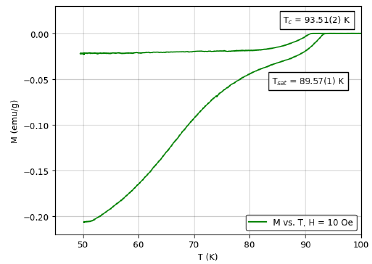
The upper side of the graph represents the FC curve and the lower the ZFC. Here, important temperature parameters can be extracted, these parameters are the critical pairing temperature Tc and what has been called a saturation temperature Tsat.
To calculate Tc the usual convention was used, taking a linear regression of the paramagnetic part of the graph and a linear regression when the sample starts to expel the external field, that is, when negative magnetization appears, Tc will be the intersection point between them. A value of Tc = 93.51(2) K was obtained.
Tsat was calculated from the expelling regression in the previous step, and a linear regression when this curve has had a change in slope, the intersection point will be the Tsat. This inflection point has been attributed to the coherent region, a granular transition where Josephson vortices prevent a further decrease in magnetization and saturates the curve. Once this saturation ends, the Meissner region has been achieved and a decrease in magnetization is again observed.
It is important to know that this temperature was not labeled as a coherent transition because this saturation interval is not well defined for all the samples, so it cannot be compared to coherence of grains, but they could be related. Nonetheless, electric measurements which will be done to the samples, will show this coherence transition effectively and will be compared to these magnetic results to show if they are the same or if they have a functional relation. A Tsat = 89.57(1) K was obtained from this plot.
A relation between Hc1 and grain size d is not observed (interpreted as a constant behavior), so an arithmetic average was used to obtain a lower critical field of Hc1 = 0.5(2) kOe; this constant relation refers to the fact that Abrikosov vortices will enter the sample at Hc1 even if there is no grain interface. This is because these vortices only have to do with superconducting grains in the sample and not with grain interfaces.
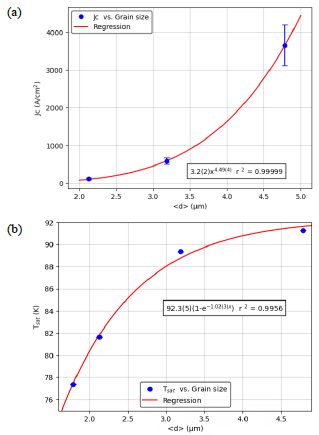
Figure 7a shows the critical current density Jc (calculated from equation 1) as a function of the grain size. It represents an increasing relation, so a regression of the form axb was done with parameters a = 3.2(2) A/cm2 µmb and b = 4.49(4) as well as a r2 = 0.99999 correlation; this increasing relation may be because, as mean grain size increases, super-currents can flow in a larger space without reaching a non-superconducting grain interface.
Once again, a relation is not observed in the Tc-d plot so it is interpreted as a constant behavior, and its average was Tc = 93(1) K; in accordance with its first study (Wu et al., 1987); this can only be since the pairing transition happens in each grain independently (Rosenblatt et al., 1990).
Figure 7b shows the saturation temperature Tsat as a function of the grain size. An increasing relation can be recognized and a regression of the form a(1 - e bx ) was done with parameters a = 92.3(5) K and b = -1.02(3) and a r2 = 0.9956 correlation. It was also expected an increasing relation from this temperature; this is because it is thought to be related to the coherence transition, this means, as grain size increases, less grain interfaces are observed, and it is not required to reach as much low temperature to start a coherence communication between grains. So, when there are no more grain interfaces, Tsat could converge to the critical pairing temperature Tc.
Conclusions
XRD confirmed the phase, and lattice parameters were extracted from Rietveld refinement, SEM analysis showed an increasing dependence on sintering temperature, VSM analysis determined a constant Tc = 93(1) K and Hc1 = 0.5(2) kOe as well as an increasing behavior of Jc and Tsat. This phenomenon is explained since Tc and Hc1 have to do with the pairing transition, while Tsat could be related to the coherence transition; this hypothesis will only be confirmed by characterizing the coherence transition from electrical measurements.

