text in
  English (pdf)
 Article in xml format
 Article references
 Send this article by e-mail
 Cited by SciELO
  Cited by Google
  Similars in
SciELO
Similars in
SciELO  Similars in Google
 Permalink
Remark
| 1) Why was this study conducted? |
| Ivermectin has been used since 1995 for the African Programme for Onchocerciasis Control (APOC). Currently, it is being considered as the possible target drug for SARS CoV-2. The low frequency of cases and deaths from the SARS-CoV-2 COVID-19 virus in some countries of Africa prompted us to assess the possible influence of this community-based strategy. |
| 2) What were the most relevant results of the study? |
| APOC Countries with a Community-directed treatment with ivermectin strategy show 28% lower mortality (RR= 0.72, 95% CI: 0.67-0.78) and 8% lower rate of infection (RR= 0.92, 95% CI: 0.91-0.93) due to COVID-19; compared with non-APOC countries. |
| 3) What do these results contribute? |
| Our data suggest that a mass public health preventive campaign against COVID-19 may have taken place, inadvertently, in some African countries with massive community ivermectin use. Additional studies are needed to confirm it. |
Introduction
The scarcity of COVID-19 incidence cases in the African continent as can be appreciated in: https://coronavirus.jhu.edu/map.html, (last time consulted 23-10-20) prompted us to assess the influence of massive distribution of Ivermectin that began in 1989 in a program against river blindness in some African countries and continued in 1995 when World Health Organization (WHO) launched the African Programme for Onchocerciasis Control (APOC). The main objective of the APOC program has been the establishment of sustainable community-directed treatment with ivermectin (CDTI) and vector control with environmentally-safe methods where appropriate.
APOC is a partnership programme including 19 countries with active involvement of the Ministries of Health and their communities, several international and local NGDOs, the private sector (Merck & Co., Inc.), donor countries and UN agencies. The World Bank and WHO acted as Fiscal Agent as Executing Agency, respectively. A Community-Directed Treatment with Ivermectin was the delivery strategy of APOC. With the purpose of achieving sustainability, local communities were empowered to administer and distribute ivermectin in their own villages. The programme which was extended until 2015 intended to treat over 90 million people annually in the 19 countries, protecting an at risk population of 115 million, and to prevent over 40,000 cases of blindness every year 1,2. In 1998 the Program was expanded to some Asian countries to combat lymphatic filariasis and APOC countries continued to use ivermectin, in association with albendazole, in this program 3.
The purpose of this ecological study was to compared mortality and infection rates of SARS-CoV-2 (COVID-19) of two groups of African countries, one group exposed to massive community distribution of ivermectin with other group of countries that were not so exposed.
Materials and Methods
With data from Worldometer COVID-19 Data 4, we classified the 54 sovereign African countries in two groups: APOC group comprising the 19 countries that had national Ivermectin programs, and a non-APOC group with the rest of 35 African countries. Figure 1A shows a map with African countries, according to participation in the APOC Program.
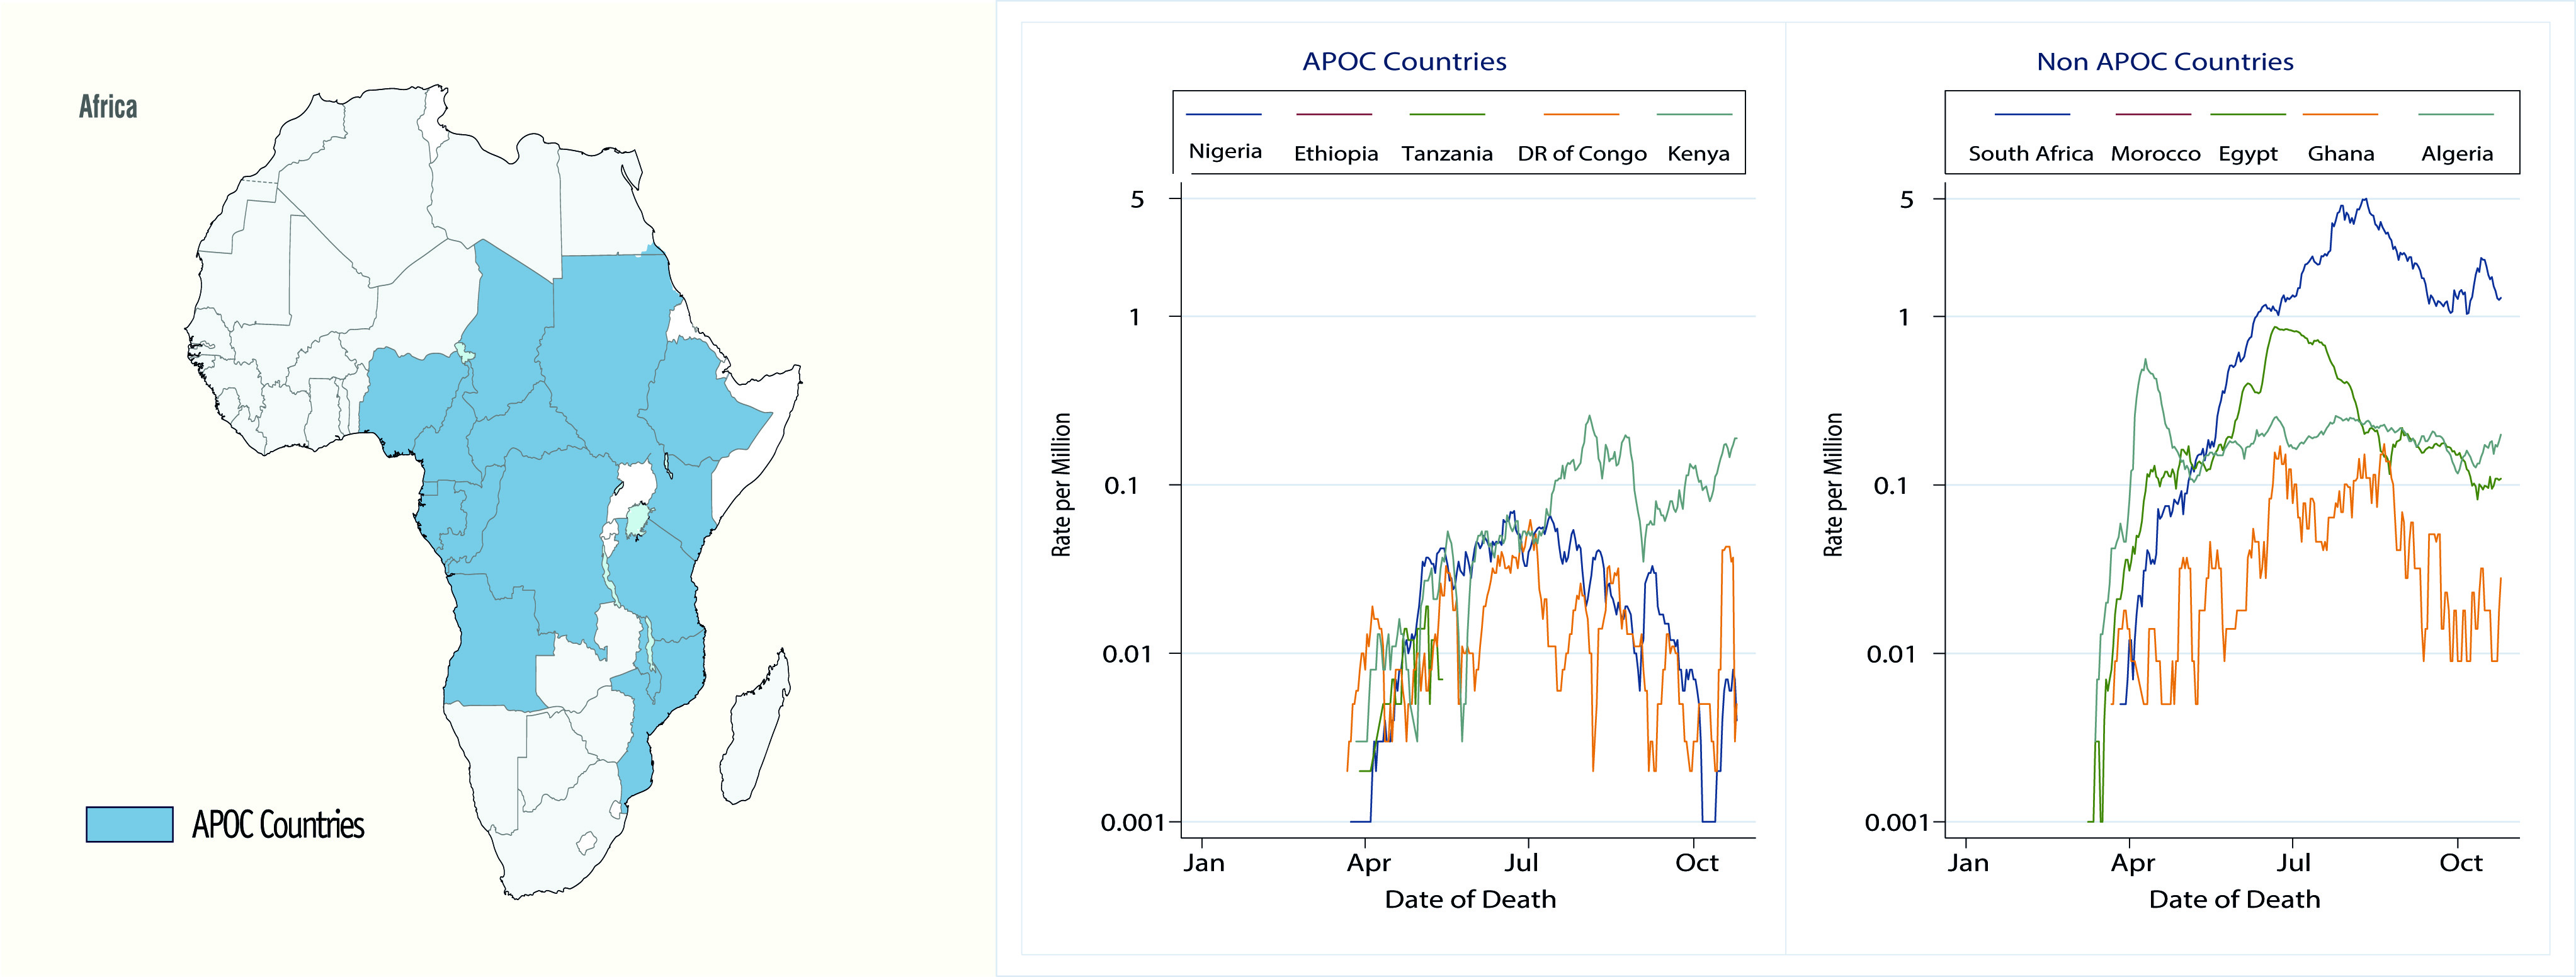
Figure 1 African Programme for Onchocerciasis Control (APOC) and Covid-19. 1A. Countries that participated in the APOC. APOC countries: Angola, Burundi, Cameroon, Central African Republic, Chad, Congo, Democratic Republic of Congo, Ethiopia, Equatorial Guinea, Gabon, Kenya, Liberia, Malawi, Mozambique, Nigeria, Rwanda, Sudan, Tanzania and Uganda. NON-APOC countries: South Africa, Egypt, Morocco, Algeria, Ghana, Senegal, Libya, Ivory Coast, Zambia, Guinea, Namibia, Tunisia, Zimbabwe, Mauritania, Djibouti, Eswatini, Cabo Verde, Gambia, Somalia, Eritrea, Seychelles, Mali, Botswana, Guinea-Bissau, Benin, Sierra Leone, Burkina Faso, Togo, Lesotho, Niger, South Sudan, Sao Tome and Principe, Republic of Madagascar, Comoros, Mauritius. 1B. Daily COVID-19 mortality rates per million according to time and APOC status.
We used generalized Poisson regression models to obtain effect estimates of APOC status on SARS-CoV-2 cumulative infection and mortality rates. The models included country characteristics to adjust for socioeconomic differences between countries that could affect their response capacity and quality to the pandemic. To measure the impact of confounding variables like health, education, and standard of living we decided to control them by using the Human Development Index (HDI) 5. HDI is a geometric mean of normalized indices of the three key dimensions of human development: health, assessed by life expectancy at birth; education, measured by mean of years of schooling for adults aged ≥25 years and standard of living measured by gross national income per capita. Although it does not reflect poverty, security, empowerment, or inequalities, we consider that it is the best indicator that represents the global situation of a country 5.
We considered countries with unusual high rates (compared to the rest countries) as ‘true outliers’ (i.e., values that are correct but unusual) and represented them with indicator variables as predictors in the models. This approach allowed us to evaluate the estimated rates with and without those country-related effects. All tests were done two-sided, and p <0.05 was considered statistically significant. R 6 and STATA version 16 were used for all statistical analyses.
Results
Striking differences in the evolution of COVID-19 mortality are observed Figure 1B and APOC countries appear to have lower rates. Analysis of raw data, as shown in Table 1, indicate that APOC countries had lower infection (as indicated by lower case detection) and mortality rates due to COVID-19 (p <0.001). The ratio of mortality rates was 0.12 (95% CI: 0.12-0.13) and the ratio of infection rates was 0.16 (95% CI: 0.16-0.16), indicating that the APOC group was associated with lower mortality and infection rates compared to non-APOC countries, that is 88% and 84%, respectively. In addition, the APOC countries also had a lower number of detected cases and a lower frequency of tests.
Table 1 Number and rate of confirmed detected cases, deaths, and tests due to COVID-19. countries APOC and non-APOC (update 23-10-20)
| African country | Population number | Cases number | Rate/million | IC 95% | Deaths number | Rate/million | IC 95% |
|---|---|---|---|---|---|---|---|
| APOC | 778,335,764 | 316,773 | 407 | 405.6-408.4 | 6,099 | 7.8 | 7.6-8.0 |
| Non-APOC | 558,607,579 | 1,370,056 | 2,453 | 2,448.5-2,456.7 | 34,591 | 62.0 | 61.3-62.6 |
Mortality, detection of new cases and number of tests performed were positively and significantly associated with HDI. The Figure 2 shows the COVID-19 Cumulative Mortality Rate per million in APOC countries compared with non-APOC countries.
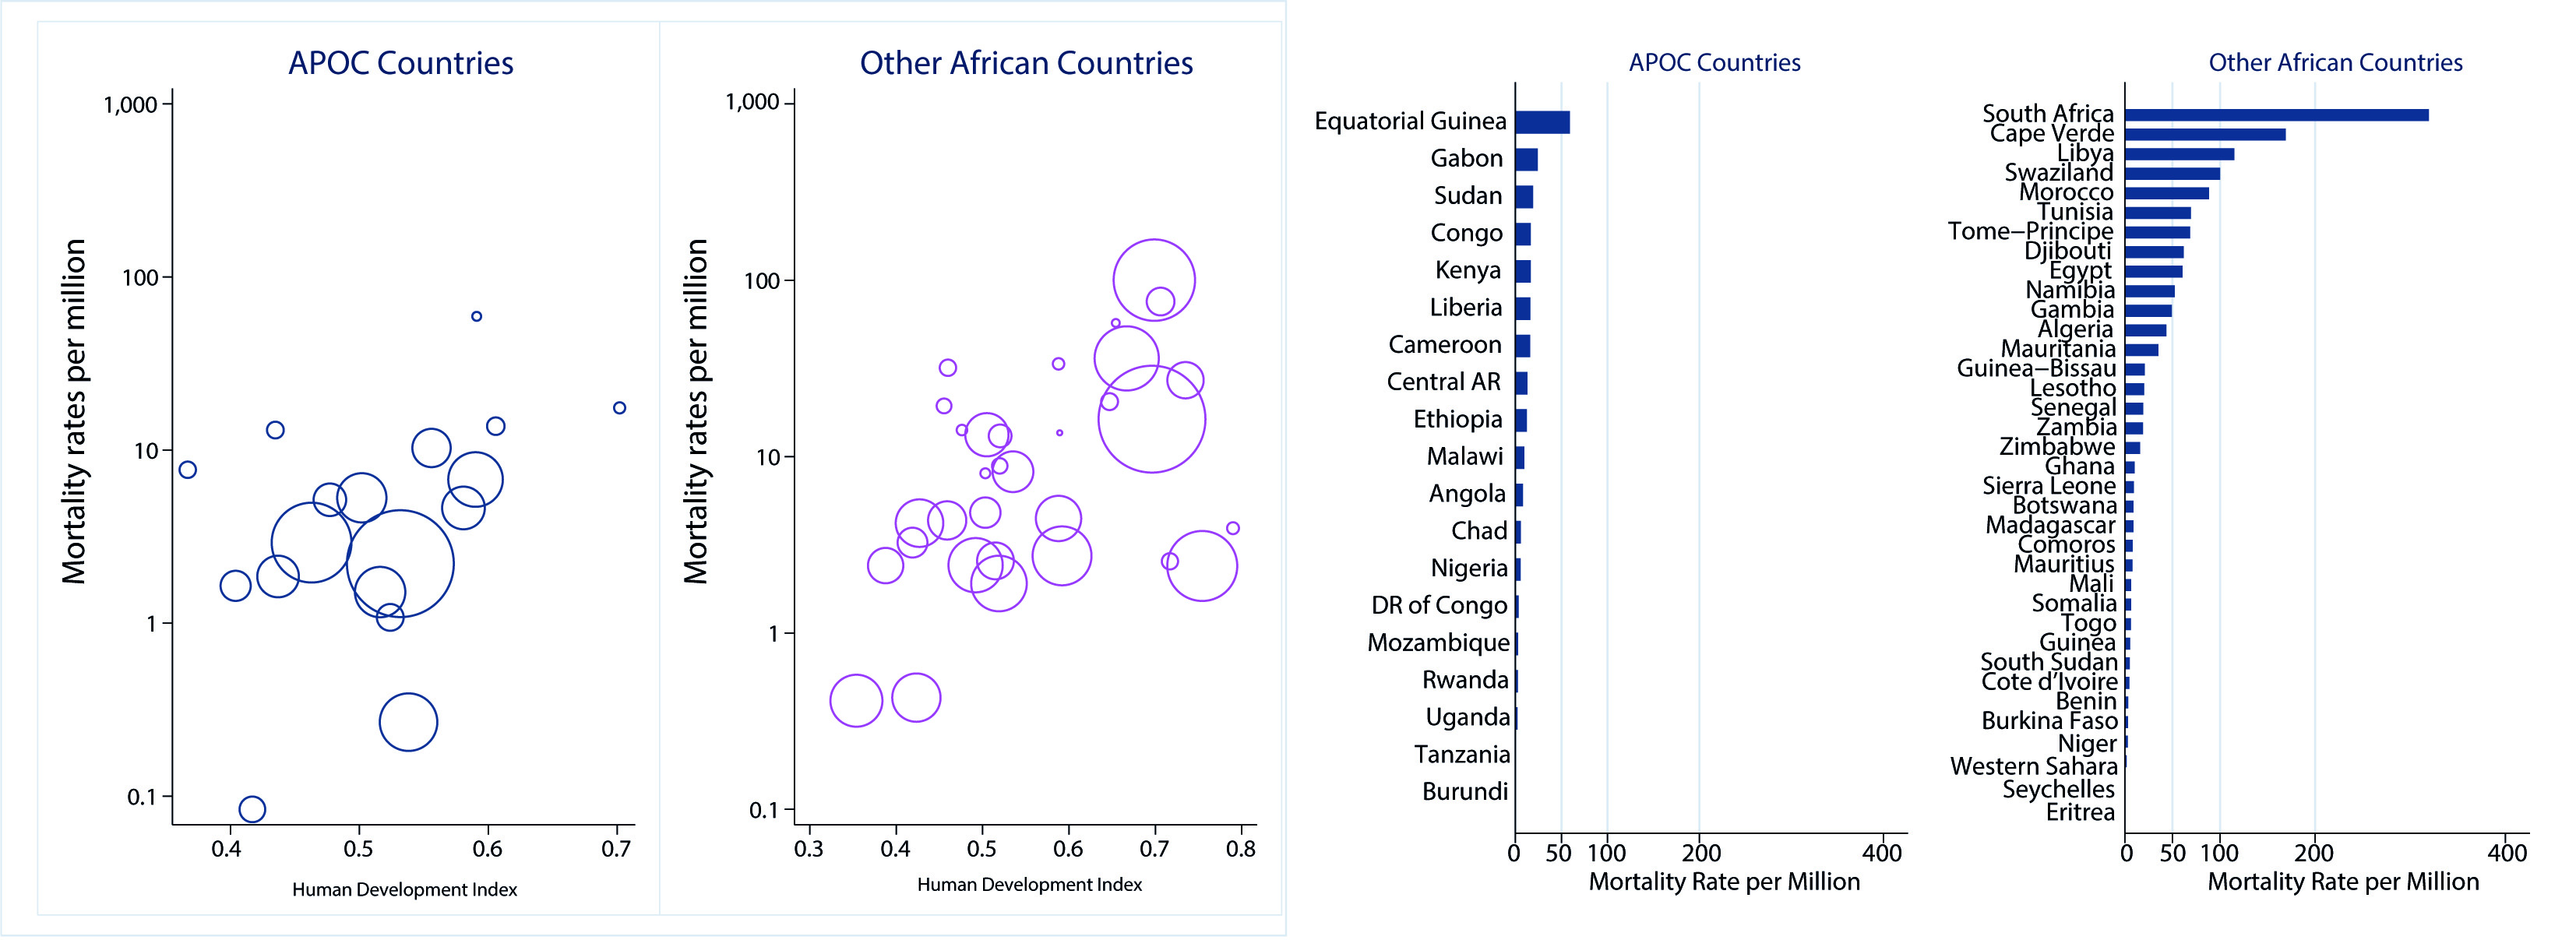
Figure 2 Cumulative Mortality Rate by Human Development Index in APOC compared with non-APOC countries. Scatterplot with weighted markers (Population)
South Africa, a non-APOC country and the most populated country in our dataset with 5 million inhabitants 5, contributed with largest number of cases and deaths. In South Africa, expected deaths and infections were 5.70 and 3.15 times higher (p <0.001) than the non-APOC countries. We included an indicator covariate for South Africa in all models.
After adjusting for the number of performed tests and HDI level, the expected number of COVID-19 deaths was lower 28% (RR= 0.72, 95% CI: 0.67-0.78) and of infections 8% (RR= 0.92, 95% CI: 0.91-0.93) in APOC countries (p <0.001). The number of deaths duplicated (RR= 2.39, 95% CI: 2.33-2.46) and number of infections increased 69% (RR= 1.69, 95% CI: 1.68-1.70) for each standard deviation above HDI mean. The apparent reduction in the death rate from Covid-19 in APOC countries (compared to non-APOC) was 3.5 more than the apparent reduction in the infection rate in the same countries when adjusting for the same covariates (Table 2).
Table 2 Results in the infection and mortality rates, expressed by the incidence rate ratios.
| Infection rate | Mortality rate | |||
|---|---|---|---|---|
| Predictors | Rate ratiosa | 95% CI | Rate ratiosa | 95% CI |
| APOC | 0.92 | 0.91-0.93 | 0.72 | 0.67-0.78 |
| HDI | 1.69 | 1.68-1.70 | 2.39 | 2.33-2.46 |
| Testing Rate | 2.49 | 2.48-2.50 | 1.91 | 1.83-2.00 |
| APOC x HDI | 0.51 | 0.51-0.52 | 0.47 | 0.43-0.50 |
| APOC x Testing Rate | 1.89 | 1.87-1.92 | 1.26 | 1.12-1.42 |
| HDI x Testing Rate | 0.73 | 0.73-0.74 | 0.69 | 0.67-0.71 |
a. All ratios were statistically significant (p <0.001)
* After sensitivity analysis, an indicator term was included in the model for South Africa (infection: RR= 2.90, 95% CI: 2.88-2.91, p <0.001; Mortality: RR= 4.13, 95% CI: 3.99-4.28, p <0.001) therefore the RRs are adjusted for this effect.
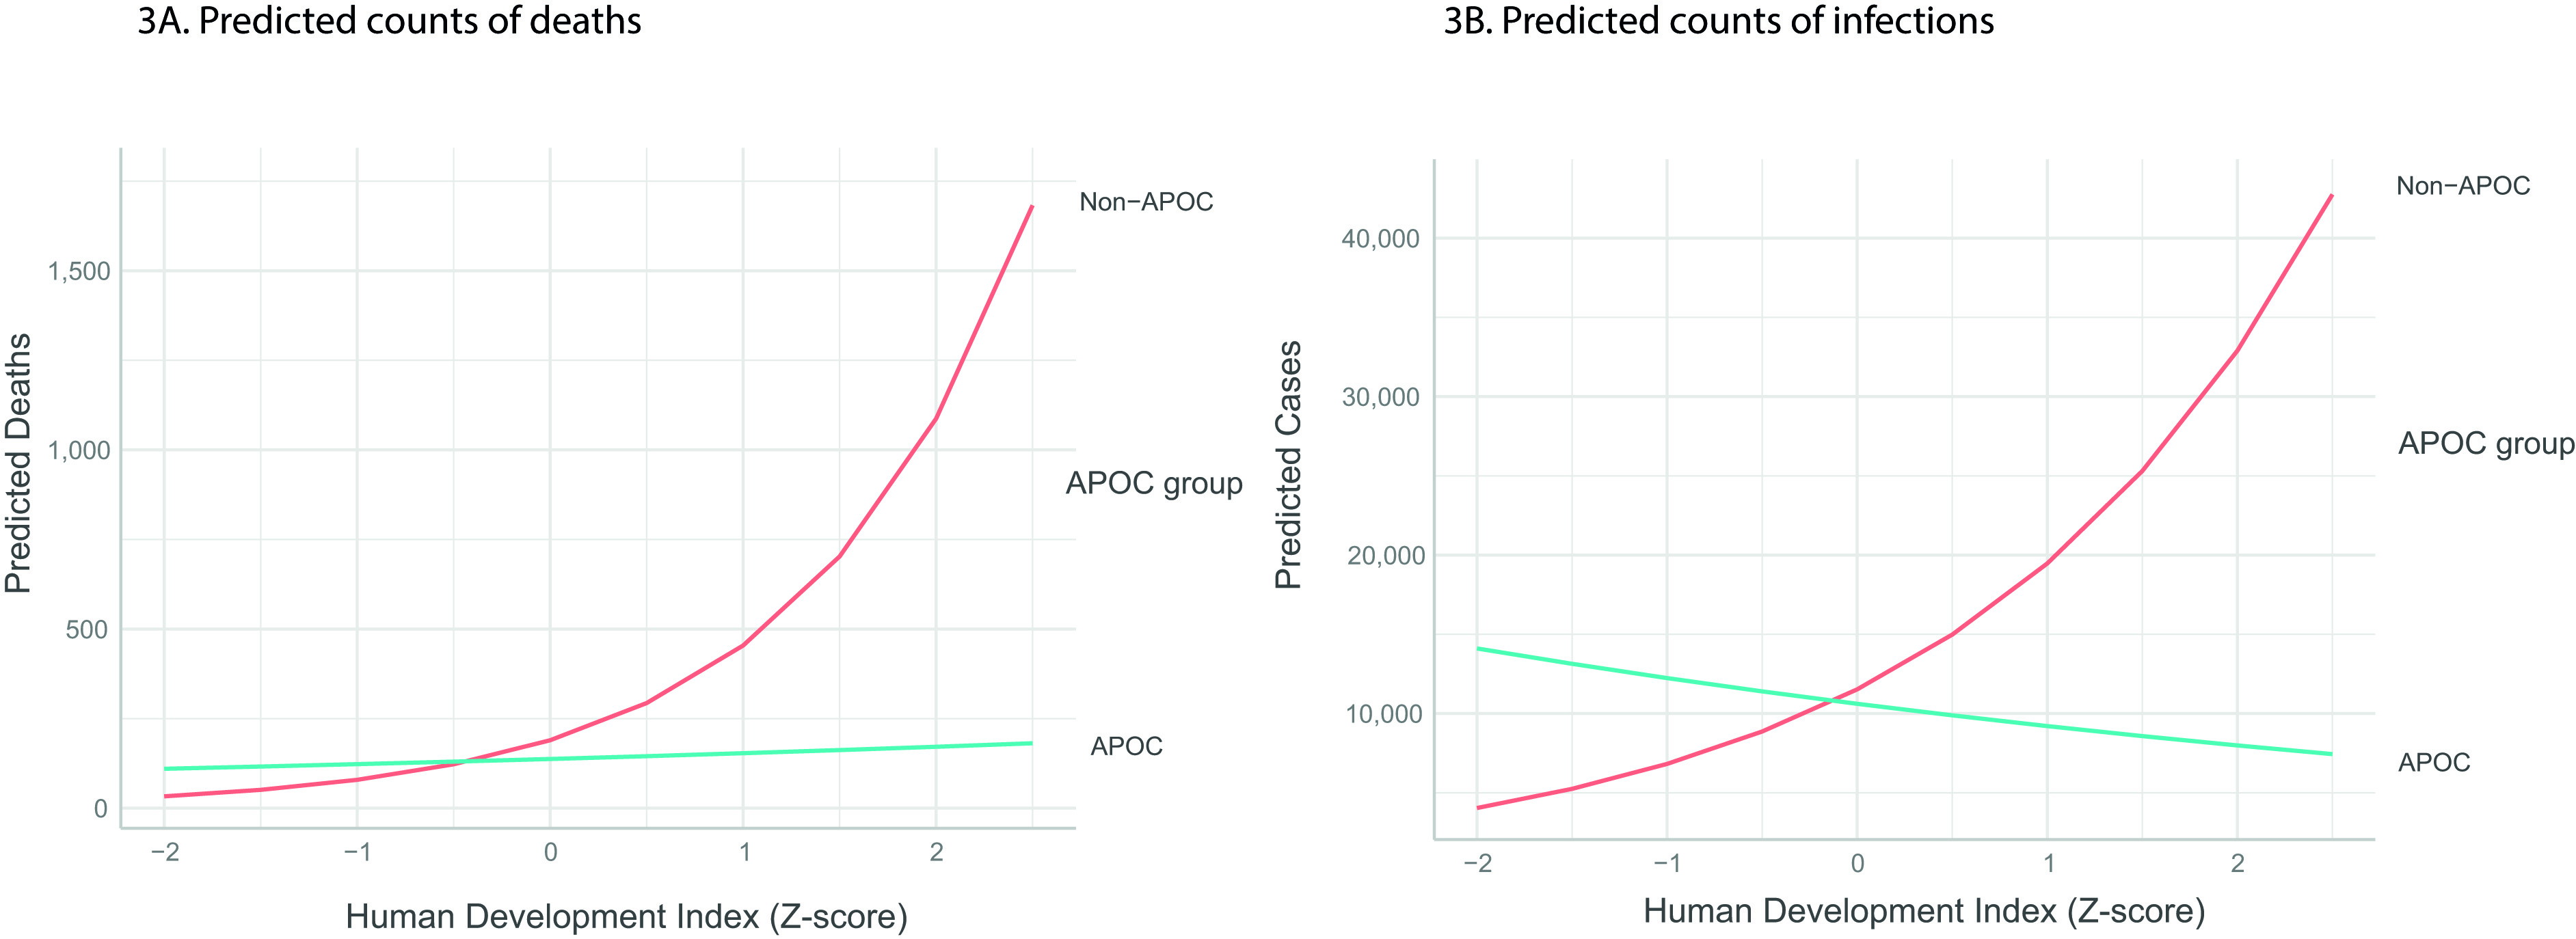
Death rates were directly associated with HDI in all African countries, while number of infections were inversely associated in APOC countries, that is the higher the HDI the lower the expected number of infections. In African regions with HDIs above Z-score means, the expected number of deaths and infections was lower in APOC countries. In contrast, in the regions with the lowest HDI Z-score (less than 0), the estimated number of deaths and infections was lower in the non-APOC countries compared to APOC countries (Supplementary Figure 1S).
Discussion
No country knows with certainty the total number of subjects infected by SARS-CoV-2 within its territory, only an approximate number provided by the people who are tested; then, the number of tests performed largely determines the count of confirmed cases of the disease. In developed countries the number of tests performed can reach larger proportions of the population, like Iceland that had almost half of its population tested, 483 per thousand people 7, however, on the African continent the tests performed per million inhabitants can be as low as in South Sudan 1,072 and Egypt 1,311 4.
Different quality of health services could be an explanation for the differences in infection (detection) of cases and of mortality. The WHO index for quality of health services varies from NA (no data available) to HIGH quality. Seven of the countries included in this study had reports accepted by the WHO, all of them were in the non APOC group, so underreporting could be the reason for the absence of cases and deaths 8,9. However, Mauritius and Seychelles (considered high and intermediate quality) reported 10 and 0 deaths respectively. While Egypt and Cabo Verde, classified as low or very low quality, reported a significant number of cases and deaths. Ethiopia and Nigeria, included in the NA category and belonging to the APOC group, reported a total of 1,396 and 1,127 deaths respectively. It seems unlikely that the quality of the reports can explain the observed differences.
A high HDI indicates longer life expectancy, better education and a higher standard of living. Our results coincide with others that show higher infections and death rates associated with high HDI 10,11. This can be explained because the component “life expectancy at birth is associated with a higher percentage of population >65 years. Our non-APOC group had a larger population in the >65 category and larger life expectancy (9 years) than the APOC group. That is why it is crucial to control for this confounding variable.
Mbow et al.12, analyzed the low morbi-mortality by COVID-19 in Africa compared to European countries and US, concluded that it is unlikely that it may be due to race, quality of reporting and death registration, different population age composition, lockdown stringency or other sociocultural aspects. Mbow mentions that studies of African COVID-19 patients show clear differences in the activation, proinflammatory and memory profiles of the immune cells compared not only versus Europeans but also among Africans with high and low exposure to microorganisms and parasites. Also suggest, that the virus may be spreading differently and with an attenuated outcome in Africa.
It is not known if a residual ivermectin effect increases the number of asymptomatic in the APOC countries. It is also unknown whether there are differences in susceptibility between populations of different African countries or regions.
The ivermectin is considered a drug of choice for various parasitic and viral diseases and shown to have in vitro effects against SARS-CoV-2 13-16. Although there have been suggestive clinical studies 17,18, and >50 trials are currently in progress worldwide 19. There is the need of good designed clinical trials to conclusively ascertain its benefits in humans.
The WHO Global Programme to Eliminate Lymphatic Filariasis (GPELF) has utilized ivermectin in association with albendazole in several Asian countries 20. In 2019, 1.2 million people in Haiti and Dominican Republic received ivermectin as part lymphatic filariasis preventive strategy. However, in an effort to reduce the risk of COVID-19 mass treatment campaigns were suspended, after an interim WHO guidance on April 1, 2020 21. It should be interesting to observe the evolution of infections and mortality in these countries.
A limitation of this study is that we analyzed cumulative rates up to a specific date. More detailed analyses should consider country effects (i.e., random intercepts) and time-varying covariates (e.g., testing rate) in a mixed Poisson model framework.
Overall, the reasons are not clear, yet present data suggests that a mass public health preventive campaign against COVID-19 may have taken place, inadvertently, in some African countries with massive community ivermectin use.