


 English (pdf)
 Article in xml format
 Article references
 Send this article by e-mail
 Cited by SciELO
  Cited by Google
  Similars in
SciELO
Similars in
SciELO  Similars in Google
 Permalink
INTRODUCTION
In astronomy, spectroscopy is a technique that studies the interaction between matter and electromagnetic radiation. The light that comes from celestial objects passes through a telescope and an instrument known as a spectrograph, whose function is to decompose the light into its spectral components and, utilizing a CCD sensor, store them as images [1]. Once the light is decomposed and stored, a stage known as spectrum reduction is carried out. In this stage, obtained images are processed and analyzed to provide information on celestial objects' chemical composition, molecular structure, and other physical characteristics. The echelle spectrograph is one of the most widely used since it offers advantages over others in high spectral resolution and greater dispersion capacity [2].
In An Echelle spectral reduction process includes following steps: CCD image pre-processing, localization of the spectral orders, spectra extraction, wavelength calibration, and spectral order fusion [3]. There are several tools and packages designed to optimize spectrum reduction. A notable tool is the Collection of Elemental Routines for Echelle Spectra (CERES), which allows the handling of different reduction steps, including calculating wavelength solutions and estimating radial velocity. CERES has been successfully used to design automated pipelines for multiple spectrographs, achieving high accuracy in radial velocity measurements [4]. HiFLEx [5] is another flexible, open-source package for high-resolution, cross-dispersal echelle data. It supports the determination of radial velocity using TERRA package and can interface with other radial velocity packages such as CERES [6]. Another relevant package is PyReduce, which introduces optimal extraction algorithms that consider the inclination or curvature of an image of the slit in the detector, thus increasing the signal-to-noise ratio and minimizing spectral resolution loss. This package also contains continuum normalization and order fusion algorithms, which are very effective for echelle spectrometers with various distortions [6].
Despite the existence of these solutions, most observatories manage their own set of routines according to [7], as is the case of the Alpha Orion research group of Universidad Tecnológica de Pereira Observatory (OAUTP) which conducts research in various areas of astronomy including spectroscopy, using specialized software such as Matlab, MIDAS and IRAF[8]. However, after the cessation of IRAF support in 2013 [9], the observatory saw a need to look for a Python-based solution, specifically with Astropy and PyReduce. Python was chosen because other processes at the observatory were already being developed in that programming language, and it was established as a specific OAUTP requirement. Also, the observatory faces the problem of a lack of integration and formalization in OAUTP's software solutions, affecting long-term scaling and maintenance. This paper proposes a software architecture for spectrum reduction using a unique standardized platform developed in Python programming language, which ensures its scalability and future maintainability, supported by its detailed architectural documentation.
1. METHODOLOGY
In the context of software development, according to software engineering principles, it is essential to follow an established order that includes stages of Analysis, Design, Development, Quality, and Deployment as indicated [10]. Following this structure, it is essential to highlight that it is necessary to fully understand reduction processes and an algorithm developed by [11] to obtain the best result. Therefore, the first step is to carry out a requirements analysis. This task will be done through interviews with key people from the Alfa Orion research group to carry out business process modeling. Furthermore, this coincides with an architectural vision of a design based on Kruchten's proposal [12]. The 4+1 model with some views allows the identification of a process that will be conducted. To do this, it was decided to model the processes using flow diagrams. This choice facilitates the discretization of the steps required in image processing, covering the needs in astrophysics and software engineering, thus aligning with the analysis stage in software development, as suggested [13].
Once these steps are clarified and organized, a design stage proceeds. Subsequently, logical and deployment views are defined, and key decisions are reflected in team development diagrams. It is crucial to be able to build logical and deployment views. They reflect the most significant number of decisions at a coding level, to define the quality attributes of architecture (such as scalability, modifiability, maintainability, interoperability, integrability, security, etc.) and design patterns that meet these attributes. This allows for a formal description of a solution by facilitating growth and maintenance over time. With a detailed process model and the design of a proposed solution, the development stage, quality tests, and application deployment are carried out.
2. RESULTS
Below are the detailed results for each development stage:
2.1 Analysis
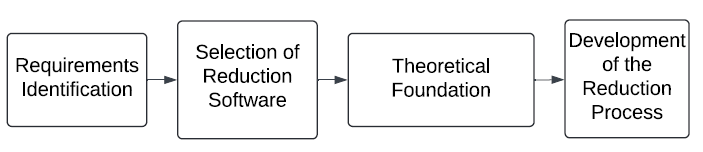
As mentioned in the methodology for this stage, Fig. 1 summarizes the steps followed in the analysis. It begins by identifying process-specific needs and software's requirements analyzing Alpha Orion equipment's spectral reduction procedure using IRAF. Key group members were interviewed, and IRAF manuals were examined to understand relevant functionalities.
In this step, it was possible to identify that in the reduction process, the images captured by the Echelle spectrograph are archived in FITS format. In addition, the images are divided into several categories, each with its specific purpose. Some are used for preprocessing, others are obtained by exposing the spectrograph to a Thorium-Argon (ThAr) lamp that is used to compare the spectrum, and the rest are the so-called scientific images or images of the stars. Moreover, by the research group's decision they decided that PyReduce would be the software used for spectrum reduction. Its theoretical foundation is described below:
Concerning what is described in [11], in preprocessing bias, images are used as a source of subtraction to minimize the bias of all other images. The flat is used to correct variations in CCD pixel sensitivity and a vignette effect, smudges, or shadows caused by dust and telescope optical aberrations. To identify the orders, [6] presents a procedure divided into three phases. First, the pixels that make up the orders are selected and grouped. These pixel groups are then merged or rejected. Finally, a polynomial is used to adjust, merge, or reject groups of truncated pixels. To group pixels that belong to an order, you go through the image from left to right and apply a smoothing filter to each column and apply the following criteria shown in equation (1):

Where μ is the arithmetic mean of the pixels in the direction of index y. Groupings that contain few pixels and belong to the first and last rows are rejected.
To decide whether a group of pixels is merged or rejected, [6] indicates that a polynomial fit of the pixels in y is necessary as a function of x. Then, index x is compared with the other orders, evaluating the existence of pixels in y, so that the different indices can identify truncations. In the reduction algorithm, the spectral and spatial decomposition of an order is an essential step, as described by [12]; the relative illumination profile of an order, which is perpendicular to Echelle scattering S, is derived from the product of spectrum f and spectral profile g, which in its discrete form is represented in equation (2):

Where w j x,y is a tensor that represents the weights and are non-zero for indices j that fall within a pixel of x,y sensor. Since g divides the pixel into a size grid M then w j x,y will be defined by equation (3):

Where j o is the index of the first subpixel that falls into the detector pixel Fraction which is the fraction of the first subpixel contained in the detector pixel.
At this point, the purpose is to break down each command  On the Spectrum
f
x
and a spectral profile g
j
solving the following optimization problem described in equation (4).
On the Spectrum
f
x
and a spectral profile g
j
solving the following optimization problem described in equation (4).
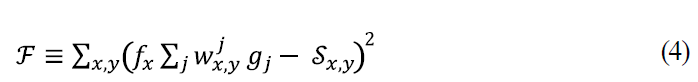
Piskunov [11] developed a form of extraction that involves adjusting the profile for each wavelength. On the other hand, the images of binary stars used were obtained at the San Pedro Mártir observatory (Mexico) in collaboration with Universidad de Guanajuato (Mexico), the University of Liege (Belgium), and Universidad Tecnológica de Pereira (Colombia). During this analysis phase, an issue was identified in the Alpha Orion group related to the manual management of numerous spectral files. This led to the implementation of an automatic metadata-based organization to improve efficiency. Consequently, obtained process models were a pre-processing flowsheet, a background detection diagram, and a lamp calibration flowchart.
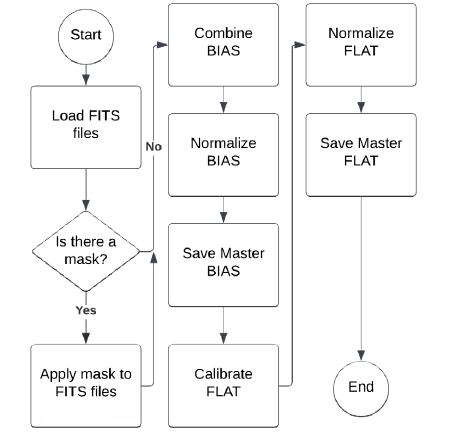
In Fig. 2, you can see the flow diagram of the first process that corresponds to the preprocessing of the images captured by a spectrograph:
Source: own elaboration.
Fig. 2 Preprocessing flowchart in which the images obtained by a spectrograph are preprocessed.
The necessary pre-processing steps for Echelle spectra are described below:
Check if masks are available for BIAS files.
Apply masks if available for BIAS files.
BIAS files are combined, typically using the median, to create a Master BIAS.
The BIAS Master is standardized to standardize its values.
Finally, the standardized BIAS Master is saved for later use.
Similar to BIAS, a mask is checked and applied if available.
The FLAT files are merged, and the median creates a Master FLAT.
Master FLAT is normalized to ensure uniform correction.
Normalized Master FLAT is saved.
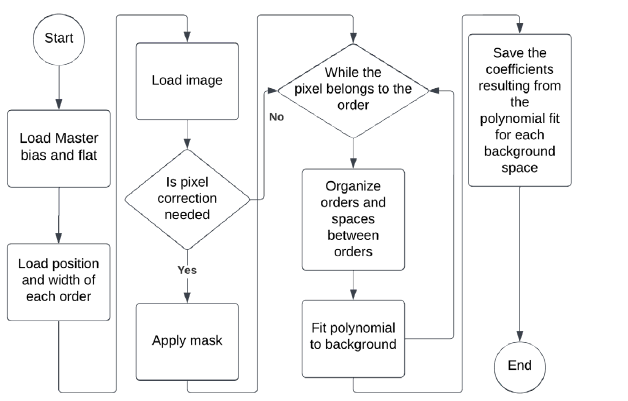
Fig. 3 represents spectrum detection and ordering. The flow develops as follows:
The process starts loading previously calibrated images, including the master bias and the master flat.
Apply masks to fix bad pixels, if they exist.
A threshold is set to distinguish the background and spectral signals.
A peak search is conducted to identify potential spectral orders.
Pixels that exceed the threshold are grouped into clusters. A minimum size criterion is applied to filter out insignificant clusters.
Each valid cluster is fitted to a polynomial to represent the shape of the spectral order. This step simplifies the representation of orders and helps correct truncated orders.
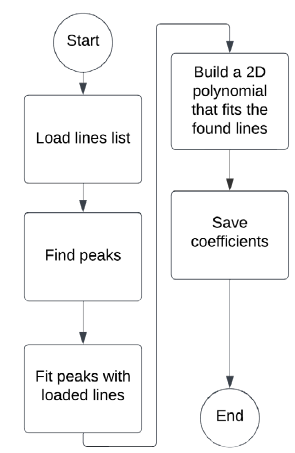
The ThAr lamp wavelength calibration process, illustrated in Fig. 4, is as follows:
Start loading preset lines or atlases.
Identify peaks in the image, correlating them with known lines.
Make a polynomial fit to these lines.
Save coefficients in a file.
Finally, this analysis managed to create a clear workflow for spectrum reduction, focused on Alfa Orion group's requirements and the use of PyReduce software. Specific needs were confirmed, such as categorizing images according to their use in preprocessing, spectra detection, and ordering, and wavelength calibration with the ThAr lamp. Creating flowcharts makes visualizing each step of the process easier. In addition, a problem of manual file management was discovered and solved by implementing an automatic metadata-based organization.
2.2 Design
Considering the ISO 25010 standard [14], which defines a set of suggestions for architectural designs, the following quality attributes necessary to meet the functional and non-functional needs exposed by the analysis are identified. Results may be seen in Table 1. These attributes correspond to operational needs that guarantee various elements that will keep a system functional and capable of responding to the research group's diverse needs. Likewise, they guarantee they can take the code as a basis for their development due to their ability to modify it.
According to the information identified in the analysis, the architecture is approached from a point of view of processes through collaboration diagrams, which allow a simplified graphic representation of what was mentioned in the previous stage. Here, the objective is to identify a succession of steps required for certain functionalities, making it more comprehensible.
This identified information leads to implementing an architecture with several layers (multilayer), each with specific responsibilities that guarantee low coupling and high cohesion of its components. For this reason, and in response to the quality attributes mentioned above, the solution implements an MVC (Model View Controller) design pattern that divides the solution into three main layers: model (data management), view (user interface), and controller (intermediate between model and view) explicitly, facilitating its independent development and maintenance. Additionally, an additional layer of integrations is created to use external packages or APIs.
This makes it possible to model a package and a component diagram to determine the high level solution from a logical view, and then, with a package view, define the detail required for implementation.
Table 1 Application attributes table. Source: Authors’ own elaboration.
| Attribute | Definition | Design Pattern | Where it is implemented |
|---|---|---|---|
| Scalability | Keeping the software operational over time. Even including chan- ges, improvements, integration, or growth [14]. | Multilayer MVC | Software layers of code. |
| Modifiability | Updating and improving software efficiently by incorporating new features and technologies, improving interfaces, complying with standards, and minimizing errors and performance degradation [14] | Multilayer MVC | Software layers of code. |
| Maintainability | Ensuring that the software works optimally, making it easier to understand and allowing various developers to intervene effecti- vely over time [14] | Multilayer MVC | Software layers of code. |
| Functionality | Focusing software functionality on its ability to meet specific ne- eds, including adequacy, accuracy, interoperability, security, and standards compliance [14] | Multilayer MVC | Software layers of code. |
| Portability | Being easy to move and adapt to operate in different environ- ments or platforms [14] | Multilayer MVC | Software layers of code. |
Source: own elaboration.
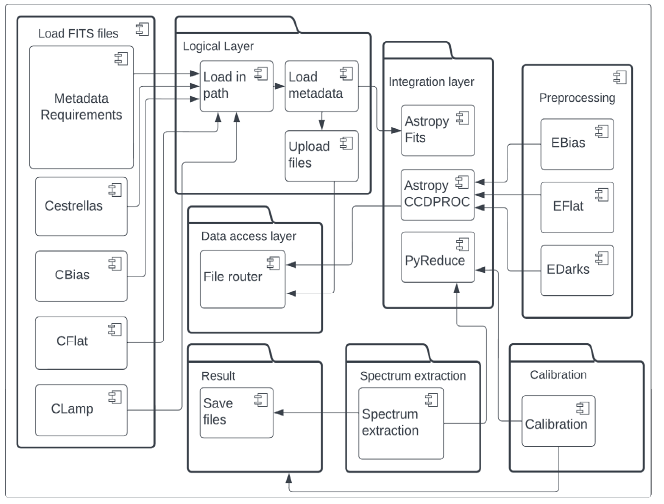
The package diagram in Fig. shows different layers that facilitate FITS file management in an image-processing environment for Echelle spectral reduction. The most basic layer, the FITS file component, is responsible for initial operations such as uploading files and acting as the entry point for raw data. This connects to the logical layer, which implements image loading according to a specified path and metadata management. In turn, a logic layer interacts with a data access layer. This process is responsible for reordering the files according to their specific function, such as bias images, flats, and star or lamp images. It saves the images product of intermediate processes of the integration layer in libraries such as AstroPy, which in conjunction with PyReduce, play a role in pre-processing, spectrum extraction, and calibration, culminating in the production of data ready for analysis and to generate final results.
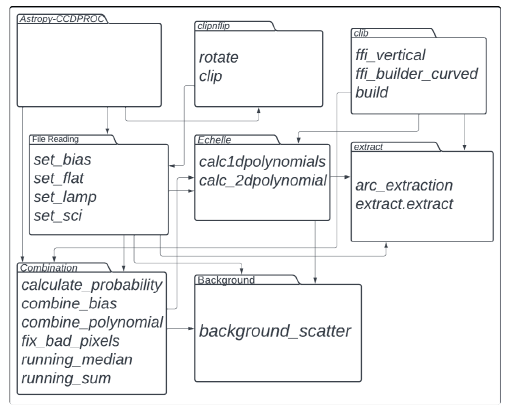
This view describes astronomical image processing using Astropy and PyReduce packages. Astropy-CCDPROC handles initial data preparation, establishing files for bias, flat, lamp, and science. A combine frames feature combines and fixes images, including removing bad pixels. The Echelle module calculates polynomials for spectral adjustment. In addition, image rotation and cropping processes are included, and the calibration library (climb) builds a reference for calibration. Moreover, an extract module performs arc and spectra extraction, completing processing workflow. In this instance, the application moves on to a phase to validate the results of astronomers' spectrum reduction.
With the above, it is possible to unify the development team's vision and lay the foundations for correct software development that is reflected in the logical view detailed below in Fig. 6:
The logical view presents the Echelle spectral reduction process at the observatory using Astropy and PyReduce libraries. It is organized into layers, each with specific responsibilities. The FITS layer handles initial operations like loading FITS files, acting as the entry point for raw data. The logical layer manages image loading and metadata handling, interacting with the data access layer, and reorganizes files based on their function (bias, flats, star, or lamp images). The integration layer utilizes Astropy and PyReduce for preprocessing, spectrum extraction, and calibration, producing analysis ready data. This structure follows an MVC (Model View Controller) design pattern to ensure low coupling and high cohesion, facilitating independent development and maintenance.
2.3 Development
After defining the required processes and designing a solution, project modules were integrated and implemented according to a PEP 8 standard, using Visual Studio Code as an editor. Python 3 was used to develop the layers described in the logical view, relying on the Astropy and PyReduce libraries.
The development was divided into pre-processing, background detection, and lamp calibration.
2.4 Quality
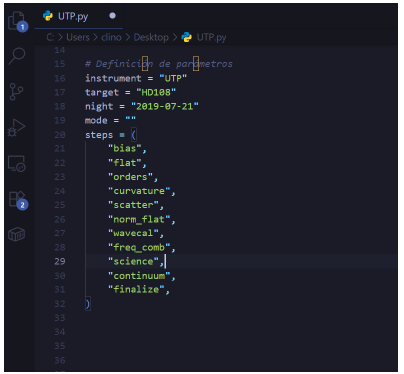
Tests are organized into four phases, using images of HD108, HD12560 and HD194649 stars. The bias and flat are processed in the first phase, and the results are used to process all the other images. The second phase involves distinguishing orders using a clear image. The validation of this phase was carried out qualitatively with an astronomer's help. In the third phase, lamp images are used to obtain a spectral profile, which is used to process all the stars. Through this information, PyReduce can calculate the background and normalize the flat. Finally, in the fourth phase, the results derived from obtaining each star's spectrum are presented. With these diagrams, the solution was implemented in Python using the PyReduce and Astropy libraries. In Fig. 7, you can see the UTP.py script that Pyreduce uses to obtain spectrum. The steps are defined for an application to execute processes.
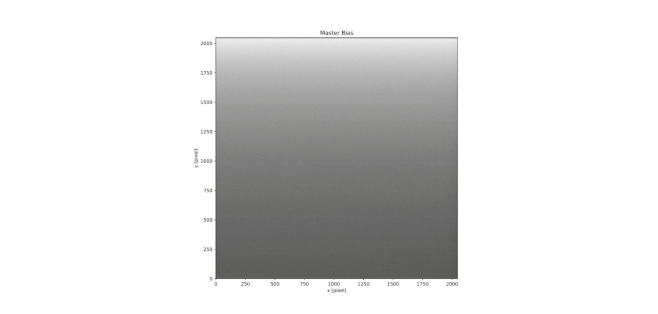
In Fig. 8, results can be seen after combining the images arranged to obtain the bias. Average was used as a combination procedure. The darker colors represent values close to zero.
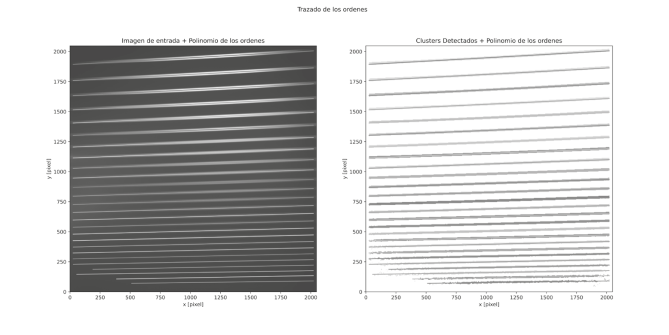
Piskunov's algorithm for identifying astronomical orders requires adjusting four parameters: degree of the polynomial, size of the Gauss filter to smooth columns, minimum number of pixels to form a cluster, and background noise.
After experimenting with these values, a cluster size of2000 pixels was determined. When the degree of the polynomial varied between 3 and 5, no significant changes were observed beyond these values, although excessive magnification tends to curve the beginning of the order. The optimal Gauss filter size was 20, as more considerable smoothing removed too many pixels from the order. As for background noise, a value of 0.5 was the most effective in preventing overlapping orders in areas of low pixel intensity. Fig. 9 shows the final result of the detection, where 32 orders are identified.
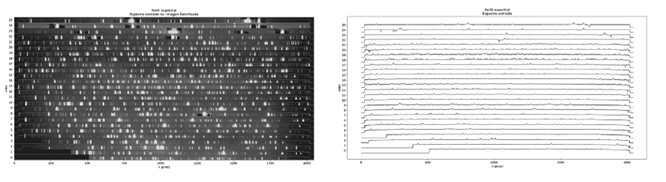
The spectral profile was based on an image of ThAr's lamp. This algorithm varies the parameters like peak, extraction, and degree of the polynomial. We started by varying the extraction's width, finding that with a value equal to 20, it can detect emissions in more detail. As for peak width, it was decided to leave it at 1 since, with that value, more details were seen in the emissions. The value of the polynomial was left at 3, and when it varied to 5, no change was noticed. In Fig. 10, the spectral profile is superimposed on a rectified THAr lamp image. For the extraction of a spectrum of stars, the routine depends on the number of iterations, so as the iterations were increased, calculation time increased. Finally, in the same figure, you can see HD108 star's spectrum extracted in pixels.
3. DISCUSSION
A structured methodology was followed to implement a new Python architecture for Echelle spectrum processing at OAUTP. Each stage was crucial to address IRAF software obsolescence and establish a scalable platform for the observatory.
Analysis: The requirements to replace IRAF were identified through engagement with key stakeholders, particularly the Alpha Orion group. A Python-based solution was chosen due to its existing expertise and better integration with existing workflows. The analysis also identified limitations in manual file management, leading to the need for an automated, metadata-based organization.
Design: The design phase focused on a scalable architecture using a MVC (Model-View-Controller) design pattern to ensure modularity, low coupling, and easy maintenance. Architectural views, encompassing logical, deployment, and component diagrams, provided a blueprint for the development process.
Development: The architecture was implemented using Python, relying on Astropy and PyReduce libraries. Following PEP 8 standard ensured clean, maintainable code. the Modular approach allowed development and integration, divided into background detection and lamp calibration.
Quality: Quality assurance was performed in four phases: preprocessing, order detection, wavelength calibration, and spectrum extraction. Validation with astronomy experts confirmed architecture reliability and accuracy.
Deployment: Deployment on OAUTP servers ensured the system was fully operational and integrated within the observatory's infrastructure, transitioning effectively from the legacy IRAF system.
Impact: The structured methodology resulted in an immediate reliable future-proof solution. The architecture is flexible enough to use AI techniques in the future to improve accuracy in spectral detection and classification. This will keep astronomical research at the observatory going.
The additional improvements gained from this implementation suggest the architecture's potential for future expansions. Although artificial intelligence techniques have not been incorporated in this initial stage, the possibility of integrating them in future versions to further optimize the accuracy in detecting and classifying spectra is recognized. The decision not to implement artificial intelligence in this phase was based on a need for an immediate reliable solution compatible with available resources and ensuring similar results to traditional methods. However, the architecture conceived is flexible enough to allow the incorporation of advanced techniques in the future, reinforcing its long-term value.
4. CONCLUSSIONS
The creation and implementation of a new Python software architecture for processing Echelle spectra in the OAUTP has proven to be an effective solution to overcome the constraints caused by IRAF obsolescence. This development replaces previous software successfully and establishes a scalable maintainable foundation for future operations, ensuring the sustainability and continuity of astronomical data processing at the observatory, not only in spectroscopy.
The new software, based on tools such as Astropy and PyReduce, has automated and optimized critical processes, reducing the reliance on manual management and significantly improving operational efficiency. Standardization enables greater team collaboration and ensures that future system modifications or expansions are executed without compromising data integrity or system stability.
Although artificial intelligence (AI) techniques have not been incorporated at this early stage, the designed architecture offers the flexibility to incorporate these technologies in the future. A strategic decision was made to prioritize an immediate reliable solution that meets current requirements, enabling continuous technological evolution.

