


 English (pdf)
 Article in xml format
 Article references
 Send this article by e-mail
 Cited by SciELO
  Cited by Google
  Similars in
SciELO
Similars in
SciELO  Similars in Google
 Permalink
Post-traumatic stress disorder (PTSD) may be caused after a person has experienced or witnessed a traumatic event, such as violence, natural disasters, accidents, or combat. PTSD is characterized by symptoms including intrusive and distressing memories of the trauma, avoidance of triggers associated with the event, negative changes in mood and cognition, and increased reactivity and arousal (American Psychiatric Association, 2013). According to the World Mental Health Surveys, approximately 1.5 % of people in Mexico experience PTSD at some point in their lives (Koenen et al., 2017). A mental health professional can diagnose PTSD based on the presence of specific symptoms persisting for at least one month, causing significant distress or impairment in functioning (American Psychiatric Association, 2013). Various screening tools, such as the PTSD Checklist for DSM-5 (PCL-5), can be used for this purpose (Blevins et al., 2015).
Some data suggest that the factor structure of the PCL-5 may not match the four PTSD symptom clusters proposed by the DSM-5. Notably, several studies have found support for either the six-factor “anhedonia model” (Bovin et al., 2016; Durón-Figueroa et al., 2019) or the seven-factor “hybrid model” (Armour et al., 2015; Di Tella et al., 2022; Lee et al., 2019; Seligowski & Orcutt, 2016; Wang et al., 2015). Furthermore, a recent systematic review suggests that the latter (the hybrid model) has the most substantial evidence available to date (Forkus et al., 2023).
According to this model, PTSD symptomatology is structured into seven dimensions: (a) re-experiencing (intrusive thoughts, memories or nightmares related to the traumatic event), (b) avoidance (efforts to avoid trauma-related stimuli), (c) negative affect (feelings of fear, guilt, shame or sadness related to the traumatic event), (d) anhedonia (decreased interest or participation in pleasurable activities), (e) externalizing behaviors (reckless, impulsive or self-destructive behaviors), (f) anxious arousal (hypervigilance, exaggerated startle response), and (g) dysphoric arousal (difficulty concentrating, sleep disturbances). Furthermore, it has also been pointed out that, beyond specific symptom groupings, the PCL-5 primarily measures a general PTSD factor (Byllesby & Palmieri, 2023; Fresno et al., 2020; Jenkins-Guarnieri et al., 2023; Schmitt et al., 2018). Thus, rather than obtaining separate scores for each dimension, the main interest is in an overall symptomatology score.
Despite the usefulness of the PCL-5 (e.g., Ahmadi et al., 2023), its length (comprising 20 items) may limit its application in long and/or repeated-measures questionnaires. Consequently, various shorter versions have been proposed in the literature. On the one hand, Price et al. (2016) developed two short versions of the PCL-5, a 4-item and an 8-item version. These short versions have exhibited robust psychometric properties across different countries and settings, including clinical and community samples with trauma history in Brazil (Pereira-Lima et al., 2019), civilians with traumatic injuries in the United States (Geier et al., 2020), and a predominantly clinical sample of adults who suffered the 2017 earthquake in Mexico (Martínez-Levy et al., 2021).
In the latter study, reliability was adequate for both the 4-item version (α = .81) and the 8-item version (α = .91). On the other hand, Zuromski et al. (2019) also developed a 4-item version of the PCL-5, but it shares only one item with Price et al. (2016) version. This discrepancy may stem from the fact that Zuromski et al. (2019) used different methods (including both machine learning and more conventional techniques) to develop a scale that better predicted dichotomous PTSD diagnoses. Another potential explanation is that, while Price et al. (2016) employed both MTurk and veteran samples, Zuromski et al. (2019) exclusively developed their scale on data from military personnel.
The current abbreviated versions of the PCL-5 have significant limitations. Firstly, they do not cover all seven areas outlined in the hybrid model, which is considered the best model for describing the structure of the PCL-5 (Forkus et al., 2023). Secondly, these short versions have not been tested with advanced techniques such as confirmatory factor analysis and item response theory models. In fact, some widely used short versions were developed using traditional methods (e.g., itemtest correlations) without explicitly testing dimensionality (Price et al., 2016). Lastly, existing short versions have not considered bifactor models; which offer both a global dimension of PTSD and coverage of the seven specific dimensions of the hybrid model (Di Tella et al., 2022). Thus, there is a need for a brief version of the PCL-5 that adequately covers all seven dimensions of PTSD and provides a global score.
Based on the above, the objectives of this study were: (a) to create a new short version of the PCL-5 using an iterative approach that involved an exploratory bifactor analysis and a series of confirmatory factor analyses; (b) to test the new version and compare it to previously proposed versions using confirmatory factor analysis; (c) to determine whether the measure is consistent between men and women; (d) to examine how the items function using a graded response model; and (e) to evaluate how the scores of the different versions relate to other relevant variables.
Method
Participants
Initially, data were collected from 1.337 individuals, who responded to the following open-ended question: “Sometimes people experience very difficult situations that generate a high degree of stress. What stressful or threatening event have you experienced at some point in your life that continues to generate emotional discomfort? If you remember more than one, try to focus on the one that generates the most emotional discomfort.” Subsequently, traumatic events were coded into 7 categories: sexual violence, death, physical violence, illness, family problems and separation, other, and non-traumatic event. The “other” category encompassed events that could not be classified within the previous 5 categories, while the “non-traumatic event” category included responses that could not be considered traumatic events. The coding process was performed independently by two assistants. Following this initial coding, two authors (AHP and PDV) reviewed discrepancies in category assignments and reached a consensus on the appropriate categorization.
After the coding process described above, 198 cases were excluded due to either their descriptions not aligning with the characteristics of a traumatic event or insufficient information provided. Consequently, the final sample consisted of 1139 individuals (83.8 % female) with ages ranging from 18 to 76 years (M = 31.74, SD = 10.03). The majority (52.7 %) were single, followed by 32.7 % who were married or cohabiting, 10.4% separated or divorced, 1.8 % widowed, and 2.4 % who indicated their marital status as “other”. The majority (72.1 %) had attained higher education.
Geographically, the most represented states of the country were the State of Mexico (33.1 %) and Mexico City (31.2 %). Regarding the traumatic events experienced, the distribution was as follows: direct sexual violence (9.1 %), death (18.8 %), direct or indirect physical violence (8.9 %), direct or indirect illness (12.7 %), family problems or separation (32.1 %), and other (18.3 %). The majority of participants (58.3 %) had experienced the traumatic event more than one year ago, followed by those who had experienced it between three months and one year before the assessment (19.1 %), one month or less ago (12.4 %), and between one and three months ago (10.3 %).
Measures
The PCL-5 (Weathers et al., 2013) is a self-report measure that assesses PTSD symptoms following the DSM-5 criteria. Comprising 20 items, each rated on a 5-point Likert scale from 0 (not at all) to 4 (extremely). Higher scores on the PCL-5 indicate greater severity of PTSD symptoms experienced in the past month. The PCL-5 demonstrates good psychometric properties, including high internal consistency and test-retest reliability (Blevins et al., 2015). For the present study, the Mexican adaptation was used (Durón-Figueroa et al., 2019).
The Beck Depression Inventory II (BDI-II; Beck et al., 1996) is a widely employed self-report measure designed to assess the presence and severity of depressive symptoms. Consisting of 21 items, each scored on a 4-point Likert scale, with response options ranging from 0 to 3. For the present study, we used the version adapted for Mexico (González et al., 2015). Internal consistency reliability in our data was good (α = .91).
The Beck Anxiety Inventory (BAI; Beck et al., 1988) comprises 21 items, each scored on a 4-point Likert scale, with response options ranging from 0 to 3. The BAI exhibits good psychometric properties, including high internal consistency, test-retest reliability, and concurrent validity with other anxiety measures. Moreover, it has shown good psychometric properties when tested in a Mexican population (Padrós-Blázquez et al., 2020; Robles et al., 2001). Reliability in the present study was adequate (α = .92).
The Penn State Worry Questionnaire (PSWQ-11; Meyer et al., 1990) is a self-report measure designed to assess pathological worry. Comprising 11 items, each scored on a 5-point Likert scale, with response options ranging from 0 to 4. In this study, we used a Mexican adaptation of the PSWQ-11, which had previously demonstrated good psychometric properties (Padrós-Blázquez et al., 2018). Internal consistency reliability in our data was adequate (α = .94).
Procedure and Ethical Considerations
The data were collected as part of a clinical trial designed to assess two psychotherapeutic interventions using videoconferencing (De La Rosa-Gómez et al., 2023). Prospective participants completed baseline questionnaires on SurveyMonkey, which were used to determine their inclusion in the trial. The data derived from these initial questionnaires were used in the present study. Participants gave informed consent before completing the questionnaires. Furthermore, the project received approval from the Ethics Committee of the Facultad de Estudios Superiores Iztacala of the Universidad Nacional Autónoma de México.
Data Analysis
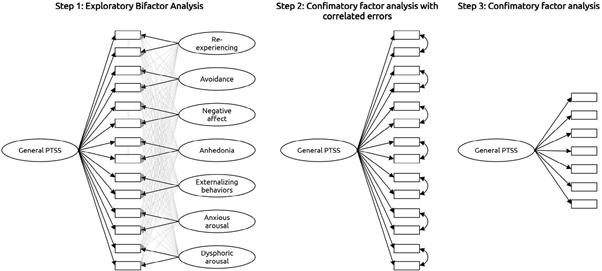
The development of the new version involved two stages; an exploratory phase followed by a confirmatory. In the exploratory stage, we started with a bifactor unrestricted model, which included seven specific dimensions (mirroring the hybrid model), and a general factor. A Direct Schmid-Leiman approach was implemented, as recommended by the specialized literature (Giordano & Waller, 2020; Waller, 2018). In each specific dimension, two items were chosen with the highest factor loadings in the general factor. These 14 selected items were then modeled in a unidimensional CFA that also included correlated residuals between each pair of items from the original dimensions (resulting in a total of 7 correlations). Finally, one item was chosen from each pair, based on either the size of its loading or on the researchers’ criteria. The steps of the exploratory stage are visually illustrated in Figure 1.
In the confirmatory stage, a new version was tested in a different set of participants, alongside other short versions previously proposed by other researchers. Confirmatory factor analysis using the MLR estimator, known for its robustness to non-normality, was employed. It should be noted that MLR maintains robustness even when the response options are categorical and equal to or greater than five, as is the case here (Rhemtulla et al., 2012). Model fit was evaluated with approximate indices including the comparative fit index (CFI), Tucker-Lewis index (TLI), root-meansquare error of approximation (RMSEA), and standardized root-mean-square residual (SRMR). The following values were considered evidence of good fit: CFI > .95, TLI > .95, RMSEA < .06, SRMR < .08 (Hu & Bentler, 1999; Schermelleh-Engel et al., 2003). For models exhibiting an acceptable fit, reliability was estimated with both coefficient omega and Cronbach’s alpha.
Next, measurement invariance between sexes was examined. A chi-square difference (∆χ²) test was complemented with an examination of the change of CFI (∆CFI), according to which a worsening of CFI larger than .01 would indicate a lack of in variance. Given the notable difference in size be tween groups (the women-to-men ratio was 5:1), the subsampling procedure proposed by Yoon and Lai (2018) was used.
To examine the performance of the short version at the item level, a graded response model was estimated. This is a two-parameter item response theory model designed for polytomous items, which estimates one discrimination parameter (represented as a), as well as k-1 difficulty parameters (represented as b), where k is the number of response options (in this case, five). Both sets of parameters also allow for modeling information functions, which show how reliable or informative each item is at different levels of the construct under study.
The association between the brief PCL-5 and related variables (depression, anxiety, and worry) was examined with Pearson correlations. Additionally, the correlation between the long and brief PCL-5 was also calculated, with a correction for spurious correlation (r′) (Levy, 1967). All analyses were performed using R (version 4.0.3). For the confirmatory factor analyses, the lavaan package (version 0.6-11) was used; for reliability and measurement invariance, semTools (version 0.5-3); and for the graded response model, the mirt package (version 1.33.2).
Results
Development of a New Short Version
An exploratory bifactor analysis identified 7 pairs of items, each representing a dimension of the hybrid model: re-experiencing (4 and 5), avoidance (6 and 7), negative affect (9 and 11), anhedonia (12 and 14), externalizing behaviors (15 and 16), anxious arousal (17 and 18), and dysphoric arousal (19 and 20). These 14 items were subsequently modeled with a unifactorial CFA, which also included residual correlations between each pair of items. Within this new model, one item was selected from each pair. For the anhedonia dimension, item 12 was chosen based on a rational (not quantitative) criterion, since loss of interest (rather than restricted affect) was considered to constitute the central element of anhedonia (Price et al., 2014).
In all other dimensions, items were selected based on the size of their factor loadings. Thus, a total of 7 items were selected for our brief version: questions 4, 7, 11, 12, 15, 18 and 19 (Figure 1). All analyses described in this section were performed on a randomly selected half of the total sample (n = 570). Detailed quantitative information regarding these analyses can be found in Supplementary Material 1.
Table 1. Fit indices of four short versions of the PCL-5
| Model | χ² | df | p | CFI | TLI | RMSEA | SRMR | α | ω |
|---|---|---|---|---|---|---|---|---|---|
| 1. Our 7-item version | 71.50 | 14 | < .001 | .94 | .91 | .09 | .04 | .83 | .83 |
| 2. Price et al. (2014)-8 items | 162.45 | 20 | < .001 | .88 | .83 | .11 | .06 | - | - |
| 3. Price et al. (2014)-4 items | 7.82 | 2 | .020 | .98 | .95 | .07 | .02 | .73 | .73 |
| 4. Zuromski et al. (2019)-4 items | 43.41 | 2 | < .001 | .83 | .48 | .19 | .05 | - | - |
Note. Confirmatory factor analysis with a robust maximum likelihood estimator (MLR) was used. CFI = comparative fit index; TLI = Tucker-Lewis index; RMSEA = Root-Mean-Square Error of Approximation; SRMR = Standardized Root-Mean-Square Residual.
Confirmatory Factor Analysis and Internal Consistency Reliability
In the second random half of the sample (n = 569), our brief version was tested, along with others previously proposed by other authors. As shown in Table 1, only our 7-item proposal and the 4-item version developed by Price et al. (2016) showed an acceptable fit, as well as adequate internal consistency reliability. On the other hand, the 8-item version of Price et al. (2016) and the version of Zuromski et al. (2019) showed unacceptable fit indices. Therefore, their reliability was not estimated. The factor loadings for the models with adequate fit can be found in Supplementary Material 1.
Factorial Invariance
As indicated in Table 2, our 7-item version demonstrated measurement invariance at all levels (factor loadings, intercepts, and residuals). Therefore, no significant differences were observed at the level of the latent means. Comparable results were identified in the 4-item version of Price et al. (2016).
Table 2 Measurement Invariance (by Sex) of Two Short Versions of the PCL-5
| Model | χ² | df | p | CFI | Compared | Δχ² | Δdf | p | ΔCFI |
|---|---|---|---|---|---|---|---|---|---|
| Our 7 -item version | |||||||||
| 1. Configural | 71.79 | 28 | < .001 | .93 | |||||
| 2. Metric | 78.18 | 34 | < .001 | .93 | Model 1 | 3.56 | 6 | .736 | 0.00 |
| 3. Scalar | 89.91 | 40 | < .001 | .92 | Model 2 | 11.39 | 6 | .077 | -0.01 |
| 4. Strict | 97.73 | 47 | < .001 | .92 | Model 3 | 6.48 | 7 | .485 | 0.00 |
| 5. Equal latent means | 91.58 | 41 | < .001 | .92 | Model 3 | 1.59 | 1 | .208 | 0.00 |
| Price et al., 4-item version | |||||||||
| 1. Configural | 9.81 | 4 | .044 | .98 | |||||
| 2. Metric | 14.04 | 7 | .050 | .97 | Model 1 | 4.08 | 3 | .253 | -0.01 |
| 3. Scalar | 16.65 | 10 | .083 | .97 | Model 2 | 2.37 | 3 | .499 | 0.00 |
| 4. Strict | 21.40 | 14 | .092 | .97 | Model 3 | 4.62 | 4 | .328 | 0.00 |
| 5. Equal latent means | 19.30 | 11 | .056 | .96 | Model 3 | 2.65 | 1 | .103 | -0.01 |
Note.Yoon and Lai’s (2018) subsampling approach with 2000 replications was followed. CFI = comparative fit index.
Graded Response Model
The results of the graded response model can be found in Supplementary Material 2. In our 7-item version, item 9 (“Having strong negative beliefs about yourself, other people, or the world...”) exhibited the highest discriminant capacity, while item 2 (“Repeated, disturbing dreams of the stressful experience”) showed the lowest discrimination. Interestingly, item 2 required a higher level of symptomatology (more than 2.5 standard deviations above the mean) to have at least a 50 % probability of selecting the highest response option. Conversely, item 9 required the lowest level of symptomatology (only 0.7 standard deviations above the mean) to have a 50 % probability of selecting the highest response. For the Price et al. (2016) version, the most and least discriminative items were 18 (“Feeling jumpy or easily startled”) and 7 (“Avoiding external reminders of the stressful experience...”), respectively. The most “difficult” symptomatology (1.5 standard deviations above the mean) to have a 50 % probability of selecting the highest option, compared to item 9, which required only 0.8 standard deviations above the mean to achieve that probability.
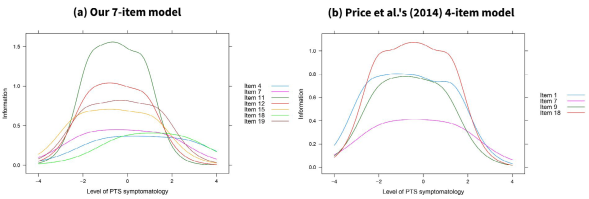
With the parameters estimated in both versions of PCL-5, information curves were plotted. As illustrated in Figure 2, in both cases, the highest informative capacity was identified at levels close to the average (or very slightly below). In our 7-item version, items 4 and 18 were the most informative at very high levels of the construct (more than three standard deviations above the average). In contrast, in Price et al. (2016) version, all four items were most informative at similar levels of the construct.
Association with Other Variables
First, the correlations between the short and long versions were examined. For our short version, the corrected correlation was r′ = .87 (uncorrected: r = .95). Similarly, the 4-item brief version of Price et al. (2016) had a corrected correlation of r′ = .82 (uncorrected: r = .89) with the long version. Next, correlations between the three versions (original, short 7-item, and Price et al. short 4-item) and a set of psychopathology variables (depression, anxiety, and worry) were also analyzed. As indicated in Table 3, the two brief versions replicate the correlation patterns of the long version. However, there is a pronounced attenuation in the 4-item version when examining its association with depression and anxiety. On the other hand, the 7-item version shows values very similar to those of the long version.
Table 3 Associations between different versions of the pcl-5 and a set of relevant variables
| Associated variables | Original 20-item version | Our 7-item version | Price et al. (2014) 4-item version |
| BDI-II | .69 [.66, .72] | .67 [.63, .70] | .56 [.52, .60] |
| BAI | .60 [.56, .63] | .57 [.53, .61] | .53 [.49, .57] |
| PSWQ | .57 [.53, .61] | .56 [.52, .60] | .54 [.50, .58] |
Note. 95 % CI are presented in brackets.
Discussion
The current study introduced a new short version of the PCL-5 for assessing PTSD symptoms. Unlike previous brief versions found in the literature, ours incorporated items from the seven dimensions of the widely recognized “hybrid model”, which has strong psychometric support (Forkus et al., 2023). Our 7-item version, 4-item version proposed by Price et al. (2016) , and previous Mexican tested 4-item (Martínez-Levy et al., 2019) and 20-item versions (Durón-Figueroa et al., 2019) demonstrated good internal consistency reliability, but compared with all these versions the presented 7-item version obtained the highest internal consistency. Furthermore, our version exhibited a single underlying factor in the same way as Price et al. (2016) 4-item version.
Regarding their relationships with other variables, our short version showed stronger correlations with the original long version, whereas Price et al. (2016) version had weaker associations. For their part Martínez-Levy et al. (2019) reported 4-item version convergent validity only with DSM-V PTSD Scale (CAPS-5) which is suitable.
Critics might question our decision to start from the hybrid model of PTSD rather than the DSM-5’s 4-cluster model (American Psychiatric Association, 2013). However, consistent research findings indicate that posttraumatic symptom scales often deviate from the DSM-5 structure (Lee et al., 2019; Moshier et al., 2018). Furthermore, it is scientifically more robust to base assessments on the model with the strongest empirical support (Forkus et al., 2023). Concerns about potential alterations to the multidimensional nature of the original scale should take into account the concept of “essential unidimensionality”, which allows for a total score even in the presence of some multidimensionality (Reise et al., 2010, 2013). Notably, prior studies have demonstrated the prevalence of a general factor in the PCL-5 (Byllesby & Palmieri, 2023; Fresno et al., 2020; Jenkins-Guarnieri et al., 2023; Schmitt et al., 2018), and it is a common practice to calculate an overall scale score rather than by dimensions (e.g., Marx et al., 2022). Therefore, our brief version provides an overall score of posttraumatic symptomatology rather than subscale scores.
While our 7-item version and Price et al. (2016) 4-item version exhibited similar performance in terms of model fit and measurement invariance, our version demonstrated higher internal consistency, resulting in correlations that closely resemble those of the original version. This aligns with psychometric theory, as shorter scales typically have lower reliability and consequently attenuate effect sizes (Furr, 2022). Additionally, our version provided broader construct coverage by addressing all seven aspects identified by the hybrid model, a recommended but sometimes overlooked feature in short-scale development (Smith et al., 2000).
The World Health Organization (2022) emphasizes the importance of enhancing clinical utility and applicability by focusing on the core symptoms of a disorder. Given the high comorbidity of PTSD with other conditions, it is essential to streamline the assessment process (Frommberger et al., 2014). The utilization of concise and specific screening tools can facilitate quicker, less re-victimizing, and more reliable diagnoses, enabling personalized interventions for traumatic situations (Stieglitz et al., 2002).
The adult scale presented in this study, with its brevity (7 items) and straightforward scoring, can support both clinical practice and research. However, it is important to remember that tests, questionnaires, or scales are diagnostic aids, and a definitive diagnosis is ultimately achieved through clinical evaluation. Also, it should be noted that the PCL-5 (both in the long and short forms) needs to be administered together with measures of the remaining DSM-5’s PTSD criteria, most notably Criterion A (i.e., exposure to a traumatic event). Otherwise, the PCL-5 would simply be a measure of general distress.
Limitations and Future Directions
The present study has certain limitations that deserve mention. First, the different short versions tested were not administered independently but were part of a single application of the 20-item long version. Second, it should be noted that the study sample was predominantly female, which may limit the generalizability of the data. Third, we did not explore the diagnostic potential of the versions studied.
While short versions of diagnostic scales can be valuable and useful for research purposes, they should be used carefully, especially when a fine-grained assessment is needed (e.g., in clinical settings or for diagnostic purposes). Despite these limitations, this study has several strengths, such as the use of a sample of people seeking psychological help, as compared to other studies that used community samples (Price et al., 2016). In future research, it will be of interest to independently administer our 7-item version in populations with diverse characteristics.
Conclusions
In the present study, a new brief version of the PCL-5 is proposed, which is based on the hybrid model of PTSD (Armour et al., 2015). This brief version demonstrated a unidimensional structure, measurement invariance between sexes, and associations with other variables of similar magnitude to those of the original version. We suggest that our short version be used in those cases where the long PCL-5 is not feasible to apply. Our results indicate that this new version is a viable and reliable instrument. It incorporates the seven dimensions representative of the PTSD hybrid model, which had not been previously tested in the Mexican population. Additionally, we recommend further examination of its psychometric properties in other contexts, such as different trauma-affected populations in Mexico, with particular attention to its potential diagnostic utility.

