


 English (pdf)
 Article in xml format
 Article references
 Send this article by e-mail
 Cited by SciELO
  Cited by Google
  Similars in
SciELO
Similars in
SciELO  Similars in Google
 Permalink
In 2021, Brazil recorded over 52.000 cases of workplace bullying (Modesto, 2022). Most research and interventions in school violence particularly obscure this form of violence among teachers by focusing on students as victims of aggression (Scheeler et al., 2022). Repeated offenses, exclusion, and humiliations characterize workplace bullying, detrimentally affecting an employee’s performance and fostering a hostile work environment. The victim experiences belittlement and becomes a target of negative social acts (Einarsen et al., 2003). Hostile behaviors can also define it, occurring at least weekly or daily for at least six months. This definition excludes temporary mistreatments, and the manner of aggression is not considered (Leymann, 1996).
In educational settings, instances of this form of violence may originate from multiple individuals involved in the teaching environment, such as directors, students, parents, administrative personnel, and peer educators (Wet & Jacob, 2021). Among teachers, stress (Malik & Björkqvist, 2019), burnout (Inandi & Büyüközkan, 2022; Mościcka-Teske et al., 2014), and psychological distress (Bernotaite & Malinauskiene, 2017) have been associated with workplace bullying.
The Negative Acts Questionnaire (NAQ; Einarsen et al., 1994; Einarsen et al., 2009) was developed to gauge feelings of exposure to moral harassment and victimization at work. Initially, the NAQ comprised twenty-three items (Einarsen & Raknes, 1997). However, cultural limitations and issues with its factorial structure required a revision, resulting in a 22-item questionnaire.
The NAQ-R encompasses three factors: personal bullying, work-related bullying, and physically intimidating forms of bullying. Personal bullying includes negative acts such as humiliation, exclusion, slander, and intimidation that target the person or their private life (Einarsen et al., 2009). Work-related bullying pertains to dysfunctional or adverse work organization, often manifesting as the imposition of excessive workloads, alteration of the nature of tasks, or enforcement of stringent deadlines (Einarsen et al., 2009). Physically intimidating forms of bullying, the third factor, involve more severe actions like physical aggression, shoving, abuse, and threats (Einarsen et al., 2003).
Global studies have confirmed the psychometric properties of the NAQ among various worker categories. Research has identified structures of three (Erwandi et al., 2021; Dujo López et al., 2020; González-Trijueque & Gómez, 2013; Gupta et al., 2017; Nam et al., 2010; Takaki et al., 2010; Tsuno et al., 2010) and two factors (Charilaos et al., 2015; Giorgi et al., 2011; Makarem et al., 2018; Rai & Agarwal, 2017), and even four (Simons et al., 2011) and five factors (Abe & Henly, 2010; Verdasca, 2008).
These investigations used exploratory factor analysis (Erwandi et al., 2021; Gupta et al., 2017; León-Pérez et al., 2019; Makarem et al., 2018; Nam et al., 2010; Takaki et al., 2010; Tsuno et al., 2010) and principal components analysis (Charilaos et al., 2015; González-Trijueque & Gómez, 2013; Rai & Agarwal, 2017; Verdasca, 2008), or both (Abe & Henly, 2010; Simons et al., 2011). The factor retention method most employed was the classic Kaiser-Guttman and Cattell criteria (Eigenvalues > 1), despite their imprecision and tendency to overestimate factor numbers (Damásio, 2012).
These studies used both oblique and orthogonal rotations to enhance result interpretation. The correlation between factors ranged from 0.16 to 0.86 (Dujo López et al., 2020; Giorgi et al., 2011; Gupta et al., 2017; Simons et al., 2011), with a total explained variances ranging from 35.58 % to 69.72 % (Abe & Henly, 2010; Giorgi et al., 2011; González-Trijueque & Gómez, 2013; Gupta et al., 2017; León-Pérez et al., 2019; Makarem et al., 2018; Rai & Agarwal, 2017; Simons et al., 2011; Tsuno et al., 2010; Verdasca, 2008). Reliability, primarily assessed using Cronbach’s alpha, varied between 0.56 and 0.98 (Abe & Henly, 2010; Charilaos et al., 2015; Dujo López et al., 2020; Erwandi et al., 2021; Giorgi et al., 2011; González-Trijueque & Gómez, 2013; Gupta et al., 2017; León-Pérez et al., 2019; Nam et al., 2010; Rai & Agarwal, 2017; Simons et al., 2011; Takaki et al., 2010; Verdasca, 2008).
The NAQ’s convergent validity was evaluated by examining its relationship with constructs like psychosocial suffering, life satisfaction (Erwandi et al., 2021; Makarem et al., 2018), self-esteem, anxiety (Charilaos et al., 2015), stress (Charilaos et al., 2015), depression (Charilaos et al., 2015; Makarem et al., 2018), work engagement (Gupta et al., 2017), burnout (Dujo López et al., 2020; González-Trijueque & Gómez, 2013; Gupta et al., 2017), job satisfaction (Simons et al., 2011), among others. The instrument’s concurrent validity was also evaluated (Simons et al., 2011; Tsuno et al., 2010).
In Brazil, these validations of the NAQ have been conducted with workers from various categories (Amazarray, 2010; Christ, 2011; Maciel & Gonçalves, 2008; Silva et al., 2017). Maciel and Gonçalves (2008) assessed its internal consistency among bank officers and professionals from various sectors, achieving a Cronbach’s alpha of 0.90. Amazarray (2010), in a study with bank officers, named a unifactorial structure, with a 45 % variance explained and a reliability of 0.94. Christ (2011) explored its application with university students, youth and adult education students, and workers from various categories, revealing four factors accounting for 58.75 % of the total variance, with reliability ranging from 0.65 to 0.87. Silva et al. (2017) found a two-factor structure for men and a single-factor structure for women among statutory servers, with variances explained of 61.3 % and 67.9 %, respectively. However, none of the Brazilian studies used confirmatory factor analysis to investigate the measure’s dimensionality, and there have been no validations with teachers.
Given the disparities in the number of NAQ factors found among Brazilian workers, the lack of studies explicitly targeting teachers, and the need for further evidence to confirm the instrument’s validity in Brazil, this study aims to examine the psychometric properties of the NAQ-R among Brazilian K12 teachers. We hypothesize that (H1) the instrument will exhibit a three- factor structure consistent with the original research (Einarsen et al., 2009) and (H2) will demonstrate convergent validity with indicators of common mental disorders, paralleling findings in the studies of Malik and Björkqvist (2019) , Inandi and Büyüközkan (2022) , Mościcka- Teske et al. (2014), and Bernotaite and Mali-nauskiene (2017) .
Method
Sample
The convenience sample included 10.148 teachers. The inclusion criteria for the sample stipulated that participants must be teachers working in public schools, ranging from Early Childhood Education to High School.
Most participants were female (81 %), aged 18 to 74 (M = 41.8; SD = 9.3). The teachers self-identified as Brown (51.2 %), White (35.5 %), Black (11.3 %), Asian (1.4 %), and Indigenous (0.7 %). The average per capita family income was R$ 2,282.8 (SD = 2,571.4). Geographically, 59.8 % worked in the Northeast, 25.2 % in the Southeast, 6.9 % in the Central-West, 5.9 % in the North, and 2.2 % in the South of Brazil.
In terms of educational background, most teachers reported having a specialization (63.9 %), a completed higher education degree (21.5 %), and a master’s degree (8.9 %). On average, they had 13.2 years of teaching experience (SD = 8.4) in public schools. Regarding the educational levels they taught, 15.7 % worked in Early Childhood Education, 39.7 % in Elementary School, 12.3 % in High School, 2.3 % in Special Education, 1.9 % in Youth and Adult Education, and 28.1 % engaged in teaching at multiple educational levels. The sample was randomly split into equal-sized groups: sample 1 for Exploratory Factor Analysis (EFA) and sample 2 for Confirmatory Factor Analysis (CFA). We detailed both samples in Table 1.
Table 1 Sociodemographic characteristics of participants
| Characteristic | Sample 1 (n = 5074) | Sample 2 (n = 5074) | ||
|---|---|---|---|---|
| n | % | n | % | |
| Sex | ||||
| Female | 4095 | 80.7 | 4121 | 81.2 |
| Male | 979 | 19.3 | 953 | 18.8 |
| Race | ||||
| Brown | 2603 | 51.3 | 2593 | 51.1 |
| White | 1818 | 35.8 | 1787 | 35.2 |
| Black | 560 | 11 | 582 | 11.5 |
| Asian | 58 | 1.1 | 79 | 1.6 |
| Indigenous | 35 | 0.7 | 33 | 0.7 |
| Educational background | ||||
| High school a | 41 | 0.8 | 42 | 0.8 |
| Incomplete higher education degree | 141 | 2.8 | 151 | 3.0 |
| Higher education degree | 1126 | 22.2 | 1053 | 20.8 |
| Specialization | 3199 | 63.0 | 3289 | 64.8 |
| Master’s degree | 480 | 9.5 | 424 | 8.4 |
| Ph. D. | 87 | 1.7 | 115 | 2.3 |
| Country Region | ||||
| Northeast | 3028 | 59.7 | 3038 | 59.9 |
| Southeast | 1268 | 25.0 | 1290 | 25.4 |
| Central-West | 351 | 6.9 | 353 | 7.0 |
| North | 305 | 6.0 | 290 | 5.7 |
| South | 122 | 2.4 | 103 | 2.0 |
| Educational levels | ||||
| Early childhood education | 785 | 15.5 | 805 | 15.9 |
| Elementary school | 1975 | 38.9 | 2053 | 40.4 |
| High school | 647 | 12.8 | 600 | 11.8 |
| Youth and adult education | 102 | 2.0 | 89 | 1.8 |
| Special education | 114 | 2.2 | 124 | 2.4 |
| Multiple educational levels | 1451 | 28.6 | 1403 | 27.7 |
| M | SD | M | SD | |
| Age | 42.0 | 9.4 | 41.6 | 9.2 |
| Teaching experience (years) | 13.4 | 8.5 | 12.9 | 8.3 |
| Family income (BRL) | 2296.8 | 2613.8 | 2268.9 | 2528.4 |
Note . a The “Magistério” is a technical secondary education program designed to train teachers in Brazil. This course prepares individuals to teach in early childhood education, elementary school, and high school.
To evaluate the cross-validation and factorial stability of the measurement, we randomly divided the sample into two groups of equal size. This method adheres to the recommendations of Laros (2005) and Schumacker and Lomax (2004) , aiming to figure out how replicable the factorial solution obtained in one dataset is within a second sample. This approach is particularly suitable when the sample size is sufficiently large to allow for the random division of respondents into two groups that are equivalent in sociodemographic characteristics. In the first of these samples, the factorial structure is derived using an exploratory factor analysis technique. In contrast, in the second sample, the cross-validation of the previously shown factorial solution is conducted using a different method, specifically confirmatory factor analysis.
Measures
Workplace Bullying
The NAQ-R measures exposure to workplace bullying over the preceding six months using a five-level response scale ranging from never to daily (Einarsen et al., 2009). The original version of NAQ-R comprises twenty-two items categorized into three factors: personal bullying (e.g., “Allegations were made against you”), work-related bullying (e.g., “You were humiliated or ridiculed because of your work”), and physically intimidating forms of bullying (e.g., “You were threatened with violence or physical abuse or were the target of actual violence”). Scores for each factor are derived by calculating the averages of their respective items.
The items on the scale do not explicitly mention “moral harassment;” instead, the assessment is based on the respondent’s self-perception of exposure to behaviors characteristic of workplace bullying (Christ, 2011). In its original study, the NAQ-R proved adequate internal consistency (α = .90).
For the Brazilian Portuguese adaptation of the NAQ-R, the translation process involved three independent translators focusing on linguistic and semantic aspects, followed by a back-translation into English. This back-translated version was compared with the original by the translators and the Norwegian authors, with discrepancies being discussed, corrected, and improved. The adapted version then underwent evaluation by five experts for relevance and cultural-semantic understanding. There was unanimous agreement on linguistic and semantic equivalence. The Brazilian Portuguese version of the NAQ-R kept the twenty-two original items and the self-perception item from the English version (Christ, 2011).
Common Mental Disorders
The Self-Reporting Questionnaire-20 (SRQ-20) is a screening tool for non-psychotic mental disorders (common mental disorders, CMDs), such as insomnia, difficulty concentrating, fatigue, headaches, and lack of appetite (e.g., “Do you easily get tired?”). This instrument includes twenty statements with binary response options of “yes” or “no.” Negative responses are scored as zero, while positive responses are scored as 1. The accumulated scores are then totaled, with a cut-off point proved at 7/8 to distinguish between the absence and presence of CMDs, respectively (Gonçalves et al., 2008). In its Brazilian validation study, the SRQ-20 proved adequate internal consistency (α = .86), a finding also seen in the current investigation (α = .96).
Procedure
The study employed an online self-administered questionnaire issued via the Internet. Informed onsent was obtained individually from all participants involved in the study.
Data Analysis
Data analysis was conducted using R (version 4.3.2) and RStudio (version 2023.12.0), incorporating various packages and metapackages, including tidyverse (version 2.0.0), tidymodels (version 1.1.1), MVN (version 5.9), psych (version 2.3.3), EFA.dimensions (version 0.1.8.1), EFAtools (version 0.4.4), lavaan (version 0.6- 17), semPlot (version 1.1.6), semptools (version 0.2.10), and semTools (version 0.5-6). Data from Sample 1 were analyzed using EFA. The process began by verifying the multivariate normality of the data through Mardia’s test. The Kaiser-Meyer- Olkin (KMO) adequacy index and Bartlett’s test of sphericity were also calculated to assess the factorability of the data matrix. Expectations were set for KMO values higher than .80 and a significant result in Bartlett’s test of sphericity (Damásio, 2012). We used parallel analysis and the Minimum Average Partial (MAP) to decide the number of factors to keep. We utilized oblimin rotation, considering the potential correlation between factors. Items with a factor loading greater than |.40| were kept.
Data from Sample 2 underwent CFA. As in Study 1, the assessment of multivariate normality of the data was conducted using Mardia’s test. Fit indices analyzed included the comparative fit index (CFI), Tucker-Lewis’s index (TLI), root mean square error of approximation (RMSEA), and standardized root mean square residual (SRMR). Expected values for CFI and TLI were greater than .90, and for RMSEA and SRMR, less than .08 (Brown, 2015). The internal consistency of the measure was evaluated using Cronbach’s alpha and McDonald’s omega. Lastly, convergent validity was assessed through Spearman’s rank correlation between the NAQ-R and the SRQ-20 factors.
Results
Exploratory Factor Analysis
Multivariate skewness and kurtosis, according to Mardia, were both significant, writing down the data’s non-normal distribution (𝛽1,p = 172685.2, p < .001; 𝛽2,p = 1109.6, p < .001). The Kaiser- Meyer-Olkin (KMO) measure was .97, and Bartlett’s test of sphericity was significant (χ2(231) = 89753.5, p < .001), affirming the data matrix’s factorability. The data’s non-normality and the variables’ ordinal nature needed using a polychoric matrix and the Weighted Least Squares Mean and Variance adjusted (WLSMV) method for extraction.
Parallel analysis and the Minimum Average Partial (MAP) suggested keeping up to five and two factors, respectively. However, models with three, four, and five dimensions lacked theoretical coherence. The two-factor structure merged fifteen items under “personal bullying” and six under “work-related bullying.” Item 1, “Someone withheld information that could affect your work performance”, did not achieve a factor loading above |.40| and was thus excluded from CFA. The two factors accounted for 61 % of the variance. The results of the exploratory factor analysis are presented in Table 2.
Table 2 Results from an exploratory factor analysis of the Negative Acts Questionnaire-Revised (NAQ -R)
| Items | Factor | Loadings |
|---|---|---|
| 1 | 2 | |
| Factor 1: Personal bullying | ||
| 1. Someone withholding information which affects your performance at work. | .399 | .164 |
| 2. You were humiliated or ridiculed because of your work. | .713 | .104 |
| 5. Spreading of gossip and rumors about you. | .987 | -.252 |
| 6. Being ignored, excluded, or put on the back burner. | .719 | .102 |
| 7. Having insulting or offensive remarks made about your person, attitudes, or your private life. | .997 | -.208 |
| 8. Being shouted at or being the target of spontaneous anger. | .772 | .051 |
| 9. Intimidating behaviors such as finger-pointing, invasion of personal space, shoving, blocking your way. | .787 | .076 |
| 10. Hints or signals from others that you should quit your job (transfer yourself to another unit). | .687 | .193 |
| 11. Repeated reminders of your errors or mistakes. | .680 | .146 |
| 12 Being ignored or facing a hostile reaction when you approach. | .703 | .190 |
| 13. Persistent criticism of your work and effort. | .685 | .175 |
| 14. Having your opinions and viewpoints ignored. | .501 | .273 |
| 15. Practical jokes conducted by people you don’t get along with. | .651 | .107 |
| 17. Allegations were made against you. | .816 | .085 |
| 20. Being the subject of excessive jokes and sarcasm | .700 | .204 |
| 22. You were threatened with violence or physical abuse or were the target of actual violence. | .655 | .194 |
| Factor 2: Work-related bullying | ||
| 3. Being ordered to do work below your level of competence. | .233 | .573 |
| 4. Having key areas of responsibility removed or replaced with more trivial or unpleasant tasks. | .245 | .548 |
| 16. Were asked to perform tasks that were unreasonable or with an impossible deadline to meet. | .097 | .687 |
| 18. Excessive monitoring of your work. | .287 | .559 |
| 19. Pressure not to claim something to which by right you are entitled. | .341 | .538 |
| 21. Being exposed to an excessive workload | -.069 | .677 |
Note. N = 5074. The extraction method was WLSMV with an oblique (oblimin) rotation. Factor loadings above .40 are in bold. The items’ content aligns with the Brazilian Portuguese version of the NAQ-R and may not directly correspond to the content of the original English version.
Confirmatory Factor Analysis
Mardia’s test for multivariate normality revealed a non-normal distribution of data (𝛽1,p = 161962.8, p < .001; 𝛽2,p = 1028.6, p < .001). The WLSMV method was employed again as the estimation method. The CFA of the NAQ-R showed inadequate robust fit indices (Brosseau-Liard & Savalei, 2014). Consequently, modification indices were reviewed, leading to the decision to correlate residuals of items with similar content (5 and 7; 3 and 4; 8 and 9). These correlations were added progressively to the model until the fit indices reached acceptable levels, except RMSEA (Byrne, 1994). We present the conventional, scaled, and robust fit indices in Table 3.
Table 3 Fit indices for the confirmatory factor analysis of the Negative Acts Questionnaire - Revised (NAQ-R)
| Fit Indicator | Model 1 | Model 2 | |
|---|---|---|---|
| CFI | .992 | .995 | |
| CFI scaled | .944 | .965 | |
| CFI robust | .873 | .916 | |
| TLI | .991 | .994 | |
| TLI scaled | .937 | .906 | |
| TLI robust | .858 | .905 | |
| RMSEA | .050 | .038 | |
| (90 % CI) | [.048, .051] | [.037, .040] | |
| RMSEA scaled | .067 | .053 | |
| (90 % CI) | [.065, .068] | [.052, .055] | |
| RMSEA robust | .109 | .089 | |
| (90 % CI) | [.109, .106] | [.089, .086] | |
| SRMR | .049 | .041 |
Note. CFI = comparative fit index, TLI = Tucker-Lewis’s index, RMSEA = root mean square error of approximation, SRMR = standardized root mean square residual.
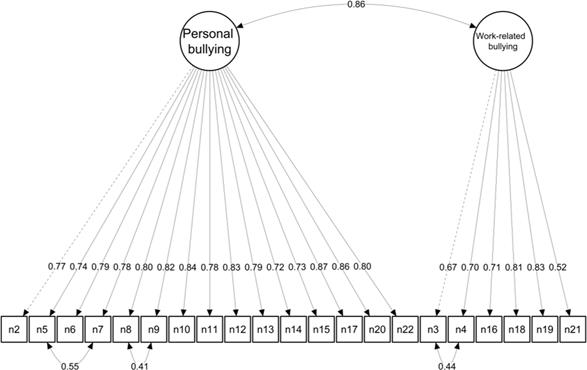
In the final model, all items proved factor loadings above .50 (Stevens, 2009). The standardized factor loadings are depicted in Figure 1.
Internal Consistency and Convergent Validity
The reliability of the NAQ-R factors was found to be satisfactory (personal bullying: α = .93, ω = .79; work-related bullying: α = .92, ω = .74). Additionally, positive correlations between the NAQ-R factors and the SRQ-20 were seen, showing convergent validity (personal bullying: rs(10,146) = .27, p < .001; work-related bullying rs(10,146) = .33, p < .001).
Discussion
The objective of this study was to investigate the psychometric properties of the NAQ within the context of Brazilian K-12 educators, incorporating exploratory and confirmatory factor analyses alongside convergent validity. The findings showed a two-factor structure for the NAQ-R, including personal bullying and work-related bullying. The instrument proved proper fit indices, internal consistency, and convergent validity evidence with a mental health measure.
Exploratory factor analysis revealed that two underlying factors of the NAQ-R accounted for 61 % of the variance in item responses, aligning with the results of similar international studies (Abe & Henly, 2010; Verdasca, 2008). Conversely, other investigations have reported lower explained variances for the instrument’s factors in comparison to the findings of the current study (Giorgi et al., 2011; González-Trijueque & Gómez, 2013; León- Pérez et al., 2019; Makarem et al., 2018; Simons et al., 2011; Tsuno et al., 2010).
Contrasting with the original study (Einarsen et al., 2009), this investigation found that items associated with the “Physically intimidating bullying” factor were grouped under the “Personal bullying” factor. This finding does not support the H1 outlined in the study.
The amalgamation between those factors is rationalized since statements about physical intimidation are variations of personal bullying, albeit standing for more severe violence forms. This finding echoes other NAQ-R adaptations (Giorgi et al., 2011; Makarem et al., 2018; Rai & Agarwal, 2017), including studies with teachers (Charilaos et al., 2015), where similar integration of these factors was seen.
Item 1, “Someone withholding information which affects your performance at work,” did not reach a factor loading above |0.40| and was excluded from the confirmatory analysis, a result that aligns with another study where this item also received no endorsement (Abe & Henly, 2010). Given a teacher’s autonomy in classroom management and work performance, withholding information may take time to affect their work. Conversely, teachers generate student-related information, typically shared with colleagues.
In contrast to the original study (Einarsen et al., 2009), “Having key areas of responsibility removed or replaced with more trivial or unpleasant tasks” aligned with the work-related bullying factor instead of personal bullying. This item’s focus on work tasks justifies its categorization in this dimension, as corroborated by other studies (Charilaos et al., 2015; Dujo López et al., 2020; Erwandi et al., 2021; Giorgi et al., 2011; González-Trijueque & Gómez, 2013; Makarem et al., 2018; Nam et al., 2010; Takaki et al., 2010).
Also deviating from the original version of the NAQ-R (Einarsen et al., 2009), the statement “Having your opinions and viewpoints ignored” was included in the personal bullying factor. This item’s retention in this dimension is plausible as it involves devaluing personal stances, extending beyond professional opinions. Equivalent results were noted in other studies (Dujo López et al., 2020; González-Trijueque & Gómez, 2013; Makarem et al., 2018; Takaki et al., 2010).
The NAQ-R’s CFA yielded acceptable fit indices, showing that the theoretical measurement model aligns well with the empirical data (Hair et al., 2009). This outcome is consistent with earlier studies, where the two-factor structure showed suitable fit indices (Giorgi et al., 2011; Makarem et al., 2018; Rai & Agarwal, 2017). The original study posited that both unidimensional and two-factor structures showed good fit indices, though the data favored a three-factor structure (Einarsen et al., 2009). Cultural differences may account for the variations between this study, the original research, and other global instrument validations.
Finally, the NAQ-R in this study proved internal consistency measures of reliability above the desirable threshold for both factors, aligning with past research that found adequate reliability for the two-factor structure (Rai & Agarwal, 2017). The correlation between the NAQ-R factors in this study shows that the instrument’s dimensions are interrelated, supporting the use of oblique rotation methods for more nuanced interpretation. Consistent with the original NAQ-R validation study, the high correlation between the factors shows that personal and work-related bullying often co-occur in the work environment (Einarsen et al., 2009).
The NAQ-R factors positively correlated with CMDs, supporting the measure’s convergent validity. This result supports H2 of the study. Similar validity evidence has been found in other studies that correlated the NAQ-R with instruments assessing mental health (e.g., Erwandi et al., 2021; Makarem et al., 2018; Charilaos et al., 2015). Workplace bullying, encompassing victimization primarily causing psychological harm (Einarsen et al., 2009), suggests that negative behaviors like threats, humiliation, intimidations, and physical aggressions can inflict significant mental health damage. A study involving teachers (Pinheiro et al., 2023) highlighted the association between physical aggression, verbal harassment, and psychological harm. Moreover, these results align with other research exploring the impact of school violence on teacher health (Wilson et al., 2011).
Strengths and Limitations
This study faced limitations. The use of convenience sampling restricts the generalizability of the results. Nonetheless, the factorial structure aligns with earlier studies (Charilaos et al., 2015; Giorgi et al., 2011; Makarem et al., 2018; Rai & Agarwal, 2017) conducted in different contexts, suggesting the measure’s robustness.
Another limitation concerns the inherent nature of self-report scales, which do not provide causal explanations for the observed phenomena. High scores on the NAQ-R show the presence of workplace bullying but offer limited insight into the underlying reasons for this phenomenon. While helpful for screening workplace bullying, deeper understanding needs added research approaches, such as qualitative methods. The NAQ-R is a measure that can generate hypotheses and aid in intervention planning. Despite these limitations, the study employed rigorous methods appropriate to the data and conducted comprehensive analyses to show evidence of the instrument’s validity, with the substantial sample size being noteworthy.
Recommendations for Future Research and Intervention
Future research extending the psychometric analysis of the NAQ-R and exploring its properties among other Brazilian worker samples could contribute to a better understanding of workplace bullying in Brazil. It is valuable to set up evidence of convergent and predictive validity through the NAQ-R’s relationship with external measures and its use in predicting work-related psychological phenomena (e.g., mental health, burnout, engagement, job satisfaction, turnover, productivity, absenteeism).
The NAQ-R can support effective interventions, informed by the detection of workplace bullying, which could include the formulation of organizational policies against harassment, information dissemination through manuals and training, adoption of ethical leadership styles, and management reorganization. These initiatives require senior management’s support and active involvement (Glina & Soboll, 2012).

