


Services on Demand
Journal
Article
 English (pdf)
 Article in xml format
 Article references
 Send this article by e-mail
Indicators
-
 Cited by SciELO
 -
 Access statistics
Related links
-
 Cited by Google
 -
 Similars in
SciELO
Similars in
SciELO -
 Similars in Google
Share

 Permalink
Earth Sciences Research Journal
Print version ISSN 1794-6190
Earth Sci. Res. J. vol.13 no.2 Bogotá July/Dec. 2009
MAPPING HIGH-ANGLE BASEMENT FAULTS IN THE MIDDLE BENUE TROUGH, NIGERIA FROM GRAVITY INVERSION SURFACE
G.C. Onyedim1, K.D. Alagoa2, I.O. Adedokun2, A.A. Aderogba2 and C. Ovuru2
1 Department of Physics, Obafemi Awolowo University, Ile_Ife, Osun State, Nigeria
2 Department of Geology and Physics, Niger Delta University, Amassoma, Wilberforce Island, Bayelsa State, Nigeria
E-mail: gonyedim@oauife.edu.ng
Manuscript received: 30/07/2009 Accepted for publication: 15/12/2009
ABSTRACT
High-angle faults appear as vertical off-sets on a topographic surface including that derived through the inversion of gravity data. In this study of the middle Benue trough, Nigeria, gravity data for the area was bandpass filtered and inverted to generate a topographic surface map of the basement. Furthermore, a topographic slope surface map was produced by calculating the horizontal gradient magnitude over the surface. An automatic method was used to scan the horizontal gradient magnitude grid to identify maxima whose loci were mapped as high-angle faults in the basement.
Three major NE-SW trending faults of regional dimension were identified. There are also shorter but significant NW-SE trending faults. The NE-SW and NW-SE sets are interpreted as conjugate pairs within the fracture system of the Nigerian Basement Complex. In places, segments of these faults represent bounding faults enclosing the four major sub-basins which were identified around Bashar, Mutum Biyu, Wukari and Lafia.
Keywords: Gravity anomalies, inversion, bandpass filter, topographic surface, basement, high-angle faults.
RESUMEN
Ángulo mayor de las fallas aparece como salida vertical en una superficie topográfica que incluye la derivada mediante el cambio de los datos de gravedad. En este estudio de la depresión intermedia Benue, Nigeria, los datos de gravedad para el área fue filtrado de arriba hacia abajo por el paso de banda para generar un mapa topográfico de la superficie del basamento. Además, un mapa de superficie topográfico de la pendiente fue producido por el cálculo de la magnitud del gradiente horizontal sobre la superficie. Se uso un método automático para explorar la magnitud máxima de la gradiente horizontal de la red para identificar los loci graficados en mapas que muestran las fallas con ángulos mayores en el basamento.
Tres NE-SW tendencias principales de la falla de la dimensión regional fueron identificado. Allí están las tendencias de las fallas NW-SE más cortas pero significativa. Se establece que el NE-SW y NW-SE son interpretados como pares conjugados en el sistema de la fractura del Basamento complejo de Nigeria. En algunos lugares, los segmentos de estas faltas están representan por coordenadas encerradas por cuatro principales sub-cuenca que son identificadas alrededor de Bashar, Mutum Biu, Wukari and Lafia.
Palabras clave: anomalías de la gravedad, inversión, filtro de paso de banda, superficie topográfica, subsuelo, fallas de ángulo mayor.
Introduction
The Benue trough is part of a long stretch of the Central African rift system and one of about seven inland sedimentary basins in Nigeria. At present, oil exploration and production activities are concentrated mainly in the Niger delta located at the southern end of the trough. Few exploratory wells have been drilled in the Benue trough by multinationals but they were soon abandoned as unproductive. However research results on the sedimentary rocks in parts of the trough show that they are capable of generating and expelling oil and/or gas due to their high organic productivity (Nwachukwu, 1985 and Obaje et al., 2004). Furthermore, considering that the Oil and Gas industry now uses advanced technology to aid in the search for resources, drilling and extraction, and allows for the development of resources that were not previously economically viable, there is currently renewed intense geological and geophysical research interest in the exploration for oil and gas in the other inland basins especially Anambra, Benue trough and its northern extension - the Chad Basin. Together, if proven, these new sources of oil and gas will replace or complement production from existing wells as they decline, and help to ensure adequate oil and gas supplies to meet future demands.
Prior to the comparatively very expensive exercise of acquisition and analysis of seismic data in the exploration for oil and gas in sedimentary basins it is common practice to conduct preliminary investigations using, for example, potential field (gravity/magnetic) data.
In sedimentary basins, basement faults are important structurally because they can influence and hence determine the overall basin architecture, tectonic history and control mineralization sites, oil and gas traps and groundwater flow patterns. Due to the blanket of sedimentary rocks whose thickness can be considerable in places, the basement faults cannot be mapped directly using conventional field methods. In this circumstance, this study was aimed at utilizing an indirect method to map faults and associated structures in the basement through the analysis and interpretation of gravity data.
The study area
The study area, covering a region of 12,100 km2 and shown in Fig.1, is located in the Benue trough, Nigeria. It is bounded by latitudes 7o 00'N and 9o 30'N and longitudes 8o 30'E and 11o 00'E. The trough is a NE-SW trending sedimentary basin, with an approximate length of about 800 km and bounded on its southwestern and northeastern ends by the Niger Delta and the Chad Basin respectively.
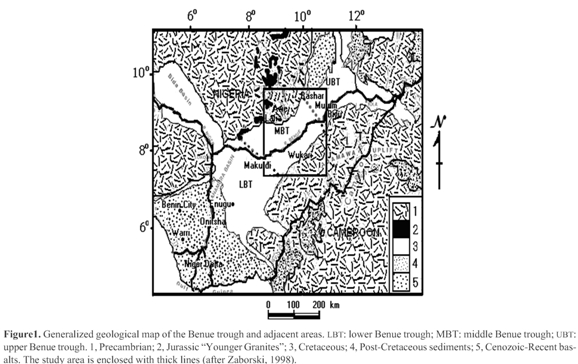
The area, whose northeastern and southwestern boundaries are marked by large dotted lines in Fig.1, is referred to as the middle Benue trough (MBT) (Cratchley and Jones, 1965). The area was chosen for study because, according to Nwachukwu (1985), the MBT is considered to be the most prospective area within the trough because depths to the mature zones are moderate (2-4 km). However, compared to other parts of the trough, the MBT is relatively poorly mapped, especially in its northeastern part. Dessauvagie (1969) conducted a photogeological study of the area southeast of Bashar. Offodile (1976) prepared maps for the area around Lafia-Keana-Awe region and Nwajide (1985) mapped the area around Makurdi. Stratigraphically, the Cretaceous sedimentary succession (beginning from the oldest to the youngest) consists of the Asu River Group, the Awe, Keana, Eze-Aku, Awgu and Lafia Formations. Nwachukwu (1985) suggested that exploration targets in the basin include both the sub-Santonian and superSantonian sediments, with the Eze-Aku Group, Awgu Shale, and Nkporo Shale being more prospective than the stratigraphically lower Asu River Group. No post-Cretaceous sediments occur in the middle Benue trough. Volcanic activity was also relatively minor in scale and was concentrated in its southern part. A notable occurrence is the phonolithic trachyte of Wase Rock described by Wright (1989). Basalt flows occur around Awe and dolerite sills, of Cenozoic age have been encountered within the Lafia Formation (Obaje et al, 1994). The pre-Mesozoic rocks, which form the basement, consist mainly of granulitic gneisses, migmatites, Older granites, Younger granites, porphyries and rhyolites, migmatites and gneisses.
Materials and methods
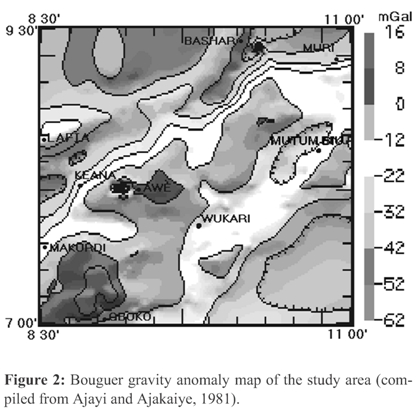
The gravity data for the area were compiled from the Bouguer gravity map published by Ajayi and Ajakaiye (1981). The map was digitized at 1 km spacing and the resulting data was gridded using the program MINC based on the minimum curvature procedure (Webring, 1981). A shaded relief image of the gravity anomalies is shown in Fig. 2. In conformity with most features of the trough, the general trend of the gravity anomalies is northeast-southwest. The magnitude of the anomalies ranges between -62 mGal and 16 mGal. As with previous gravity studies by Cratchley and Jones (1965) and Adighije (1979) the gravity map is characterized by a NE-SW trending regional positive anomaly flanked by linear negative anomalies.
Justification for the Method
On a topographic map or digital elevation model (DEM), faults have distinctive expressions which include the linear alignment of areas of steep slope, apparently down-dropped or uplifted topography. Onyedim and Ogunkoya (2002) observed that linear features which appear on topographic maps may be found to mark sites of vertical movements, tilting or horizontal displacements and therefore are characteristic of parts of the crust that have been subjected to block-faulting. Eliason (1992) proposed that topographic lows can indicate geological fractures because near-surface planarsegments offracture zones locallycontrol the orientation of aligned topographic lows by influencing erosion processes.
In general, gravity anomalies are sensitive to the vertical changes in density at contacts where the beds are displaced vertically due to faulting. As the angle of the contact of density contrast between the two rock types (or the dip of the fault) decreases, the resulting gravity signal becomes broader and flat and therefore less definable. For this reason, shallowly and moderately dipping contacts in rocks of differing densities are essentially 'invisible' to gravity and would not produce significant features in the gravity inversion surface (GRAVIS). Therefore, the premise of the methodology used in this study is that topographic features showing significant vertical offset on a GRAVIS can be interpreted as high-angle faults. In this study ofthe middle Benue trough, Nigeria, the bandpass filtered gravity map was inverted to produce a topographic surface map of the basement. Points of maximum slope on the GRAVIS were determined and where such points form prominent linear features, they have been interpreted as high-angle faults in the basement.
Filtering of Gravity Data
Gravity anomalies in the study area, as show in Fig.2, are the sum effect of the density variations at various depths and of different magnitudes. In order to produce a map of the basement topography by inversion of gravity data, it was necessary to determine first the anomalies due primarily to the density contrasts in the basement rocks. The standard approach is to apply a bandpass filter which removes the high frequency (short wavelength) components associated with shallow features; thereby leaving the low frequency (long wavelength) anomalies of interest. The application of a bandpass filter requires knowledge ofthe cut-offwavelength. Rather than estimate these by trial and error, the matched filtering procedure described by Phillips (1997) was adopted in this study. The computed log averaged radial power spectrum of the gravity data is shown in Fig. 3. A characteristic feature of the power spectrum curve is the rapid drop in energy at the low frequency region, which is indicative of response to deep-seated sources and a gentler decline at the high frequency end caused by near surface sources of density contrast (Negi et al., 1983). Based on the changes in slope the power spectrum curve for the area shows that there are three major density layers overlying a half-space.
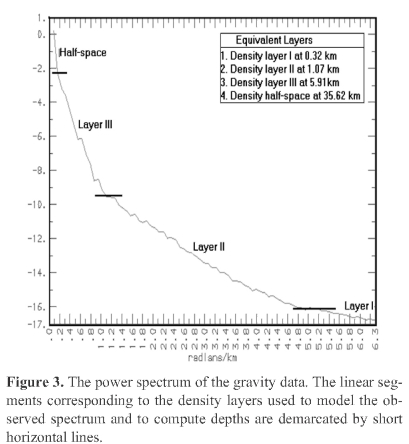
These are marked as Layers I, II, II and a half-space in Fig. 3. Bandpass filters were designed for the density layer models whose depths were also computed from the slopes of regression lines fitted to the observed segments in the power spectrum curve. The bandpass filter wavelengths and depths computed for the model density layers are shown in Table 1.
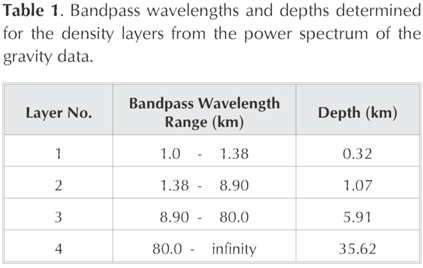
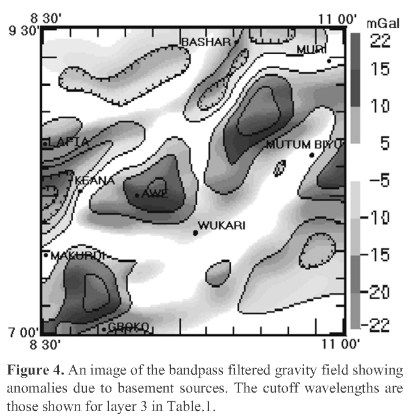
Considering that the depth of 5.91 km determined for Layer III is comparable to the values determined for the basement in parts of the trough by other workers (Benkhelil, 1988, Ofoegbu, 1984 and Saugy, 1987), the corresponding cutoff wavelengths for the layer were used to compute the gravity anomalies associated with the basement rocks. The resulting image of the bandpass filtered gravity field due to sources of density contrast in the basement is shown in Fig. 4. Subsequent analyses were performed on the bandpass filtered gravity dataset.
Inversion of Gravity Data and Basement Fault Interpretation
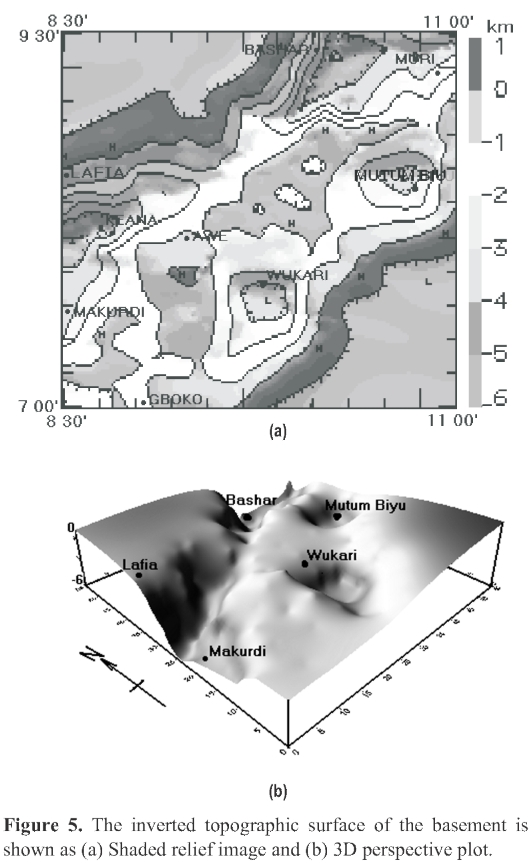
The bandpass filtered gravity data was inverted using the 3D inversion method described by Cordell and Henderson (1968). Noting that the depths computed from a power spectrum curve are essentially mean depths to the top of an ensemble of sources (Naidu, 1968; Spector and Grant, 1970) and a value of 5.91 km calculated for the depth to the basement, the modeling was constrained by specifying 6 km as the depth to the middle reference surface ofthe densitylayer with a density contrast of -0.35 gm-cm-3. Fairhead and Okereke (1990) used a density contrast of-4.0 gm-cm-3. The basement topographic surface (BTS) map generated from this analysis is shown as a shaded relief image in Fig. 5a and as a 3D perspective plot in Fig. 5b.
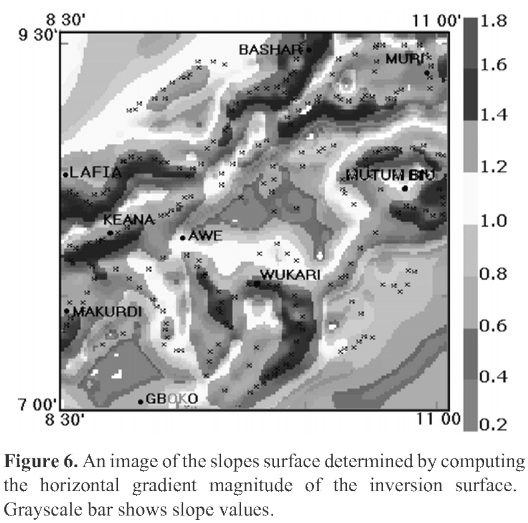
To interpret faults on the BTS, the interpreter starts by conducting a lineament analysis, which involves the identification of linear zones of maximum gradient. Thus, the interpreter needs to plot the BTS in such a way that such zones representing offsets in the surface can be identified easily. Four plotting options are available: shaded relief view (Fig. 5a), profiles or cross-sections, 3D perspective view (Fig. 5b) and a plan view showing points on the BTS that locally define its maximum slope. The maximum slope option was used in this study because of the subjective nature of the first three options. Accordingly, a grid of horizontal gradient magnitude (HGM), which defines the slopes, was computed from the BTS grid. This is plotted in Fig. 6. Furthermore, a subroutine of the program BOUNDARY described by Phillips (1997) was used to scan the HGM grid for maximum slope points, which are plotted as crosses in Fig. 7.
Discussion of results
The inverted surface images in Figs. 5a and 5b show that the basement surface is composed of juxtaposed sub-basins and horsts. The prominent sub-basins are those located southeast of Bashar, around Mutum Biu and Wukari and south of Lafia. They are part of the sub-basins identified by their morphostructural anomalies (Onyedim et al, 2004a) and from the basement isobath map determined from aeromag-netic and gravity data (Benkhelil, 1988, 1989). The 3D perspective plot in Fig. 5b reveals that the sub-basins located south of Bashar and Lafia are connected and appear to form a continuous N-E trending depression spanning the entire length along the northwestern boundary of the MBT. The horsts form a central N-E trending belt stretching from the southwestern corner through Awe and up to Muri in the northeastern corner.
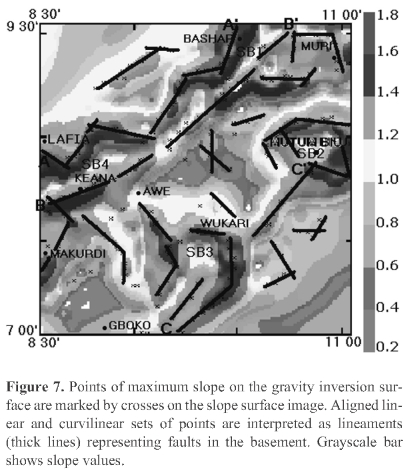
The main product for fault interpretation is the map of maximum slope points shown in Fig. 6. Here, the map of maximum slope points was superposed as a transparency over the HGM image to ascertain that the maximum points indeed fall along the ridges of the HGM surface. The correspondence between the two is quite remarkable. Therefore, faults were interpreted on this image by highlighting linear features, which show as collinear or slightly curvilinear arrangement of maximum slope points. The aligned maxima, which are interpreted as high-angle faults, are shown with thick lines in Fig. 7 while the sub-basins are labeled SB1, SB2, SB3 and SB4 respectively.
A linear feature can be considered structurally significant if it extends over a distance of about 4 km or more (Onyedim and Ocan, 2001). In some cases, short but aligned segments may also satisfy this criterion. Based on this, the major faults in the area are those labeled AA', BB' and CC' in Fig. 7. Fault AA' consists of segments whose strike alternate between NE-SW and approximately E-W to WNW-ESE. They coincide approximately with the boundary of the Cretaceous sediments and the Precambrian basement. Fault BB' is a better defined linear feature. In places, fault AA' and BB' form the boundaries to the sub-basins SB1 and SB4. The continuity of the fault CC' is broken around Wukari by a NW-SE trending fault segment, which forms part of the nearly circular feature enclosing sub-basins SB3. Part of the fault CC' links the Wukari sub-basin SB3 with the Mutum Biu sub-basin SB2. The region between the faults BB' and CC' is dominated by swarms of smaller faults trending mainly NW-SE. According to Onyedim et al (2004b) the NW-SE trending faults form a conjugate pair with the NE-SW trending faults and are referred to collectively as riedel shear faults. According to Kogbe (1983), Ananaba (1983) and Oluyide (1988), the NE-SW and NW-SE fracture systems predate the rifting ofthe Benue and Nigertroughs and can be interpreted as significant features of the tectonic framework of the Nigerian Basement Complex.
Conclusions
The fault pattern in the basement beneath a sedimentary basin can be unraveled by analyzing the topographic surface of the basement obtained by inverting gravity data. This study has demonstrated the effectiveness of the method involving the production of an inversion surface for the bandpass filtered data and identifying faults as the maximum slopes on this surface. Applicationofthe methodto the gravitydata ofthe middle Benue trough, Nigeria showed that the major faults in the basement trend NE-SW and NW-SE. In places, segments of these faults form bounding faults to sub-basins in the area.
Acknowledgements
The paper was developed and written with the co-authors when the corresponding author was on a sabbatical leave at the Niger Delta University, Amassoma, Bayelsa State. We wish to thank the authorities of the University for the provision of computer facilities and the USGS for use of their potential field software for gravity data processing and interpretation.
References
Adighije, C.I. (1979). Gravity field of Benue Trough, Nigeria. Nature, 282, 199-201. [ Links ]
Ajayi, C.O. and Ajakaiye, D.E. (1981). The origin and peculiarities of the Nigerian Benue trough: Another look from recent gravity data obtained from the middle Benue. Tectonophysics, 80, 285-303. [ Links ]
Ananaba, S.E. (1983). Evaluation of remote sensing application to geophysical studies in Nigeria. Unpublished Ph. D. Thesis, Ahmadu Bello University, Zaria, Nigeria. [ Links ]
Benkhelil, J. (1988). Structure et evolution geodynamique du basin intracontinantal de la Benoue Nigeria. Bulletin Centres Recherchers Exploration-Production Elf-Aquitaine 12, 29-128. [ Links ]
Benkhelil, J. (1989). The origin and evolution of the Cretaceous Benue Trough, Nigeria. Journ. African Earth Sci., 8, 251-282. [ Links ]
Cordell, L and Henderson, R.G. (1968). Iterative three-dimensional solution of gravity anomaly data using a digital computer. Geophysics, 33, 596-601. [ Links ]
Cratchley, C.R. and Jones, G.P. (1965): An interpretation of the geology and gravity anomalies of the Benue valley, Nigeria. Overseas Geological Surveys, Geophysical Paper 1, 26pp [ Links ]
Desauvagie,T.F.J. (1969). Photogeological interpretation of Sheet 46 (Futuk), Nigeria. Journ. Min. Geol. & Metal. Soc., 4, 13-28. [ Links ]
Eliason, J.R. (1992). Mapping fractures remotely for earthquake hazard assessment by the use of topographic and seismic hypocenter data. Episode, 15, No.1, 75-82. [ Links ]
Fairhead, J.D and Okereke, C.S. (1990). Crustal thinning and extension beneath the Benue Trough based on gravity studies. Journ. Afri. Earth Sci., 11, (3/4), 329-335. [ Links ]
Kogbe, C.A. (1983). Geological interpretation of Landsat imageries across central Nigeria. Journ. Afri. Earth Sci., 1, 313-320. [ Links ]
Naidu, P.S. (1968). Spectrum of potential field due to randomly distributed sources. Geophysics, 33, 337-345. [ Links ]
Negi, J.A., Agarwal, P.K. and Rao, K.N.N. (1983). Three dimensional model of the Koyna area of Maharashtra State (India) based on the spectral analysis of aeromag-netic data. Geophysics, 48, 964-974. [ Links ]
Nwachukwu, J.I. (1985) Petroleum Prospects of Benue Trough, Nigeria. Am. Assoc. Pet. Geol., Bull., 69 (4), 601-609. [ Links ]
Nwajide, C.S. (1985). A systematic lithostratigraphy of the Makurdi Sandstones, Benue Trough. Journ. Min. Geol., 22, 9-23. [ Links ]
Obaje, N.G., Ligous, B. and Abaa, S.I. (1994). Petrographic composition and depositional environments of Cretaceous coals and coal measures in the middle Benue trough of Nigeria. International Journal Coal Geology, 26, 233-260. [ Links ]
Obaje, N.G., Wehner, H., Scheeder, G., Abubakar, M.B. and Jauro, A. (2004). Hydrocarbon prospectivity of Nigeria's inland basins: From the viewpoint of organic geochemistry and organic petrology. Am. Assoc. Pet. Geol., Bull., 88, 3, 325-353. [ Links ]
Offodile, M.E. (1976). The geology of the Middle Benue, Nigeria. Cretaceous Research, 1, 101-124. [ Links ]
Ofoegbu, C.O. (1984). Amodel for the tectonic evolutionof the Benue Trough of Nigeria. Geologische Rundschau, 73,1007-1018. [ Links ]
Oluyide, P.O. (1988).Structural trends inthe NigerianBase-ment Complex. Oluyide, P. O.; Mbonu, W. C.; Ogezi, A. E.; Egbuniwe, I. G.; Ajibade, A. C. andUmeji, A. C. (Editors), Precambrian Geology ofNigeria. Geol. Surv. Nigeria. 93-98. [ Links ]
Onyedim, G.C. and Ocan, O.O. 2001. Correlation of SPOT imager lineaments with geological fractures in part of Ilesha area, southwestern Nigeria. Journ. Min. & Geol., 37, 15-22. [ Links ]
Onyedim, G.C. and Ogunkoya, O.O. (2002). Identification and geological significance of linear and curvilinear features on topographic maps. Journ. Min. & Geol, 38, 13-20. [ Links ]
Onyedim, G.C., Awoyemi, M.O. and Arubayi, J.B. (2004a). Interpretation of morphostructural and aeromagnetic anomalies in part of the middle Benue trough, Nigeria. Journ. Min. Geol., 40, 49-55. [ Links ]
Onyedim, G.C., Arubayi, J.B., Ariyibi, E.A., Awoyemi, M.O. and Afolayan, J.F. (2004b). Elements of wrench fault tectonics deduced from SLAR imagery and aero-magnetic data in part of the middle Benue trough, Nigeria. Journ. Min. Geol., 41, (1), 51-56. [ Links ]
Phillips, J.D. (1997). Potential field geophysical software for the PC, version 2.2: US Geological Survey Open-File Report 97-725. [ Links ]
Saugy, L. (1987). The Benue Trough and Bornu basin: New geophysical data enlightening the distribution of Cretaceous sedimentary basins. Bull. Centres Rech. Explo-Prod. Elf-Aquitaine, 11, (1), 178-180. [ Links ]
Spector, A and Grant, F.S. (1970). Statistical models for interpreting aeromagnetic data. Geophysics, 35, 293-302. [ Links ]
Webring, M. (1981). MINC: A gridding program based on minimum curvature. USGS Open File Report, 81-1230, 41pp [ Links ]
Wright, J.B. (1989). Volcanic rocks in Nigeria, Kogbe, C.A (Editor), Geology of Nigeria, Rock View (Nigeria) Ltd, Jos, Nigeria. 125-173. [ Links ]
Zaborski, P.M. (1998). Areviewofthe Cretaceous system in Nigeria. Africa Geoscience Review, 5, (4), 385-483. [ Links ]

