


Services on Demand
Journal
Article
 English (pdf)
 Article in xml format
 Article references
 Send this article by e-mail
Indicators
-
 Cited by SciELO
 -
 Access statistics
Related links
-
 Cited by Google
 -
 Similars in
SciELO
Similars in
SciELO -
 Similars in Google
Share

 Permalink
Earth Sciences Research Journal
Print version ISSN 1794-6190
Earth Sci. Res. J. vol.14 no.1 Bogotá Jan./June 2010
GEOPHYSICAL CONTRIBUTION TO EVALUATE THE HYDROTHERMAL POTENTIALITY IN EGYPT: CASE STUDY: HAMMAM FARAUN AND ABU SWIERA, SINAI, EGYPT
Magdy A. Atya1, Olga A. Khachay2, Aiman Abdel Latif1, Oleg Y. Khachay2, GadM. El-Qadyl and Ayman I. Taha1
1 National Research Institute of Astronomy and Geophysics, Helwan, Cairo, Egypt.
2 Institute of geophysics UD RAS, Ural's state University, Russia.
Manuscript received: 03/02/2010 Accepted for publication: 14/04/2010
ABSTRACT
The geothermal potentiality in Egypt has a minor significance in the aspects of the Egyptians life, while the hydraulic and hydrocarbon resources are more convenient. However, some other applications for the geothermal activity such as direct warming, pools, and physiotherapy make the research for geothermal as requested. In the present work, two locations with rather good geothermal potentiality will be studied; these are Hammam Faraun and Abu Swiera (water temperature is about 70 °C; at Sinai Peninsula).
The contribution of the geophysical techniques to evaluate such potentiality could be considered, as its capability to identify the reservoir characteristics and its implementation is acceptable. Therefore, a geophysical survey program has been conducted in terms of seventeen vertical electrical soundings (VES) and two wide profiles of Control Source Electromagnetic (CSEM) forward step at Hammam Faraun and two wide profiles of CSEM at Abu Swiera. The geophysical techniques yield information on the spatial distribution of electrical conductivity, which is the most sensitive parameter to fluids in the rocks.
The analysis of the geophysical data, together with the field and geochemical studies lead to the conclusion that, the thermal water in the subsurface formations might be considered as the preferred cause of the high conductivity in the subsurface on/close to the boarder of tectonically active regions, particularly, where the anomalous conductivity is correlated with high heat flow and other geophysical and geological parameters.
Key words: Hammam Faraun, Abu Swiera, vertical electrical soundings, control source electromagnetic, conductivity of subsurface.
RESUMEN
La potencialidad de la energía geotérmica en Egipto tiene una importancia menor en los aspectos de la vida de los Egipcios, comparado con los recursos hidráulicos y de hidrocarburos. Sin embargo, algunas aplicaciones de la actividad geotérmica, como el calentamiento directo, las piscinas y la fisioterapia, hacen de la investigación de la energía geotérmica necesario. En el presente trabajo, dos localidades con potencialidad geotérmica bastante buena serán estudiados; éstos son Faraun y Abu Hammam Swiera (la temperatura del agua es de aproximadamente 70 °C, en la península del Sinaí).
Debe considerarse la contribución de las técnicas geofísicas para evaluar el potencial así como la capacidad para identificar las características del reservorio, y su aplicación. Un programa de prospección geofísica se realizó por medio de diecisiete Sondeos Eléctricos Verticales (SEV) y dos de gran perfil con fuente Electromagnética controlada (CSEM) en Hammam Faraun y dos grandes perfiles CSEM en Abu Swiera. Las técnicas geofísicas muestran información sobre la distribución espacial de la conductividad eléctrica, que es el parámetro más sensible a los fluidos en las rocas.
El análisis de los datos geofísicos, junto con el campo y los estudios geo-químicos llevan a la conclusión de que, el agua termal en las formaciones del subsuelo podría ser considerada como la causa de la alta conductividad en el subsuelo o cerca del borde de la regiones tectónicamente activas, en particular, donde la conductividad anómala se correlaciona con el alto flujo de calor y otros parámetros geofísicos y geológicos.
Palabras clave: Hammam Faraun, Abu Swiera, sondeos eléctricos verticales, control de código fuente electromagnética, conductividad de superficie.
1. Introduction
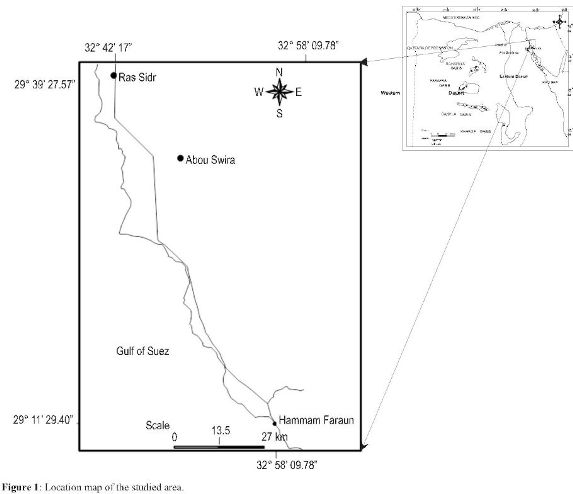
Two sites have been selected to study the geothermal occurrences in the central part of Sinai Peninsula; Hamam Faraun and Abu Swiera close to the Gulf of Suez (Figure 1). As shown, the studied areas are located on the eastern side of the Gulf of Suez region which represents one of the most prolific and prospective oil provinces in Egypt. The area includes a number of oil fields such as Assel oil field. Hamam Faraun lies at 29° 11' 55.18"N and 32° 57' 18.64'E and the elevation is about 9 m above sea level, while Abu Swiera area lies 29° 32' 47.44"N and 32° 48' 38.60'E and the elevation is about 44 m above sea level. To spot more light on Hamam Faraun and Abu Swiera Hot Springs, we carried out Vertical Soundings (VES) and an approach to utilize planshet Control Source Electromagnetic (CSEM) wide-profiles crossing the geothermal active fields. The main aim of this study is to analyze the geophysical, geochemical, and also the geological feed back in order to define the significant tectonic patterns, which are responsible for the structural development of the geological units at the area of study. The study resulted in understanding of the hydro-geother-mal regime at Hammam Faraun and Abu Swiera through the evaluation of the subsurface imaging and the capability for investment projects.
2. Geology and tectonics of Central Sinai Peninsula
The central part of Sinai province represents a tectonic specific belt put it as one of the most prolific and prospective oil provinces in Egypt. In the early tertiary period (Oligocene -Miocene), where the opening of the Red sea rift, some volcanic activity took place. In western and central Sinai, there are a number of basaltic bodies mostly of doleritic dikes, sills and plugs; flows are known near to Abu Zenima and Hammam Faraun (Meneisy, 1990). The major geological structural feature of the study area is a well-defined fault block oriented NNW-SSE, which tilts strongly eastward on its western side. Also there is a fault escarpment overlooking directly the Gulf of Suez and rising about 300 m above the Gulf (El-Shinnawi, and Sultan, 1973).
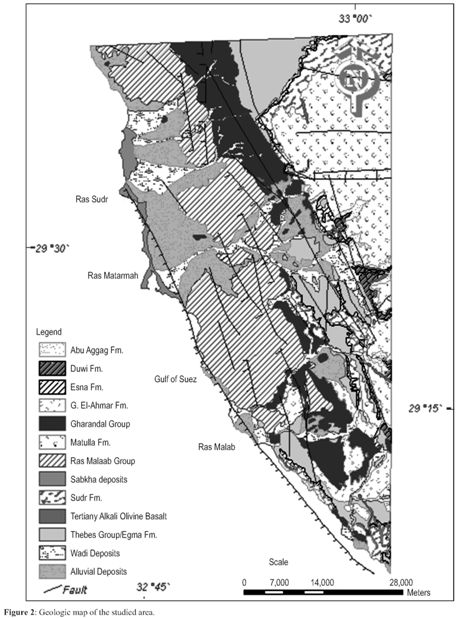
Hamam Faraun area is one of more vigorous topography because of the presence of several local mountain areas (Gebel Hammam Faraun and Gebel Tall) of altitudes varies from 50 to 480 m above sea level. The shallow geological succession in Hamam Faraun area (Fig. 2) could be, mainly, distinguished into the following formation (Said, 1962):
1. Post-Pliocene composed of sand and conglomerate of about 50 m thickness.
2. Pliocene rocks, differentiated into sand, sandy limestone, and lagoonal gypsum deposits of thickness about 50 m.
3. Miocene and Oligocene rocks which composed of gypsum, sandy marl and conglomerate with total thickness of about 70 m.
4. Eocene rocks of total thickness 100m, which can be differentiated into, upper Eocene of limestone and sandstone, Middle Eocene of shale and limestone, and Lower Eocene of chalk and flinty limestone.
5. Upper Cretaceous rocks which are composed of shale with minor limestone.
As for Abu Swiera hot spring, from the geological point of view, the area is a triangular excavation represents the synclinal trough to the southwest of El-halal anticline massif.
The head of this triangle is directed northward while its base measures a length of about 25 km facing Gebel Kharim in the south. The length of this plain attains about 50 km. Its ground elevation decreases northward from 300m at its base to about 190 m atits apex. The surface ofthese plains is dottedby numerous mesas andbuttes,whichformedofearlyEocenelime-stone with cherty bands. This surface is dominated by washed, dark angular to sub-angular cherty and limestone fragments. Locally, these plains are covered by active sand dunes, which form several lines of isolated branches. The area is controlled by three different tectonic provinces related to northern part of the African plate (Said, 1962). These are the northern Egypt fold belt, NE-SW (Syrian arc system) and the Suez rift which is younger than north Egypt fold belt, is dominated by NW to NNW oriented normal faults.
3. Hydrothermal regime at the study sites
At Hammam Faraun, the spring issues thermal wateratthe foot of the Gebel from fractured karstifed dolomitic Eocene limestone Formation. The spring seepages were estimated to 880 m3/d (El- Ramly, 1966), 3000 m3/d (Himida and Diab, 1976). These seepages are drained through minor channels mixed with the gulf water. The thermal seepages are tested from Hammam Faraun cave. H2S gas is present with its characteristic odor. The thermal water seepage and flow toward the gulf water. Issar et al. (1971) proposed a thermal flow mechanism in which a sequence ofaquifers is interconnected by means ofa system of faults and fractures zones, resulting in the occurrence of springs at the surface. The contribution of various aquifers to the total outflow ofspring is regulated by their relative and absolute potentials. All the pressure in these formation caves depleted with time, an Eocene aquifer located at higher level began to flow and continues to do so to the present day.
ElRefeai (1992) and El-Kiki etal. (1992) carried out a cluster analysis of the hydrochemical variables for wells and springs tapping the deep aquifers in the Gulf of Suez region. The produced dendrogram differentiate the Eocene aquifer from the underlying (Nubia aquifers) and the overlying Miocene one. In this dendrogram the Hammam Faraun spring was designated as a member in the cluster of Eocene aquifer in the region.The underlying Esna shale is considered as the aquiclude, which separates the Eocene beds from the underlying aquifer (Nubia). However, the interconnection through the faults and fracture zone should not be completely disregarded. Issar et al. (1971) conceived an evaluation history of the formation waters in the Gulf of Suez region which the Eocene aquifer is a product of mixing, through fracture system, between ancient seawater and Pleistocene meteoric water. Unfortunately, no more work related to Abu Swiera hot spring.
4. Approach to use the Control Source Electromagnetic (CSEM)
Concept of CSEM
The demand to the enhanced geophysical technique and device, in addition to the precise analytical interpretation ofthe geophysical data, is the resolution of the geophysical complex research, especially by the absence of priory information about the researched place. The device for use the planshet method of electromagnetic induction (Hachay O. A., 1997a, Hachay O. A. and Bodin, 1997b, Hachay O. A. et al., 1999, and 2000, Hachay O. A., 2002 ) in the frequency domain was developed by Chelovechkov A.I. The method was adapted to map and monitor the high complicated geological mediums, to determine the structural factors and criteria of stability of the rock massif in the mine subsurface. The field observation and the way of interpretation make the new technology differ from other known earlier methods of field raying or tomography (Hachay O. A. and Novgorodova E. N., 1997c, Hachay O. A. et al., 1999, and 2000, and Lau K.H., and Cheng P. 1977).
The concept to research the 3D geoelectric medium is based on interpreting the alternating electromagnetic field in the frame of a block-layered isotropic medium with inclusions over three stages (Hachay 1997a, and 2002); in the first stage, the geoelectric parameters of the horizontal block-layered medium, which includes the block heterogeneities, are defined, in the second stage, a geometrical model of the different local heterogeneities or groups inside the block-layered medium is constructed based on the data of local geoelectrical heterogeneities, while in the third stage, the surfaces of the searched heterogeneities could be calculated in account of the physical parameters of the anomalous objects.
sions over three stages (Hachay 1997a, and 2002); in the first stage, the geoelectric parameters of the horizontal block-layered medium, which includes the block heterogeneities, are defined, in the second stage, a geometrical model of the different local heterogeneities or groups inside the block-layered medium is constructed based on the data of local geoelectrical heterogeneities, while in the third stage, the surfaces of the searched heterogeneities could be calculated in account of the physical parameters of the anomalous objects.
Obtainable field data
For practical realization of that conception, the system of observation for alternating electromagnetic field with use of vertical magnetic dipole was elaborated. Such local source of excitation and regular net of observations allows realizing overlapping by different angles of observation directions. As incoming data for interpretation, modules of three components of magnetic field are used. For the case on surface observations the data are measured on the Earth's surface at the set of distances between the source and receiver as a function of frequencies. The measurements of the module of three components of the magnetic field (vertical |Hz| and two horizontal: one directed to the source |Hr| and second perpendicular to that direction |Hp|) are provided in the frame of planshet for the fixed net with fixed step and fixed length of the planshet's side. In the frame of profile observations the planshet become to a band or a line and the length of the band or the line is a base of observations or an array. For the variant of the wide profile (band) the source of excitation is located at the beginning of the array on the profile, which is parallel to the measured profile. We shall call that a wide array. It moves systematically with a fixed step of meters. For the variant of a usual profile the source is located on the measuring profile and the moving of the oscillator is similar. For the variant of aplanshet survey the source is located into the center of the planshet using the fixed net of observation. Then the planshet array moves systematically with overlapping usually on the half of the planshet.
Processing and interpretation of CSEM data
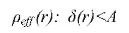
For each array and fixed frequency ra two interpretation parameters are defined:

Where ρeff (r) is the apparent resistivity, r is the distance between the source and the point of observation, ω is the frequency f multiplied by 2π, |Hz| is the module of the vertical magnetic component, |Hr| is the horizontal component of magnetic field oriented to the source, π = 3.14, δ(r) is the parameter of geoelectrical heterogeneity, and |Hφ| is the second horizontal component of magnetic field perpendicular to the direction of the source.
That data are the information base for the further interpretation. On the first stage we define the geoelectrical parameters of the 1-D section for each array and each frequency after the preliminary filtration of the data:
where A is a level of data filtration to the area of inverse problem operator for one-dimensional medium (Hachay O. A., 1997a).
The interpretation is made in a frame of n-layered model for each array and planshet location. After that each point of the planshet is associated with one and only column of layers thicknesses and corresponding fixed column with resistance of the medium in that layers. Gathering information of all planshets together we obtain a many-valued function of each point - distribution of thicknesses and resistances of the medium layers. Then we calculate the average value for these distributions for each point of the observation set. Thus we obtain the unique distribution of thicknesses of horizontal layers and resistances, which corresponds to the medium model as a cylinder with vertical axis and with a rectangle at the bottom and with a point of observation located in its center. Thus we change over layered model to a block-layered model. Then, gathering the values of thicknesses and resistances for all points of observation, located on one and the same profile we obtain the file of an average cross-section along the profile.
The next step is combining the neighboring blocks with close-range values of resistance to one block. That operation is made according to the fixed scale of resistance.
The second stage of interpretation is used to define the geometrical characteristics of conductive inclusions and their equivalent moments, which are proportional to the ratio of the conductivity difference in the host rock and in the inclusion to the conductivity in the host rock. Here the approximation principle is used for alternating electromagnetic fields. The initial model of the inclusion is a current line of fixed length. That approximation construction is used for fitting of the average parameter of geoelectrical heterogeneity, which is calculated as an average value of 8 in each point of the profile, located in each point of the profile (Hachay O. A., 2002).
5. Hammam Faraun Site
Hamam Faraun area is characterized by several hot springs lying at the foot of Gebel H. Faraun along, a more or less, straight line extending about one km along the Gulf of Suez coast. The fault forms a steep cliff bordering the Gulf of Suez. Two groups of thermal springs are found. The northern group (70 °C) issues on land while the southern group emerges beneath the surface of the Gulf's water. The cliff above the spring is composed of dolomite. A geological examination of the area (Moon and Sadek, 1923) indicates a gradual progressive change from dolomite through dolomitic limestone to limestone as one proceeds from the cliff inland. The heat source for these springs is probably derived from high heat flow and deep circulation controlled by faults associated with the opening of the Red Sea and Gulf of Suez rifts. It is supposed that the spring's water is presumably a mixture of brine and water of Pleistocene contained in the Nubian sandstone aquifer which infiltrated the outcrops on the highland of Sinai and emerged along the fault lines bordering Sinai Peninsula (Magaritz & Issar, 1973).
6.1 Geophysical measurements
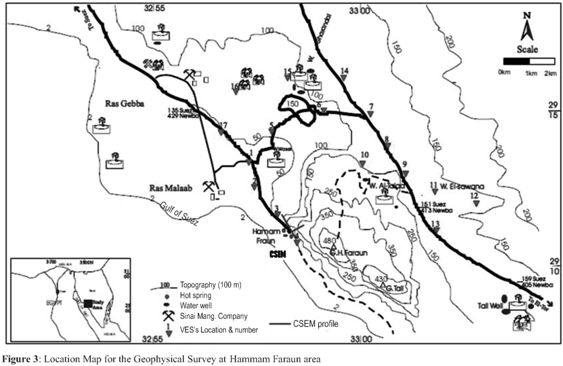
6.1.1 Vertical Electrical Soundings (VES); At the area around Hammam Faraun, Seventeen Vertical Electrical Sounding (VES) have been surveyed to AB/2 up to 1000 m in successive steps. The VES locations have been chosen on the basis of the accessibility and applicability of the Schlumberger method (Figure 3).
The apparent resistivity curves have been inverted into one dimension model using the least square method to give a multi layered resistivity model whose response fits the measured sounding curve. Zohdy's method has been applied to the observed data. The output of Zohdy's method has been used as a starting model in the Marquardt's method to get the best fit for the observed data. Figure (4) shows the resistivity distribution in the study area. A general outlook to the interpretation of the VESes curves reveals that, the number of the interpreted layers is varying from five to seven layers through the study area. The true resistivity of these layers is varying from 0.2 to over 3000 ohm-m, while the thickness varies from 0.9 to 291 m.

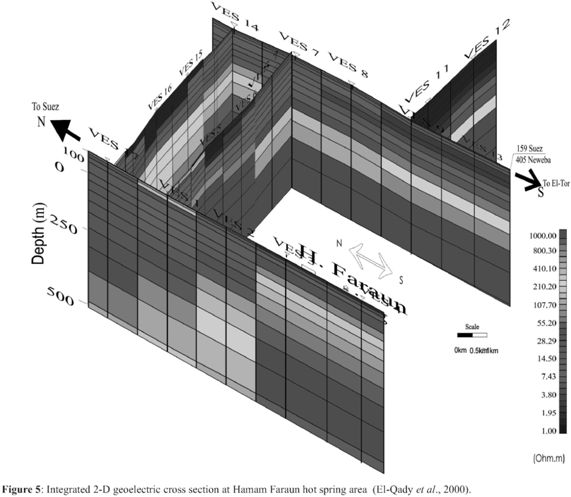
El-Qady et al, (2000) had conducted the 2D inversion for the same data set using an algorithm based on the ABIC (Akaike Bayesian Information Criterion, Akaike, 1980) algorithm to obtain convergence to a solution with the optimum smooth ness using a Finite Element calculation mesh. The integrated 2-D geoelectric cross section is illustrated in Figure 5. The analytical reread of the site via resistivity distribution shows the relation between the hot springs place and the extensional cave inside Gebel Faraun, while this place describes a resistive strata setting forming the massive base and extending inward the mountain, where the cave shows higher temperature as man goes more inside. Then it is supposed that the hot water comes through the fractures connected to this base.
5.1.2. CSEM data
The observation system at Hammam Faraun includes the measurements along two wide profiles (Fig.3); a longitudinal profile on the road band between the mountain and the shoreline of the Red Sea, and a traversal profile. The longitudinal wide profile is of 400 m length and the band width of the profile is 20 m, the distance between the observations points is 25 m, and between the source locations is also 25 m. The outlet of thermal hot waters is located on the profile between the 4th and 5th pickets of the observation points. The traversal wide profile begins at the sea shoreline traversing the road band and climbing the mountain margins, its length is 95 m and the band width of the profile is 10 to 15 m, the observations are carried out on 5 m separated points, while the distance between the sources of excitation is 15 m. The transversal profile crosses the longitudinal wide profile at the pickets 17th and 18th.
The distribution of the average parameter of the geoelectrical heterogeneity at referenced frequencies for both the longitudinal and traversal wide profiles is shown in figure (6a and b) respectively. On figure (6a), for the frequency 5.08 kHz and starting from the 7th picket of observation, local anomalies and raising of the background component of the parameters could be clearly noticed, the largest values of the average parameter of geoelectrical heterogeneity are recognized for the frequency 2.54 kHz on the pickets 13 and 15. The values of the traversal wide profile (Fig.6b) are significantly lower in comparison with the longitudinal wide profile, which testifies the more homogeneous structure of the massif in the transversal direction. Approximately to the middle of the profile (picket 11) there are anomalies in the distribution of the parameter on the frequency 0.635 kHz, for the second part we see the increasing of its values for higher frequencies, what can testify the more homogeneous structure for that places on the deeper depths.
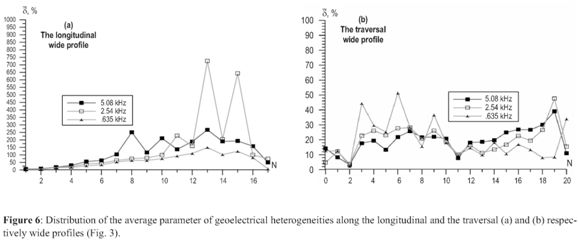
Figure (7) shows the geoelectrical cross sections with blocked structure and distribution of crack zones in the massif at the three controlled excitation frequencies. On the sections, the contact of the block structure on the pickets 3 and 17 could be sharply seen. The visual inspection and the geological survey show that zones are looking from the surface as faulted and cracked zones. The geoelectrical structure of the block from picket 3 to 17, beginning from the depth 92 m practically does not change its characteristics. It testifies that for increasing the resolution for deeper areas we must increase the base of observation and use lower frequencies with the same step of observation.
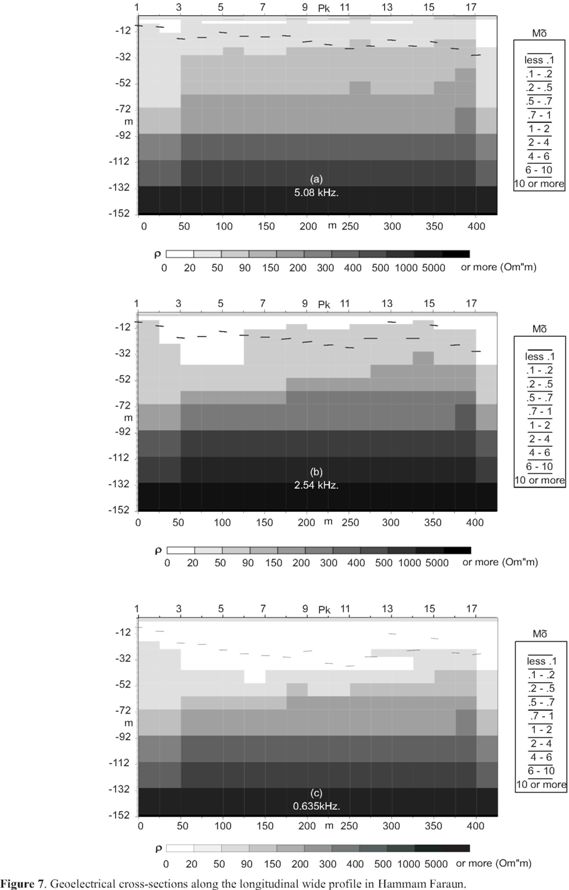
Approximately up to 72 m on the blocked sections, the thermal outlet is situated together with cracked and very conductive rocks, around the 11th picket of observation, the cracked zones reach about 40 m depth. On the section representing the frequency 2.54 kHz (Fig. 7b) and at the pickets 2-6, the block of rocks with low resistance, which are linked with the zones of outlet and location of high hot thermal water is well mapped. On the same section we see a near surface structure (up to 12 m), which is linked with the outlet of the vertical fault zone, which is linked with the contact. The results of observation on the frequency 0.635 kHz testify and increase that conclusion. Thus the provided electromagnetic induction observations on the three frequencies give the information about the geometry of the thermal reservoir and also about the degree of rocks faulting, of which consists the block. The last information Figure (8) represents the detailed geoelectrical cross-sections, which had been constructed for the data of the traversal wide profile for the three frequencies. That section reflects the geoelectrical characteristics in the vicinity of the contact with the block of the first wide profile. From the depth 52 m the cross sections for all frequencies show the same block structure: on the 9th picket, on the depth 92-112 m we see a contact in the high resistance bottom of the section. The conductive rocks are situated averagely up to the depth 30 m, and the crack zones of weak intensity up to the depth 12 m.

6. Abu Swiera Site
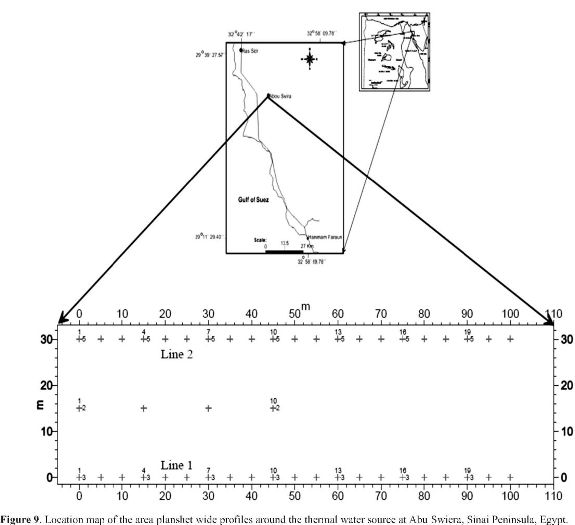
At this site we carried out CSEM survey only. The electromagnetic observations measured around the thermal sources outlet has been provided using the method of area planshet survey: in which, the sources of excitation has been located on a middle profile between two receiving profiles (observation lines) forming an area planshet. The distance between the excitation source profile and the observation profiles is 15 m, while the points of observation have been situated with a step 5 m. The length of the observation profiles reached 100 m using two controlled source frequencies are 5.08 kHz and 0.635 kHz (Fig. 9). The distribution of the average parameter of the geoelectrical heterogeneities along Line 1 and Line 2 within the area planshet wide profiles is shown in figure (10).
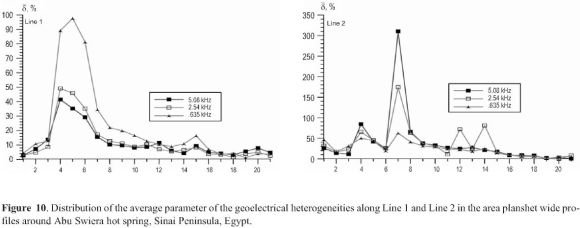
The geoelectrical cross-sections are shown in figure (11) as (a) and (b) are for Line 1 and (c) and (d) are for Line 2.
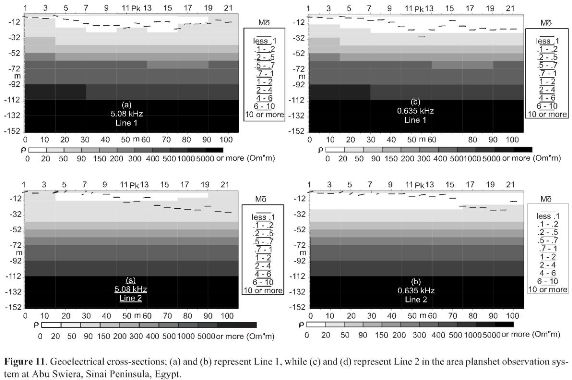
The results testify that the search of the source of the hydrothermal system and the inlet channels to their outlet on the surface is a very complicated structural, manly ranged problem and demands methods with high resolution and high comprehensiveness. So for the band 30 m for the obtained geoelectrical cross sections we see the difference in the blocked structure, beginning from the depth 52 m. Similar differences are in the upper levels of the sections and in the crack zones location. If we take into account, that the place of the outlet location of the source of the hot water was known, the picket 2 on the source profile, so we can formulate recommendations for using that method together with other geophysical and geochemical methods for solution of the problem for searching the state of the geothermal system.
7. Geochemical analysis
This study has been done to estimate the variation of the chemical composition of the geothermal waters and to determine the subsurface temperature of the water reservoirs in these regions. Chemical geothermometers are applied to the hydrochemical data. Also, the hydro-geochemical characteristics of the collected thermal water from hot springs are taken in consideration.
7.1. Material and methods
Two groups of geothermal water samples have been collected from Hammam Faraun and Abu Swiera hot springs. Their locations are illustrated in Fig. (1). It is found that the total dissolved salts content range from 6053.49 to 12687.1 ppm. The samples of thermal water were stored in polyethylene bottles. The electrical conductivity (EC), temperature and pH values of the geothermal water samples were measured after taken from the field directly. The chemical analysis of underground water samples were carried out in laboratory of the Ministry of Agricultural in Cairo, to calculate the values of Na, K, Mg, Ca, Cl, SO4 and HCO3 (mg/l), results are listed in Table(1). The results have been evaluated by applying the Aquachem (Calmbach, 1997) and Wateq (Truesdell and Jones 1974) programs.
7.2 Classification of water chemistry data
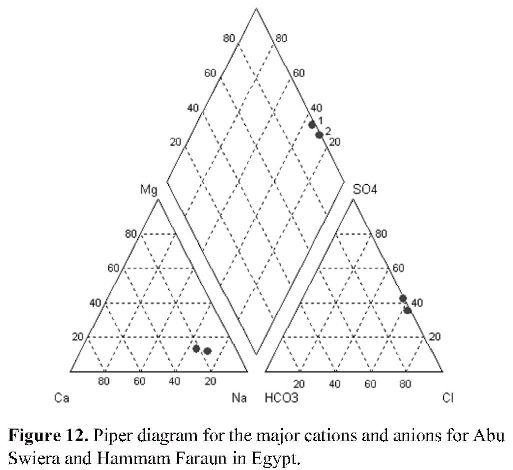
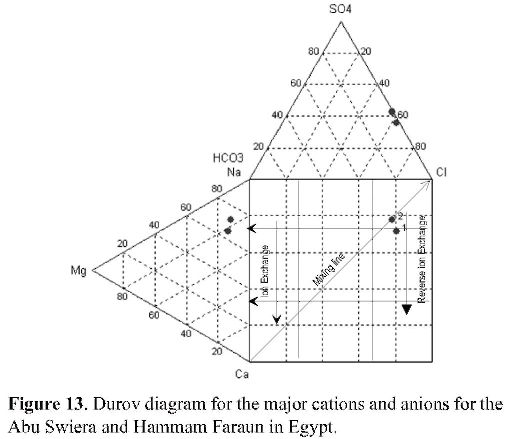
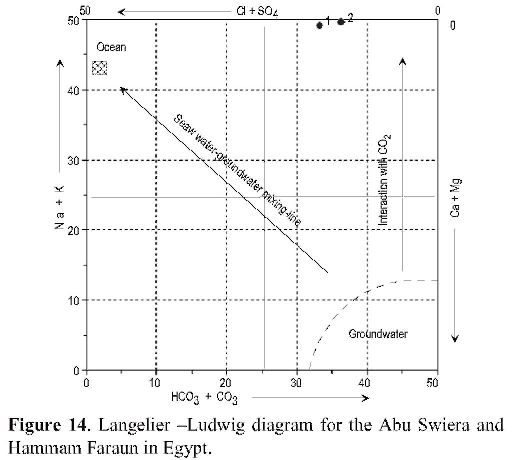
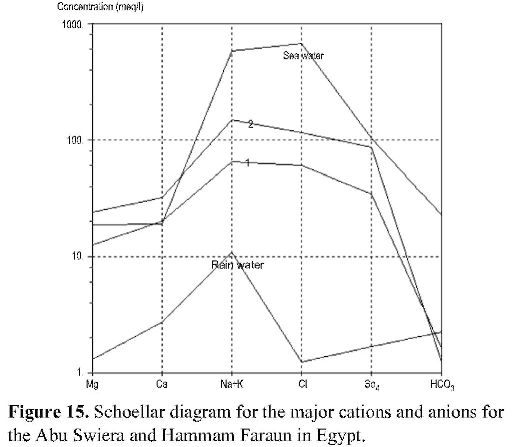
Graphical and statistical methods were used to classify the water sample into groups. Piper, Durov, Schoeller and Langelier- Ludwing, and Q- mode cluster analysis were applied as follows; Piper diagram (1944) that modified by Langguh (1966) shows that samples numbers 1 and 2 are alkaline water with prevailing sulfate chloride (Fig.12), Durov digram (Llyod and Heathcoat, 1985): Figure (13) shows the sample numbers 1 and 2 have Cl and Na dominant frequently indicate the end point of water, Langelier -Ludwing diagram (Fytikas et al, 1989): shows that the samples are Na-SO4 water types(Fig.14), and Schoellar diagram (1962) applied on the collected samples and shows that the samples numbers 1 and 2 are similar to each other reflect the same aquifer characters (Fig.15). When correlation with Gulf of Suez and rain water , we fiend that sample numbers 1 and 2 related to rain water and affected by Gulf of Suez water with different ranges.
7.3 Cluster analysis
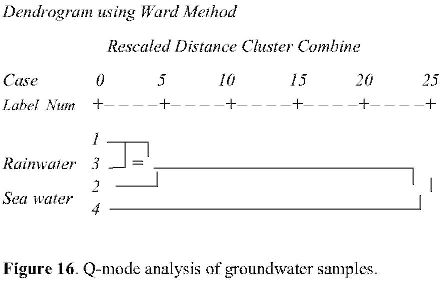
The cluster analysis has been applied using the statistical package (SPSS 13).The Euclidean distance as similarity measurement together with Word "s method for linkage has been used to produce grouping. A dendrogram of Q-mode cluster analysis (Fig.16) shows two groups, the first contain the sample number 1 and rain water have similarity at distance cluster 1 and sample number 2 at distance cluster 2.5.The second group contain Gulf of Suez water. This coincidence the affect of rain water is more than the Gulf of Suez water.
7.4 Principal component analysis (PCA)
The principal component analysis (PCA) has been extensively applied to different the samples to be compared and give finer prints to identifying the origin of the chemical origin (Fig. 17). PCA results declare the contribution degree of variation in the data of the study area. 60.201 % 1st PC 35.186% for 2nd PC and 4.613 %for 3rd PC of data set. The 1st PC is strong positive distribution of the loading values for TDS, Cl, SO4 and HCO3 and moderate positive loading on pH, Mg and Ca but negative with K. These ions have dominant contribution to the explanation of the PC1. The strong positive terms are due to dissolution of salts of the geological components. The factor 2 is Ca enrichment factor. The presence of dissolved carbonate might enhance or suppress adsorption and forming precipitates. Factor 3 has strong positive loading with Ca, Mg and SO4, moderate with TDS, Na and small with Cl. The negative loading with K and HCO3, suggesting that two have the same source of fresh water resulting from dissolution by the rain water.
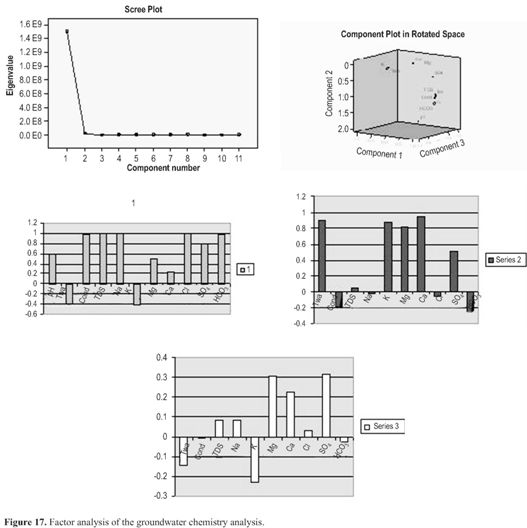
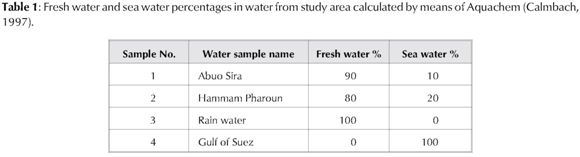
Table 1 shows the percentage of Gulf of Suez and rain water calculated by means of Aquachem (Calmbach, 1997) by optimizing Cl and TDS mass balances.
The water samples numbers 1 and 2 having 90 % and 80% from rain water respectively. These indicate that sample no.2 is affected by Gulf of Suez water than sample no.1. Then, the salinity of Hammam Faraun is higher than that of Abu Swiera spring. The acquired salinity of Hammam Faraun is probably, resulted from their mixing between the Eocene aquifer (similar to the Abu Swiera water) and the presented seawater due to its location at the seashore or to the product of rock-water interaction.
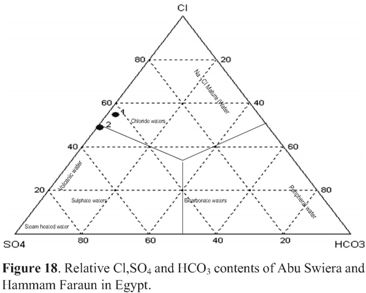
CI-SO4-HCO3 Ternary diagram (Fig.18); according to Giggenbach, 1988, and Giggenbach and Goguel, 1989) shows that sample no.1 mature waters while sample 2 lie on the line between chloride water and volcanic water.
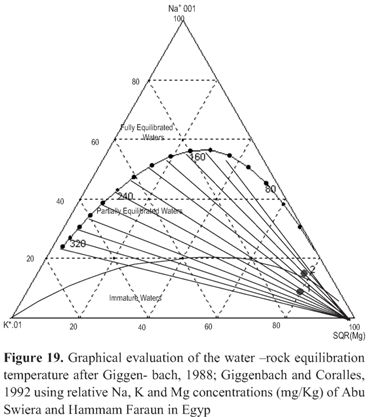
Na-K-Mg diagram (Giggenbach, 1988) (Fig.19) is used to differentiat between immature, partially equilibrated and full equilibrated water. It predicts the temperature ofreservoir and the relationship of equilibrium of the water and host rock. The sample no.2 lies on the line between immature water and partially equilibrated water. It lies between temperature lines 160 and 180 °C as sample no.1 lies between lines 240-260 °C.
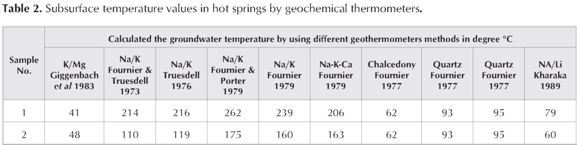
In this study, temperature of the hydrothermal aquifer has been evaluated by using geothermometers methods through Aquachem Program (Calmbach, 1997) and tabulated in Table (2).
8. Discusion and conclusion
Two sites have been selected to study the geothermal occurrences in central part of Sinai Peninsula; Hamam Faraun and Abu Swiera close to the Gulf of Suez. The geophysical measurements on both sites showed that the uppermost 40 meters are cracked low resistive medium connected to a massive resistive base rock. This base rock could be the container of thermal water or at least adjacent to the source of heating. Practically, this can be evidenced by the extensional cave in Gebel Faraun heart, where the more inside in lateral and downward directions results the raise in temperature, which might be interpreted as being closer to the heat source.
Now it becames an objective need of developing a complex direction of research, which must ensure the theoretical base of exploration and operation of geothermal deposits. That direction must include all key problems, which are linked with their developing such as:
1. Developing of geological models of geothermal deposits on the base of detailed geological mapping of volcanic magmatic complexes, which are sources of heat feeding of hydrothermal systems and revealing of the hydrothermal reservoirs structure.
2. Providing and interpretation ofthe geophysical data on the base of models, which are adequate to the geometry of the geothermal reservoirs in the volume, research of the headrace, along what moves the heat flow. In that case, a very informative method (Control Source Electromagnetic induction frequency -geometrical research) which is introduced in this paper shows the capability to provide the adequate resolution to analyze and probably solve the geothermal problems.
3. The development models of geophysical and geo-chemical character, which are used for revealing of the flow picture and estimation of the dynamical characteristics of the heat flow on the base of the geophysical monitoring data.
The geochemical analysis to the two samples groups showed that the TDS is ranging from 6053.49 to 12687.1 ppm, the water chemistry was classified as alkaline water with prevailing sulfate chloride (Piper diagram), the existence of Cl and Na as dominant frequently indicates the end point of water (Durov diagram) and a relation to rain water affected with the gulfwater was concluded. The interpretation ofthe factor analysis model is matching well with all results of Sholler analysis and Aquachem program as the thermal water were a mixing with meteoric water explain the hydrochemical variation of the thermal water within the Eocene aquifer.
The present study concludes that the two sites are excellent places for investment in thermal water utilization just for aqua thermal pools, thermotherapy, and thermal basins.
9. References
Akaike, H. (1980). Likelihood and Bays procedure, In area, Egypt, Actas Geol. Hungaria, Vol., 17, 469-493. [ Links ]
Calmbach, L. (1997). Aquachem computer code version 3.7.42, Waterloo, Ontario, Canada N2L, 3L3. [ Links ]
El-Kiki, M. F., Eweida , E. A. and ElRefeai A., A. (1992). Hydrogeology of Suez Rift Border Province. Sinai, Egypt, 3rd Conf. Geol. Sinai Devlop. Suez Canal Univ. Ismailia, Egypt, 77-90. [ Links ]
El-Qady, G., Ushijima, K., and El-Sayed.A. (2000). Delineation of a geothermal reservoir by 2D inversion of resistivity data at Hamam Faraun area, Sinai, Egypt, Proceedings World Geothermal Congress 2000, 1103-1108. [ Links ]
El-Ramly, I. M. (1966). Recent review of the thermal springs in the northern regions of Suez Gulf, Proc. Inter. Cong. Thermal waters. Geothermal energy and volca-nism of the Mediteranian area . Nat. Tech. Univ Athens Greece. V. 2, 292-304. [ Links ]
ElRefeai, A.A. (1992). Water Resources of Southern Sinai, Egypt. PH.D. Thesis, Fac. Of Science, Cairo. Univ. [ Links ]
El-Shinnawi M. A. and Sultan, I. (1973). Lithostratigraphy of some subsurface upper cretaceous sections in the Gulf of Suez area, Egypt, Actas Geol. Hungaria, Vol., 17, 469-493. [ Links ]
Fytikas, M. (1989). Updating of the geological and geother-mal research on Milos island, Geothermics 18, 485-496. [ Links ]
Giggenbach, W. F. (1988). Geothermal solute equilibria. Derivation of Na-K-Mg-Ca geoindicators. Geochim. Cosmochim, Acta 52, 2749-2765. [ Links ]
Giggenbach, W. F. and Goguel, R.L. (1989). Collection and analysis of geothermal and volcanic water and gas discharges, Dept. Sci. Indus. Res. Rept. CD2401, Petone, N.Z., 69-81. [ Links ]
Hachay O. A. (1997a). The three - stage concept ofcommon interpretation for 3-d electromagnetic and seismic fields and some results of its practical realization, Engineering and environmental geophysics for the 21-st century. 1997. China, Chengdu. 286-292. [ Links ]
Hachay O. A. and Bodin V. V. (1997b). Novgorodova E.N., Bodin Vd.V., Hachay A. Yu., Hinkina T.A. A new complex near-surface electromagnetic and seismic technique for 3-d research of inhomogeneous and unstationary medium, Engineering and environmental geophysics for the 21-st century. 1997. China, Chengdu. 181-189. [ Links ]
Hachay O. A. and Novgorodova E. N. (1997c). The experience of area induction research of sharp heterogeneous geoelectrical medium, Fizika Zemli. 1997, N°5. 60 -64. [ Links ]
Hachay O. A., Novgorodova E. N, and Bodin V. V (1999). About the problems of near surface geoelectricity and some results of their solution, Fizika Zemli, 1999, N°5, 47-53. [ Links ]
Hachay O. A., Novgorodova E. N.and Hachay A. Yu. (2000). Mapping of 3-D conductive zones with use of area systems of observation in a frame of 3-D frequency-geometrical method, Geology and geophysics, 2000, V.41,.N°9, 1331-1340. [ Links ]
Hachay O. A. (2002.A). New conception of active and passive electromagnetic 3-D monitoring of volcanoes and active faults, III International Workshop on magnetic, electric and electromagnetic methods in Seismology and Volcanology, Moscow 2002, RAS. 169-171. [ Links ]
Himida, I., H. and Diab, M.S. (1976). Hydrogeology of the thermal springs in the northern regions of Suez Gulf, Egypt, Proc. Inter. Cong. Thermal waters geothermal energy and volcanism of the Mediterranean area. Nat. Tech. Univ. Athens. Greece,V.2, 229-304. [ Links ]
Issar, A., Rosenthal, E., Eckstein, Y. and Bogoch, R. (1971). Formation waters, Hot springs and mineralization phenomena. Along the Eastern shore of the Gulf of Suez, Bull. Inter. Assoc. Sci. Hydro. Vol. XVI, No. 39. 25-44. [ Links ]
Kiruchin A.V. and Sugrobov V.M. (1987). The models of heat transfer in hydrothermal systems of Kamchatka, M.:Nauka. 1987, 151. [ Links ]
Langelier,W. andLudwig, H. (1942). Graphical methods for indicating the mineral character of natural waters, Journal of Water Works Association 24, 335-352. [ Links ]
Langguh, H. R. (1966). Die groundwasserverhältnisse im bereich des velberter sattels rheinisches schiefergebirge .Der minister für ernãhrung, landwirtschaft und forsten, NRw, düsseldorf.(unpublished). [ Links ]
Lau K. H. and Cheng P. (1977). The effect of dike intrusion on free convection in conduction-dominated geother-mal reservoirs, Intern .J. Heat and Mass. Trans., Vol.20, N11. 197-209. [ Links ]
Lloyd, J.W. and Heathcoat, J.A. (1985). Natural Inorganic Chemistry in Relation to Groundwater, Clarendon Press, Oxford. [ Links ]
Magaritz, M. and Issar, A. (1973). Carbon and Oxygen isotopes in epigenetic hydrothermal rocks from H. El-Farun, Sinai. Chemical Geology, 12, 137-146. [ Links ]
Meneisy, M. Y. (1990). Volcanicity, Chapt.9, In Said, R.(Ed.)1990. Geology of Egypt, Balkema Pub. Rotterdam,Netherlands, 157-172. [ Links ]
Moon, F. W. and Sadek, H. (1923). Preliminary geological report on Wadi Gharandal area, Petrol.Res.Bull.Cairo, 9-40. [ Links ]
Piper, A. M. (1944). Graphic procedure in the geochemical interpretation ofwater-analyses, AmericanGeophysical Union Transactions 25, 914-923. [ Links ]
Said, R., 1962: The geology of Egypt, Elsevier, Amsterdam-New York, 1-377. [ Links ]
Schoellar, H. (1962): Les Eaux sutterraines. Masson et cie, 67, Paris, 1962. [ Links ]
Sugrobov V. M. (1970). Evaluation of operational reserves of high-temperature waters Geothermics, Spec.Iss. N2.P.1256-1260. [ Links ]
T.H. (Eds.), Thermal History of Sedimentary Basins; Methods and Case Histories. Springer, Berlin, 99-117. [ Links ]
Truesdell, A. H. and Jones, B. F. (1974). Wateq, a computer program for calculating chemical equilibria of natural waters, Jour. Research, U.S.Geol. Surv, 2, 233-248. [ Links ]

