


 English (pdf)
 Article in xml format
 Article references
 Send this article by e-mail
 Cited by SciELO
  Cited by Google
  Similars in
SciELO
Similars in
SciELO  Similars in Google
 Permalink
Introduction
Access to freshwater and energy is crucial for human survival and sustainable development. The rapid growth of industry and industrialization, especially in developing countries, has increased the demand for freshwater and energy (Assari et al., 2021). Only 3 % of the water on earth is suitable for human consumption, of which only 1 % is accessible, and the rest 2 % is frozen in the glacial poles, mountaintops, and streams (ONU, 2020). This has led humanity to seek alternative ways to get fresh water from the other 97 % of the oceans and saltwater wells (Singh et al., 2021). In addition, the overexploitation of natural resources, overpopulation, and its consequent environmental degradation are carrying humanity to a global water scarcity crisis, in which much of the water resources of the planet are subjected to high levels of pollution (Echeverría Molina y Anaya Morales, 2018).
In Colombia, droughts and desertification are problems that have been on the rise and persisted for decades without having a clear horizon of solutions. Colombian territory has dry areas in the regions of Orinoquia, Andean, and the Caribbean, with a level of desertification caused by erosion and salinization (Ministerio de Ambiente y Desarrollo Sostenible, 2022). Due to its geographical position, Colombia is favored with great availability of solar resources, as shown in Figure 1. The areas that receive the highest intensity of global solar irradiation, above 4.5 kWh/m2 per day, are the Islands of San Andrés and Providencia, large sectors of the Caribbean region, the departments of Vichada, Arauca, Casanare, Meta, Valle del Cauca, the north, south, and east of Antioquia, the center and north of Boyacá, the west of Cundinamarca, the east and center of Tolima, the north of Huila, the north of Cauca, the north of Nariño, the north of Norte de Santander and the southeast of Santander. The highest values (above 5.5 kWh/m2 per day) occur in small sectors in the center and north of La Guajira (Instituto de Hidrología, Meteorología y Estudios Ambientales [Ideam], s.f.-b). The areas with the lowest intensity of global solar irradiation in Colombia, with averages below 3.5 kWh/m2 per day, occur in sectors of western Chocó, western Putumayo, eastern Cauca, eastern, southern, and northwestern Nariño, and some small places of Caquetá, Huila, Cundinamarca, Quindío, Boyacá, and Santander departments (Ideam, s.f.-b). Therefore, exploring solar-based solutions for freshwater production could effectively address water scarcity and promote sustainable development in Colombia.
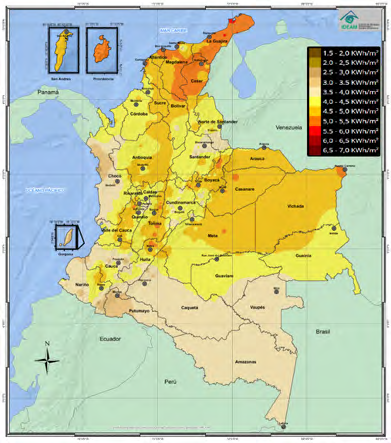
Note: Ideam (s.f.-a).
Figure 1 Multiannual average of the global irradiation received on a horizontal surface during the day in Colombia (KWh/m2 per day)
Desalination technology has been developed as a promising solution to address the global water scarcity crisis by converting saline water into fresh water. Among various desalination methods, thermal processes based on phase change have gained attention due to their simplicity and reliability (Khorshidi et al., 2019). One of the thermal desalination technologies is solar still, designed to mimic the natural process of evaporation and condensation for producing fresh water from brackish or saltwater sources (Elango et al., 2015). A typical solar still consists of a black base or tray containing the saltwater to be distilled and a glass cover with an appropriate angle of inclination (Edalatpour, Aryana et al., 2016). As shown in Figure 2, solar stills utilize the sun’s energy to heat the device’s interior, leading to the evaporation of the water in the tray and the vapor’s condensation on the glass cover’s interior surface. The condensed water droplets then flow along the inclined surface of the glass and are collected in a container placed below the still (Edalatpour, Aryana et al., 2016). The solar still is a simple, low-cost, and environmentally friendly device that can be easily constructed and operated, especially in areas with high solar radiation. It is a promising technology that can contribute to addressing the global water scarcity problem in areas with limited access to fresh water.
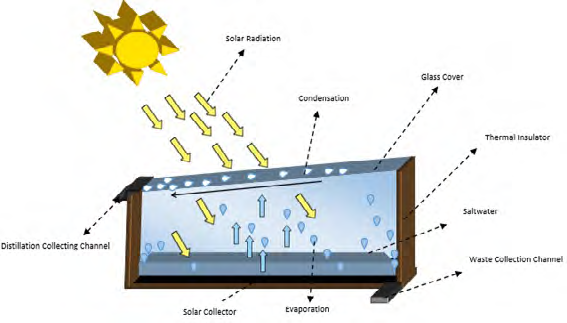
The performance of solar stills depends on the power of solar irradiation, the environmental temperature, and the shape and characteristics of the still. The principle of solar stills is to mimic the natural cycle of water, which begins with evaporation, using solar irradiation as an energy source. The simple effect of solar still comprises a box covered by an inclined glass. The box has a black bottom where the water to be evaporated is placed and occupies most of the box’s surface. A system of ducts for collecting distilled water. The water  evaporates with the action of heat absorbed by solar irradiation. This vapor adheres to the sloping glass cover, and it condenses. Next, the distilled water slide as droplets down the slope towards a collecting duct. Solar desalination technology provides these advantages environmentally friendly, fuel-free, and maintenance-free. Solar desalination is still the most basic method due to its easy setup, low operating costs, and clear design (Abdelmaksoud et al., 2021).
The development of sustainable initiatives such as solar stills is increasingly relevant to address the effects of global warming, framed in the context of adaptation and resilience strategies that focus on studying vulnerabilities in different regions and sectors, promoting sustainable practices, and urban planning, among others (Rojas et al., 2018). Vulnerable communities are often isolated and lack minimal sanitation conditions due to scarcity or contamination of water, which is often aggravated by their geographical location (Pan American Health Organization, 2017); hence, solar stills offer an effective solution for water purification in areas with limited access to clean water sources or unreliable infrastructure. By providing a decentralized and sustainable water purification method and harnessing renewable solar energy, a clean and abundant energy source instead of conventional energy sources, solar stills can enhance water security and resilience in the face of changing climatic conditions. However, the design of these devices can be challenging by the iterative process involved, and technological tools could simplify this. As can be seen in Prakash et al. (2022), design software is required for generating and evaluating prototypes and optimizing their performance by selecting the most suitable parameters. A simulation of solar thermal behavior and productivity still using Mathematica 5, a professional software (Fonseca-Fonseca et al., 2017). MATLAB® code was used to create a mathematical model of the tubular solar still (TSS) that estimated performance metrics such as the temperature of the tubular glass cover, the liner of the rectangular basin, the water in the basin, and productivity and efficiency (Nagrale and Dewangan, 2022).
These proposals have in common the possibility of offering the designer a vision of the actual behavior that the distiller might have in operation. This research aimed to develop the Simple Effect Solar Still (SESS) software, which enables the determination of freshwater production in a simple effect solar still through a distillation process. SESS utilizes fourth-order Runge-Kutta methods to solve a mathematical model consisting of differential equations representing the thermal behavior of the solar still. The software was validated by comparing its results with a real prototype tested in the climatic conditions of Bogotá, Colombia. SESS allows for the numerical evaluation of different configuration parameters to calculate the amount of freshwater obtained in each case. By enabling quick iterations and adjustments to material properties and dimensions, the software assists designers in achieving alternative designs that meet their expectations. SESS also provides temperature and productivity graphs, organized within a drop-down list, for easy visualization and analysis of the results.
Materials and Methods
This study aimed to develop a software tool that allows for the efficient design of a simple effect solar still. To achieve this goal, a mathematical model that describes the thermal behavior of the solar still was defined. MATLAB® software was then used to develop the SESS tool, which solves the mathematical model using fourth-order Runge-Kutta methods. This software was designed to manipulate various parameters, such as weather conditions, dimensions, and material properties of the solar still, through its graphical user interface.
To validate the accuracy of SESS, experimental data from a real simple effect solar still prototype were compared with the outputs of the software. The SESS tool could accurately estimate the temperatures of the glass cover, water, and base, as well as the amount of water that could be produced by the solar still. Numerical integration of the condensation rate was used to obtain this water production rate. Using SESS, designers and engineers can quickly evaluate diverse configurations and parameters to optimize the productivity of a simple effect solar still. The software provides visual representations of the temperature and productivity data through dropdown menus, allowing users to visualize and compare different scenarios easily. This tool could be especially useful in remote or resource-limited regions with limited access to clean water. Thus, solar stills could be a sustainable solution to this critical issue.
Simple effect solar still prototype
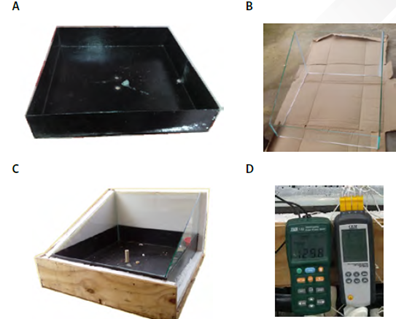
The dimensions of the simple effect solar still are 0.5×0.5m2 (base), and 0.1m of height, 3mm thickness. The base material is steel, and to maximize solar radiation absorption, their surfaces are covered with black paint, as shown in Figure 3-A. The glass cover has 4mm of thickness and an inclination angle of 23° with horizontal (Figure 3-B). Plywood and expanded polystyrene are used as insulation for the bottom and sides (Figure 3-C). A pyranometer (Figure 3-D left) measured the solar irradiation (W/m2), and a digital thermometer coupled with type J thermocouples (Figure 3-D right) measured the temperatures of the base, water, and glass cover.
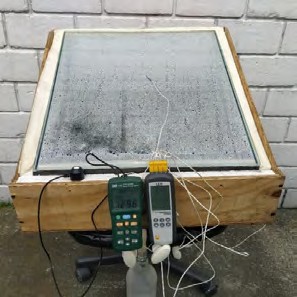
The glass cover surface of the solar still is facing south, and its axis is positioned with respect to the east and west (Figure 4). The still experimentation took place on July 5, 2021, under Bogotá, Colombia (latitude: 4° 70’98’’ and length: 74°11’35’’) climatic conditions. As part of experiments, the solar irradiation intensity, ambient temperature, base temperature, water temperature, and glass temperature were registered every 5 minutes for 3.25 hours (from 10:00 a.m. to 1:15 p.m., because in this time zone in Bogotá it is the moment of the day in which there is greater intensity of solar irradiation). The five minutes’ worth of freshwater output was collected using a graduated flask. Then the experimental results were compared with SESS software results to validate their predictions.
The mathematical model for SESS software
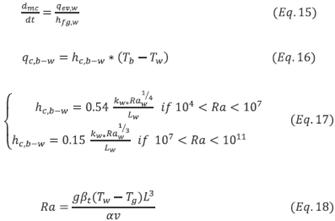
The energy balance of the glass cover, water, and base served as the foundation for developing the mathematical model that is suggested in this study (Edalatpour, Aryana et al., 2016), which are described in equations (1), (14), and (19). The glass cover energy balance is described in equation (1).

 Where the amount of solar energy absorbed by the glass cover is shown by the first term on the right side. The terms
  (2),
(2),  (3), and
  (4) show, in turn, how heat is transferred from water to the glass cover by convection, radiation, and evaporation (5) to (9).
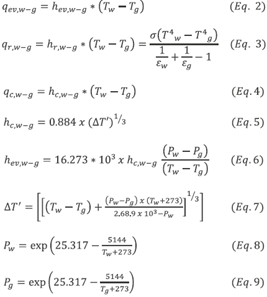
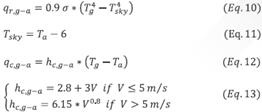
The terms  (equations (10) and (11)) and
  (equations (12) and (13)) correspond to the heat transfer by radiation and convection between the glass cover and the environment.
The amount of energy kept in seawater is seen in equation (14).
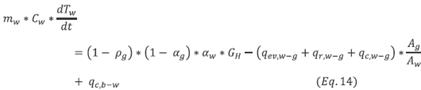
The solar energy that waters absorbs is indicated by the first term on the right 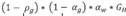 . Heat transfers from water to the glass cover via evaporation, radiation, and convection are indicated, respectively, by
  at equations (15), (3), and (4). The convection heat transfer of the base toward saltwater is indicated by at equations (16), (17), and (18) (Edalatpour, Aryana et al., 2016; Edalatpour, Kianifar et al., 2016).
Equation 19 describes the energy stored at the base:

The base’s energy absorption is shown by the first term on the right side In addition, at equations (16), (17), and (18) is the transfer of heat by convection from the base to saltwater. While is the heat loss by the base to the surroundings. The heat loss via conduction from the base to the insulation and the heat loss by convection from the insulation to the surrounding air are both included in and are explained by equations (20) and (21).
Finally, for determining the amount of water that the distiller can produce the simple effect solar still, the numerical integration of described at equation (22). Condensation rate of water in equation (15) as the ratio between heat by the evaporation of water equation (2), and equation (22) the latent heat of water evaporation.

SESS Software features
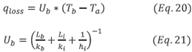
The software was structured to receive the input data that feeds the mathematical model as shows in figure 5. These data include solar irradiation (W/m2), ambient temperature (°C), wind speed (m/s), base thickness (m), insulation thickness (m), base length (m), base width (m), initial water temperature (°C), initial glass cover temperature (°C), initial base temperature (°C), density of the base (kg/m3), absorptivity of the base, thickness of the glass (m), base thermal conductivity (W/m°C), initial volume of water (L), initial time (h), final time (h). Once the user enters the data, the green button calculate (Calcular) must be pressed to all data run the simulation.
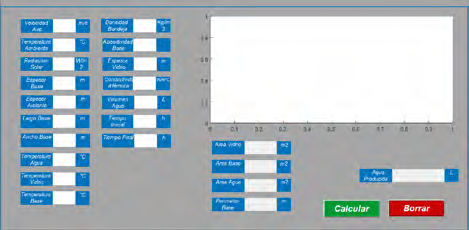
Then of the SESS has been executed the results are displayed on the screen in the respective boxes, allowing to visualize the area of the glass (m2), the size and perimeter of the base, the surface, and the amount of drinking water obtained with the data entered. In addition, the simulator allows you to display the temperature and productivity graphs grouped within a drop-down list; Figure 6 shows an example of the result.
Results
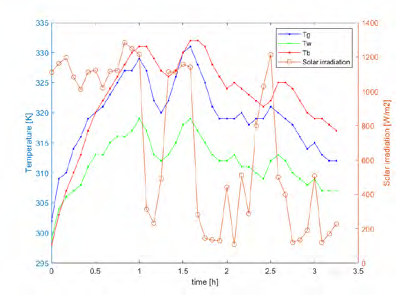
The objective of the experimental process was to evaluate the error between the SESS simulation software and the prototype described previously. Figure 7 shows the experimental solar irradiation and the temperatures of glass cover (Tg), water (Tw), and base (Tb) through time of the real conditions of measurements in the simple effect still prototype. The temperatures were registered through the time every 5 minutes for 3.25h on July 5, 2021, in the morning until noon hours in Bogotá, Colombia.
Figure 7 shows that temperature tendency of Tb was the higher of the three temperatures, follow by Tg and Tw, respectively. In the morning hours (10.00-13.30h), Tb and Tw had a maximum ΔT=16 °C (11:45 a.m.) and minimum ΔT =1°C (10:10 a.m.), causing a low productivity (0.013 L/h) due to the small energy absorbed by the water at this period, similar results were obtained by Varun Raj and Muthu Manokar (2017). Tb, Tg, and Tw increase from initial time until one hour of the assay, after those, temperatures fluctuates in the interval of 1 h (11:00 a.m.) until ̴ 2.5h (12:45 p.m.) with a maximum peak at 11:45 a.m. and minimum peak at 12:30 p.m., finally, temperatures drops.
Note: Made by the authors.
Figure 7 Experimental temperatures of glass cover (Tg), water (Tw) and base (Tb), and solar irradiation measured during validation process at conditions in Bogotá, Colombia
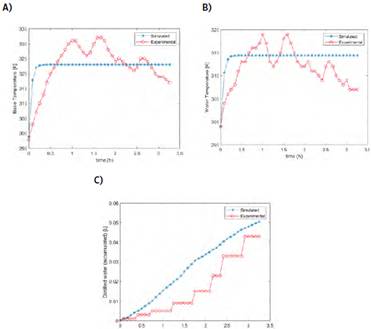
Subsequently, were compared the data from the experimental prototype and simulation through the comparison of the base and water temperature, and the distillated water volume (Table 1 and figure 8). The data from the experimental prototype and simulation (Figure 8), have a mean absolute percentage error (MAPE) of 1.47% for base temperature and 1.11% for water temperature (Figure 8 A and B).
Table 1 Mean absolute percentage error (MAPE) between experimental and simulation data
| Variable | MAPE |
|---|---|
| Glass Cover Temperature [K] | 4.36% |
| Water Temperature [K] | 1.11% |
| Base Temperature [K] | 1.47% |
| Distilled Water [L] | 35.31% |
Note: Made by the authors.
Discussion
The fluctuations in the solar irradiation generate the variation in temperatures as shows Figure 7. It is worth noting that the geographic conditions in Bogotá have a significant influence on this behaviour. Bogotá is in the centre of Colombia, in the savannah region, which is part of the Cundiboyacense plateau, a formation located in the Eastern Cordillera of the Andes. As in this study, temperatures in numerous Indian cities, such as Nagpur, Chennai, Jaipur, and Guwahati, also change from morning to evening (Nagrale and Dewangan, 2022). The variation in temperature of the tubular solar still component increases and decreases mostly as a function of solar intensity. The production rate of the distillate depends heavily on the time of day. From dawn until noon, the production rate increases (Vellingri and Hikmet, 2017), and it reaches its peak from 1:00 p.m. to 3:00 p.m. (Srinath, 2022).
In the Andean region (Colombia), the air temperature regime is characterized by the presence of so-called thermal floors, consisting of a decrease in the average air temperature as the height above sea level increases. In this region, there are wellmarked nuclei or bands of relatively high or low temperature values. The valleys of the main rivers, such as the Magdalena, the Cauca, the Patía and the Sogamoso, register high values, while the Cundiboyacense and Nariñense plateaus, the mountainous area of central Antioquia, as well as the areas bordering snow-capped mountains and the regions of paramo present the minimum values (Figure 1). For example, the average precipitation in Bogotá in July 2021 was of 4.28 mm/day and in July, 2021 had 83.7 % of cloud amount (NASA, n.d.) and clouds are a main factor affecting surface solar irradiation (Chanalert et al., 2022). The ambient temperature is linked to solar irradiation and the altitude of the geographical area.
For this reason, it is expected that the solar still has better performance in areas of low altitude and high solar irradiation. Bogota is the third highest capital in the world (after La Paz, Bolivia and Quito, Ecuador), it has 2625 m above sea level. Also, for this reason, the productivity of the assay was low. However, Colombia has other regions where the still solar could present better productivities, for example on the Atlantic coast, the average temperature fluctuates between 24 ºC and 28 ºC, as in Córdoba, central and northern parts of Sucre. In La Guajira, in the south and east of the Atlantic, southeast of Sucre, in Magdalena (except for the Sierra Nevada de Santa Marta) and the Cesar River valley, temperatures vary between 28 ºC and 30 ºC (Figure 1). In the Orinoquia and the vast Amazon region, its geographical relief being quite homogeneous, made up mainly of extensive savannahs cultivated with pastures. The distribution of the average air temperature is very uniform, with values between 24 ºC and 28 ºC. In many regions of Colombia, where there are no water purification systems, but they do have natural conditions to implement this kind of solar stills, added to the easiest and least expensive methods to produce freshwater by solar energy (Abbaspour et al., 2022), and more accessible for people in rural regions (Prakash et al., 2022).
The base and water temperature errors shown on Figures 8 A and B are similar than reported by Prakash et al. (2022). In this assay, Tg and Tw only had a T of 9°C which could also influence the low productivity of water recovered condensed water (Figure 8-C). For solar still the greatest efficiency improvement when the temperature differential between the water’s surface and the glass’s cover was at its highest (Rahbar et al., 2015). Additionally, it demonstrates how rising water temperatures improve solar still production (Prakash et al., 2022). According to the results, the rate of condensation slows down as glass temperature rises because temperature decreases, lowering heat transfer and the dynamics of evaporation and condensation. The error in the recovery of distilled water in this study was determined to be 35.31 %. This indicates that the simulation predicts a higher distillation rate compared to the experimental data. One of the factors contributing to this discrepancy is the delay between the condensation process and the flow of fluid to the container, as depicted in Figure 8-C. It is crucial for designers to take this issue into consideration because the simulation provides the condensation rate within the solar distiller, while the collection of distilled water occurs outside of it. Similar studies have reported similar results when comparing experimental and modeling results for distilled water (Alwan et al., 2021).
Conclusions
This study introduced the SESS software, which has been developed to simulate the thermal behavior of a simple effect solar still and calculate the amount of water produced. In addition, SESS contributes to simply design process, facilitating the exploration of various sizes and material configurations for simple effect solar stills.
During the validation process, the SESS software demonstrated relatively small errors in the calculated temperatures, but a notable discrepancy in the estimation of the amount of water produced. However, it is important to note that the errors obtained lie within the range reported by similar studies, suggesting that the SESS software’s performance is consistent with similar approaches in existing literature

