


 English (pdf)
 Article in xml format
 Article references
 Send this article by e-mail
 Cited by SciELO
  Cited by Google
  Similars in
SciELO
Similars in
SciELO  Similars in Google
 Permalink
1. Introduction
The State of Acre has historically been recognized as the largest rubber producer in Brazil and the world. Located in the northern macro-region of the country, it is one of the least populous and most economically isolated states. Rubber, often referred to as "black gold," emerged as an icon of the industrial revolution, primarily concentrated in the Amazon rainforest (Souza, 1992).
The occupation of the Acre region began in the late 1870s during the rubber boom in the Amazon. This process of regional settlement was shaped by various factors. On one hand, it was influenced by local societal conditions; on the other hand, it was driven by the transformation of production into a branch of scientific activity- a trend characteristic of central economies during periods dominated by monopolistic capital (Lima, 1994).
As rubber prices soared in the markets of Belém, Manaus, and internationally, there was a significant increase in rubber exploitation. By 1880, the expansion of rubber extraction had begun in Acre; between 1880 and 1883, all the rivers of Acre were already occupied, and the area was populated by Brazilians. Thus, it can be concluded that the rubber cycle not only shaped the economy of Acre but also facilitated settlement and attracted migrants to the region.
The economy of Acre is primarily based on extractive activities, particularly rubber exploitation, which was fundamental to the region's settlement. Currently, timber is the state's main export, while it is also a significant producer of Brazil nuts, which are widely exported (Martinello, 1988).
Acre features two major economic centers: the Juruá River valley, with the city of Cruzeiro do Sul as its main urban nucleus, and the more industrialized Acre River valley. The latter exhibits a higher degree of mechanization and modernization in agriculture and is a major producer of rubber and various food crops (such as cassava, rice, corn, and fruits), in addition to housing the state capital, Rio Branco. The Acre River valley plays a significant role in the agricultural sector and has undergone substantial modernization, placing it at a more advanced stage of development compared to the Juruá River valley.
Due to its rubber industry and the significant influence of extractivism, Acre is home to Brazil's largest extractive reserve, the Chico Mendes Reserve. This reserve aims to preserve the area and sustain local communities through the resources provided by the forest. However, activities that deviate from these objectives, such as illegal logging and improper resource extraction, have had a marked impact on environmental degradation that persists to this day. The reserve encompasses six municipalities in Acre, including Xapuri, Brasiléia, Rio Branco, Assis Brasil, Capixaba, and Sena Madureira.
Overall, the Acre economy is characterized by its primary sector, which includes agriculture, livestock, and extractivism. As with many less industrialized and polarized economies, these activities generally require lower levels of qualification. Acre also has a strong tertiary sector, encompassing trade and services, which are crucial for generating wealth and employment in the region.
In terms of foreign trade, alongside products such as wood and nuts, agribusiness development has been gaining traction, supported by government initiatives to promote soybean production for export. However, in the secondary sector, industries in Acre contribute only 1.5% of regional industrial output, placing it just ahead of Roraima, which accounts for 1.2% (Fernandes & Bezerra, 2019). In addition to extractivism, Acre engages in other economic activities, such as livestock and agriculture, being one of the states that has successfully eradicated foot-and-mouth disease, which has facilitated meat exports, especially beef. Another notable export is birds from the city of Brasiléia.
The state of Acre has a range of geographical, climatic, and logistical characteristics that highlight inequalities across its territory. The polarization of the territory and access to certain regions present ongoing challenges related to regional imbalances. Over recent decades, these disparities have remained significant across various dimensions, including income, wages, employment, and production, as well as social indicators.
Despite economic growth in Acre in recent years, driven by the region's territorial and urban potential, significant domestic inequalities, particularly regarding income, still need to be addressed. These inequalities are rooted in historically established economic and social advantages that favor some regions over others (Silva et al., 2010).
Consequently, analyses that incorporate spatial factors to study income inequality in the region become increasingly nuanced. It is essential to investigate the primary economic variables that contribute to reducing intermunicipal income disparities, as well as their direct, indirect, and total impacts on the economy. Furthermore, regional indicators can provide insights into the characteristics of Acre's productive structure. The relative participation of various activities within each region influences the nature of regional development. In many instances, a region may be considered specialized in a particular activity, reflecting the impact of specific sectors on the distribution of formal employment in relation to the total workforce in the state.
Additionally, some measures of specialization aim to compare the productive structure of a microregion with that of the state. A region exhibiting a more distinct productive structure compared to the state will be deemed specialized. Conversely, restructuring coefficients can indicate whether changes in the productive structure have occurred over time.
Understanding these characteristics of the Acre economy through established regional indicators reveals how, when, and where sectoral development has advanced in certain areas of the state in recent years, as well as the types of policies or economic conditions that have facilitated this progress. It also helps identify the most dynamic sectors and how they perform during times of crisis.
Other studies also highlight intermunicipal income inequalities in Brazil. Alves (2023 a), in analyzing the state of São Paulo, identified significant disparities between its mesoregions, despite being one of the most developed regions. Between 2015 and 2020, more urbanized areas expanded sectors such as services and industry, while others faced economic downturns. The more developed regions, especially during the 2020 pandemic, stood out for their strong performance, with a focus on the services sector. The inequalities are concentrated in specific clusters and directly affect areas such as health, education, and infrastructure, emphasizing the need for public policies to reduce these disparities. Alves (2023b) analyzed the state of Rio Grande do Norte and concluded that the Leste Potiguar mesoregion is the most developed and employs the most people in the state. The study also highlighted the importance of the public sector in small towns to mitigate inequalities, as well as the need for improvements in water supply, energy provision, education, and healthcare.
In this context, this study analyzes the dynamics of the productive structure in Acre's microregions and the determinants of intermunicipal income inequalities, focusing particularly on spatial factors. The specific objectives include: i) exploring the sectors of Acre's economic structure; ii) conducting an exploratory spatial analysis of per capita income among the state's municipalities; iii) understanding the structural polarization between the two mesoregions; and iv) analyzing intermunicipal income inequalities. The study also seeks to answer questions such as: What are the most dynamic sectors of the economic structure? Is the spatial factor relevant in explaining inequalities? What are the impacts?
The study relies on two main hypotheses: first, that the productive structure reflects the process of territorial development, highlighting disparities and similarities among Acre's microregions; and second, that spatial factors explain differences in per capita income across municipalities in Acre, based on socioeconomic indicators such as income distribution, health, education, and infrastructure.
This study significantly contributes to the field by using established indicators of regional economics and conducting an econometric analysis that incorporates a temporal panel and spatial autocorrelation. By integrating these elements and examining Acre's sectoral productive structure, the study reveals the direct, indirect, and total impacts of intermunicipal per capita income differentials, providing valuable insights for discussion. Following this introductory section, the study will cover aspects of Acre's economy, followed by methodology, results, conclusions, and future perspectives on the state's economy.
2. Background
2.1. Economy of Acre: sectors of the productive structure and its characteristics in the microregions
The North region of Brazil has historically faced significant challenges regarding development and integration into the national market. Various factors have contributed to the interregional inequalities (Fishlow, 1973), including climatic, environmental, political, infrastructure, logistical, economic, and social aspects of this vast and dispersed area covered by the Amazon rainforest. Economic transformations in the North, primarily driven by state action, did not lead to uniform regional development as anticipated. States such as Acre, Amapá, Roraima, and Tocantins, characterized by limited economic dynamism, have had to contend with the persistent issue of intraregional inequalities.
2.2 Historical Aspects of Acre's Economy
During the 1990s and the early 2000s, the forest played a crucial role in supporting the Acrean economy, making the plant extraction industry the primary livelihood for the population. Today, while the economy still relies on rubber and Brazil nut extraction, along with livestock activities, trade and services have become the flagship sectors. Culturally, trade continues to be influenced by river routes, with exported products primarily directed towards the states of Amazonas and Pará.
Acre stands out in rubber production, with rubber trees thriving in the Purus, Juruá, and Madeira River basins. The collection of Brazil nuts is also a key activity, typically carried out by rubber tappers as a supplementary occupation during the rainy season, although this crop is not produced regularly. Subsistence agriculture is practiced, with important crops such as cassava, rice, bananas, and corn also contributing to the state's economy and the livelihood of its residents.
Territorial and demographic changes reflect a process of urbanization and population growth, particularly in Rio Branco, which accounts for 80% of the state's GDP from industry and services. This concentration leads to significant disparities across economic sectors and regions with higher economic participation. The Gini index, a measure of inequality, highlights these differences (Neves, 2015).
In the early 21st century, Acre exhibited a high Gini index, indicating concentrated economic polarization, particularly in the microregions of Cruzeiro do Sul and Rio Branco, which hold a substantial portion of the state GDP. However, disparities have decreased over the years, as reflected by the Gini index, which was 0.69 in 2020. The inequalities within the agricultural sector's value-added production are relatively low, as the state has a strong presence in this segment. In contrast, industrial activities are concentrated in the capital, Rio Branco, and its surroundings. Like other regions, the service sector has seen a reduction in inequalities, leading to a decline in the Gini index for this sector. Overall, while agriculture and services have recently shown a decrease in inequality, the industrial sector experienced increased inequality between 2000 and 2010 but saw a reduction by 2020.
Table 01: Gini Index of Acre's participation in the productive structure (%)
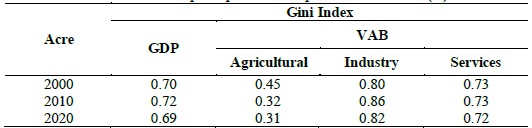
Source: Own elaboration based on regional accounts - IBGE (2024).
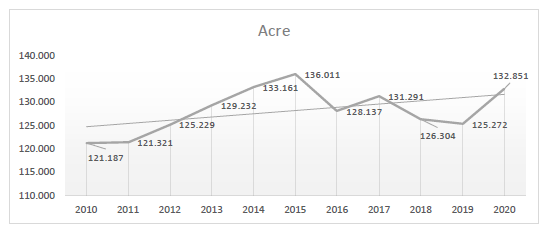
In 2010, Acre's Gross Domestic Product (GDP) reached R$ 8.3 million, accounting for 0.21% of Brazil's GDP and 4.03% of the Northern region's GDP. It is important to note that from 2003 to 2010, both national and regional economies experienced growth. Between 2013 and 2014, the state saw substantial growth, with a GDP growth rate of 4.4%. This period coincided with a favorable national economic environment, even in the aftermath of the 2008 financial crisis, creating a more favorable climate for job creation1.
Over the years, formal employment in Acre has shown a growth trend, although it experienced declines between 2015 and 2016, as well as from 2017 to 2019, when it reached its lowest levels. In 2020, the trade and services sectors became significant contributors to job creation, particularly because Acre is not heavily industrialized. As a result, the impact of the COVID-19 pandemic on the industrial sector was relatively minimal.
2.3 Characteristics of Acre's Microregions
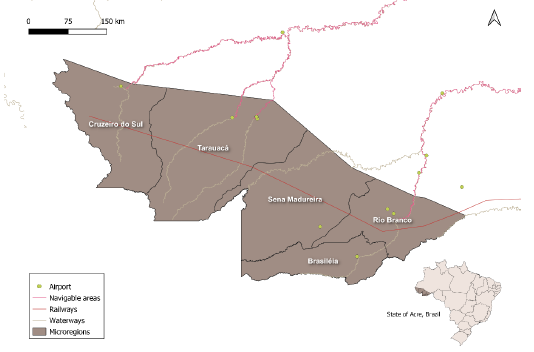
Acre features a humid and hot climate in the extreme west of Brazil, covering an area of 153,000 km2 that includes a mix of small towns and Amazonian cities. The state comprises twenty-two municipalities, five microregions, and two mesoregions. The Acre River is vital to both the life and economy of the region.
Figure 01 illustrates the state's five microregions, highlighting aspects related to waterways, railways, and aerodromes. All microregions are intersected by rivers, whether navigable or not, and are connected by an extensive railway that runs from east to west. The hydrographic basin of the State of Acre is part of the larger Amazon basin. Among its major rivers are the Juruá, Tarauacá, Muru, Embirá, Xapuri, Purus, Iaco, and Acre Rivers.
In terms of formal employment, most jobs are concentrated in the microregion of Rio Branco, which particularly reflects Acre's economic cycle, as illustrated in Graph 01. However, it is important to highlight the growth in formal job opportunities in the other microregions. Although this growth occurs at a slower pace, the increase in formal employment has been consistent, regardless of the prevailing economic conditions.
Source: own elaboration from RAIS/MTE data.
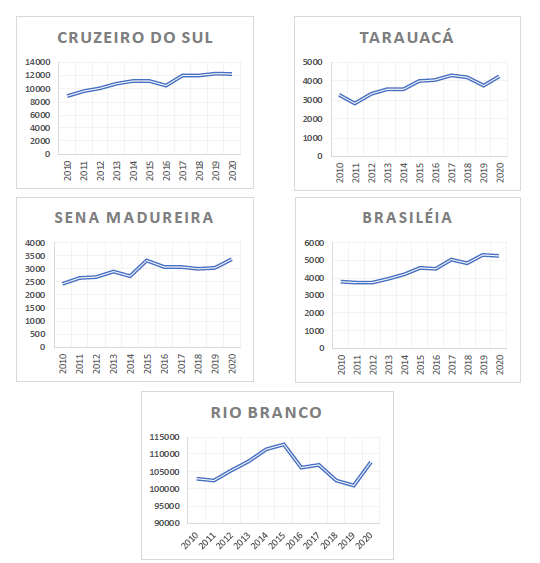
Graph 02: Total formal labor of the productive structure by microregion of Acre 2010/2020
In 2010, in terms of GDP, the microregion of Rio Branco led with R$ 5.9 million, followed by Cruzeiro do Sul with R$ 1.2 million, Brasiléia with R$ 495,900, Tarauacá with R$ 470,000, and Sena Madureira with R$ 356,000. These figures highlight the marked polarization within the state, with Rio Branco and Cruzeiro do Sul as the two cities exhibiting significant economic dynamism. Together, their microregions account for a substantial portion of the state's GDP (Pessôa, 1997).
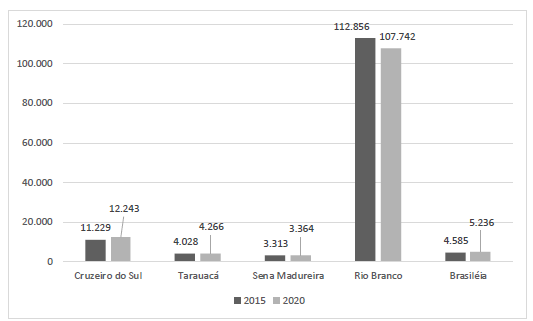
Regarding Graph 03, it is noteworthy that despite 2020 being a challenging year for job and income generation globally due to the pandemic, the only microregion that experienced a decline in the number of formal employees was Rio Branco. In contrast, all other microregions showed growth in the number of occupied positions.
Source: own elaboration from RAIS/MTE data.
Graph 03: Formal labor by microregions of Acre - 2015/2020
As expected, the concentration of economic activity in the microregion of Rio Branco is linked to the population density of the capital and its neighboring areas, which hold the largest share of formal jobs in the state. This microregion was notably affected by the pandemic. The capital possesses unique characteristics stemming from its historical, economic, and geographical formation.
Geographically, the municipality of Rio Branco covers an area of 14,294 km2 along the banks of the Acre River, with an elevation of 152.5 meters. Historically, the city originated from the Volta de Empresa colonization nucleus, established in 1882 during the rubber boom in the Amazon. Twenty years later, it became the headquarters for the Brazilian forces led by Plácido de Castro, who opposed Bolivian control in the region. After Acre's incorporation into Brazil in 1903, the settlement was granted city status. It was named Rio Branco in 1912 in honor of the Baron of Rio Branco, who negotiated the Treaty of Petrópolis, signed on November 17, 1903, which delineated the border between Brazil and Bolivia.
At the heart of Rio Branco lies the Rubber Museum, which houses collections of historical and ethnographic significance for both tourists and scholars, contributing to the city's cultural heritage and economic vitality.
3. Empirical strategy
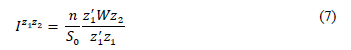
As an empirical strategy, indicators of the regional economy and spatial econometry techniques applied to the state of Acre were used. The data come from secondary sources in official bodies such as RAIS, IBGE, and UNDP (Demographic Census, UNDP Human Development Atlas, and DATASUS, among others). The time frame runs from 2000 to 2020. The regional economy indicators used were relative participation, three location measures: Location Quotient, Location Coefficient, and Hirschman-Herfindahl Index (HHI), and two specialization measures: Specialization Coefficient (SC) and Restructuring Coefficient (RC) (Haddad, 1989).
After the analysis variables are chosen, the following definitions should be taken into account:
POtj=
employed persons in the sector i of the region j;
PO
tj
= total number of people employed in the region j;
PO
it
= employed persons, from the sector i in the reference region;
PO
tt
= total number of persons employed in the reference region;

 distribution of the sector i between regions;
 =distribution i in the region j, that is, shows the participation of each sector in the productive structure of each microregion;
TO
= initial year;
T1
= final year. This index examines the expression PR, defined as:
=distribution i in the region j, that is, shows the participation of each sector in the productive structure of each microregion;
TO
= initial year;
T1
= final year. This index examines the expression PR, defined as:
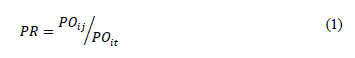
The relative participation indicator refers to the employed population, by sector, in each of the micro-regions (Piacenti y Lima, 2017; Rocha y Parré, 2009). This index varies between zero and one, and it is possible to highlight that at least two large sectors, in each micro-region, have greater participation in the economy, they are: Commerce and Services. The formula for calculating QL is expressed as:
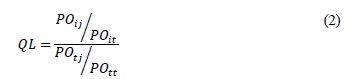
This indicator shows which sectors are more specialized in certain regions in relation to a reference macro-region. In this sense, a QL above one (1) indicates that the region is considered specialized in a certain sector (Castro et al., 2017). The calculation of utilizes the following formula:
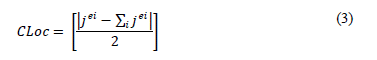
It highlights the influence of a given sector in relation to formal workers employed in a given micro-region, considering the total workforce in Acre. In this way, it allows identifying the degree of relative dispersion of economic activities and selecting those that would have a lower tendency to spatial concentration. Following a specific expression denoted as IHH, the formula:
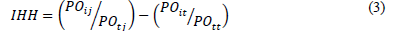
The Herfindahl-Hirschman index aims to highlight the concentration of a certain sector in the micro-region compared to Acre.
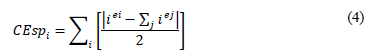
Two indicators of specialization measures were used, the Specialization Coefficient and the Restructuring Coefficient. About the Specialization Coefficient, it aims to compare the productive structure of the micro-region with that of Acre. In this way, the microregion that has a more differentiated production structure compared to that of the state will be specialized in that sector(s). For the computation of CEsp i the formula is given by:
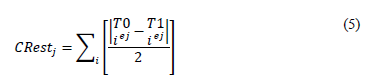
The restructuring coefficient of the production structure. This indicator demonstrates whether the productive structure changed between 2015 and 2020, one of the explanation s being that the micro-region began to specialize in a certain sector compared to the state's economy. In this sense, there were changes in the productive structure of all microregions (Simões, 2005). To interpret this information, the formula:
To analyze the dynamics of formal employment, the five sectors of the economy of the State of Acre were used, the study uses secondary source data from the Annual Social Information Report maintained by the Ministry of Labor (RAIS/MT), which is the main source of formal employment data. They include the following productive activities: i) Industry; ii) Civil Construction; iii) Trade; iv) Services and v) Agriculture. For this purpose, data were used from formal employment links in Acre from 2010 to 2020, for historical purposes, in addition, the study shows analyses of the years 2015 and 2020, in these five years there are periods of reduction and increase in the number of formal jobs, which reflect the warming and the slowdown of the Acre economy (Lima et., 2017).
For inter-municipal income inequalities, spatial economy techniques were used. To analyze inter-municipal income inequalities, an Exploratory Spatial Data Analysis (ESA) was performed, which is a set of tools that allows one to know spatial data and constitutes a relevant preliminary step before performing spatial econometric exercise (Almeida, 2012).
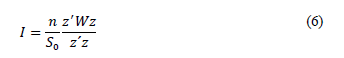
According to Anselin (1988), Almeida (2012), and Alves (2020, 2023a, 2023b), the use of Spatial Econometrics in regional economic analysis is grounded in the research problem, the spillover mechanism, and indicators of spatial autocorrelation. According to Alves (2020), intermunicipal inequalities are often serious indicators of regional underdevelopment. Acre is one of the most isolated states in Brazil, located in the far west of the North region, where there is a high degree of disconnection from more economically developed areas, such as Manaus, the capital of the state of Amazonas. In this context, identifying these inequalities within Acre's territory is crucial for formulating development strategies. Considering that municipalities are interconnected through borders and economic relationships, it is believed that there is a spillover effect in the spending behavior of formal (and informal) workers' income, influenced by the dynamics of the labor market and the productive structure. This spillover effect will be captured by Moran's I index, and to confirm this hypothesis, econometric models will be used, with rigorous control of spatial effects.
The ESA was made for the variable per capita income and per capita income differentials for the years 2000 and 2010, census data from IBGE. The idea is to analyze this variable spatially, to understand if there is a spatial correlation and if there is cluster formation, that is, municipalities with high (low) per capita income are surrounded by municipalities with the same characteristics with high (low) or inversely low (high). Thus, clusters of the High-High (AA), Low-Low (BB), High-Low (AB), and Low-High (BA) types may exist. For this, a neighborhood matrix of the two closest neighbors was used, about a given municipality, thus, from its centroid, the two closest municipalities are considered borderline and, therefore, neighbors. In this analysis, the univariate and bivariate context was verified. In the univariate case, which is about the variables of per capita income and per capita income differentials, these were tested for spatial autocorrelation and the LISA maps and univariate dispersion map were obtained.
As well as bivariate spatial autocorrelation tests between per capita income differentials with infant mortality rate, low-income population, and education. Key variables of immense importance for state and municipal public policies were selected for this analysis.
In a second moment, a spatial regression was performed to analyze the phenomenon, that is, the inter-municipal differences in per capita income. The Regression Model with Fixed Effects Panel with Spatial Dependence Panel - SAR Model was estimated due to the presence of heteroscedasticity, being corrected by the parametric method. In the SAR model, the phenomenon to be modeled, occasionally, may have a request that the implicit spatial dependence is more intricate, expressed in a lag of the dependent variable (Faggio y Overman, 2014).

For the analysis of per capita income differentials, a dependent variable was created in the model, which is the difference between the average per capita income of Acre and the per capita income of the municipality in question (VDRENPC). This variable reflects income disparities between the municipalities of the state, capturing the economic variations across the Acrean territory.
Additionally, the following data (independent variables, X) will be considered: i) Theil Index (VTHEIL): The Theil index measures how much the observed income distribution (where each individual holds a fraction y { of the total income) deviates from a perfectly uniform distribution (where each individual has an equal fraction of 1/n of the total income). It quantifies the degree of income inequality, weighting each observation according to its share of total income (Neri, 2010). ii) Education (VEDUC): The average number of years of education for people aged 20 years or older. This variable is calculated as the ratio of the total years of completed education for people in this age group to the total number of people aged 20 or older. iii) Health (VMINF5): The infant mortality rate under 5 years, i.e., the number of children who will not survive the first five years of life per 1,000 live births. iv) Infrastructure: Infrastructure will be measured by two variables: a) the percentage of people living in households with electric lighting, whether from the public grid or not, with or without a meter (VEE); b) the percentage of people in households with water supply (VAA). Both variables are derived from the Demographic Census. v) Public Administration GDP (VABAdm): The Gross Added Value (VAB) generated by the public administration sector of a municipality, used by the IBGE to control the influences of local government on the analyzed variables. vi) Low-Income Population (VPBRp): The percentage of the population with an income lower than half the minimum wage. vii) Population Density (VDENSPOP): Population density is a measure that relates the number of inhabitants to the territorial area of the municipality. It is used to evaluate the degree of population concentration in a given region, typically expressed in inhabitants per square kilometer (hab/km2). viii) Economically Active Population (VPEA): Refers to the portion of the population in a given region or country that is available for work. It includes all individuals who are employed or unemployed but actively seeking work. ix) Child Labor (VTRINF): The percentage of children under 10 years old who are employed.
These variables will be used to better understand the income differentials between the municipalities of Acre, taking into account a range of socio-economic factors such as education, health, infrastructure, public administration, and demographic characteristics like population density and the participation of the economically active population.
4. Results and Discussion
4.1. Regional Economy Indicators
Relative Participation
Acre's industrial profile is marked by a predominance of less dynamic sectors and a tendency toward spatial concentration. The primary sectors of the state include construction, which accounts for 54.6% of the industrial GDP, followed by food at 19.1%, industrial utilities at 16.4%, wood at 3.2%, and non-metallic minerals at 2.2%. Together, these sectors comprise 95.5% of the state's industrial output. Notably, the food sector has seen the most significant increase in participation, rising by 10.1 percentage points between 2009 and 2019.
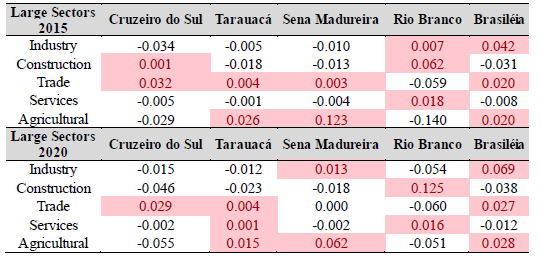
When examining the relative participation of the workforce in each microregion, we find that at least two major sectors - trade and services - have a substantial presence in the economy. The microregions of Cruzeiro do Sul, Tarauacá, Sena Madureira, and Rio Branco exhibit a high concentration of relative participation in the service sector. Between 2015 and 2020, even amidst the pandemic, these microregions experienced growth rates of 4.5%, 5.7%, 11.94%, and 1.3%, respectively.
Brasiléia, Rio Branco, and Tarauacá have shown significant increases in their relative participation in the trade sector. Both trade and services represent the core of Acre's economy, and they account for a substantial portion of the occupied workforce.
However, it's important to note that the growth in industrial participation in Sena Madureira outpaced that of Brasiléia, with Sena Madureira experiencing an increase of 118.4%, compared to Brasiléia 6.25%, despite Brasiléia having higher participation rates in both 2015 and 2020. Conversely, the relative participation of civil construction declined across all microregions, except for Rio Branco, which saw minimal growth. This is noteworthy as Rio Branco, the state capital, has undergone more intense verticalization and urbanization in recent years.
Table 02: Relative Participation of the Productive Structure by Microregions of Acre -2015/2020
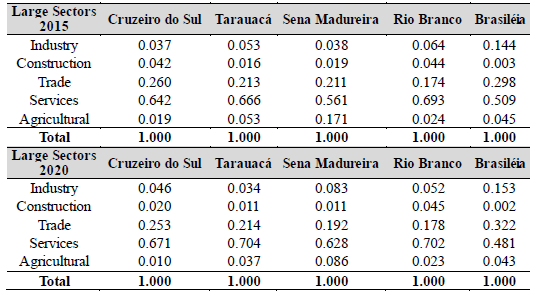
Source: own elaboration from RAIS/MTE data.
In comparing the years, it is evident that agriculture, civil construction, and industry faced negative impacts throughout Acre during the COVID-19 pandemic. The microregion of Cruzeiro do Sul was the most affected, as no sector experienced growth, with the sole exception of the service sector. Conversely, trade and services emerged as the sectors that grew the most in the economy, demonstrating resilience despite the challenging circumstances.
Location Measurements
The first calculated indicator for location measurements is the Location Quotient (QL). This indicator reveals which sectors are most specialized in certain regions compared to a reference macro-region (AC). A QL greater than one indicates that the region is specialized in that sector (Myrdal, 1968; Perroux, 1955). Despite the challenges posed by the pandemic in 2020, the microregions of Tarauacá, Brasiléia, and Sena Madureira exhibited strong specialization in three of the five main sectors of the economy. Brasiléia and Sena Madureira were particularly notable in industry, trade, and agriculture, while Tarauacá specialized in trade, services, and agriculture.
Furthermore, there was a marked specialization of the trade sector in the microregions of Cruzeiro do Sul, Tarauacá, Sena Madureira, and Brasiléia. However, in 2020, there was a significant decline in specialization within the construction industry across all microregions, except for Rio Branco. Notably, Cruzeiro do Sul ceased to be specialized in civil construction, indicating a shift towards spatial concentration in the microregion of Rio Branco that emerged in response to the pandemic.
Table 03: Locational Quotient of the Productive Structure by Microregions of Acre -2015/2020
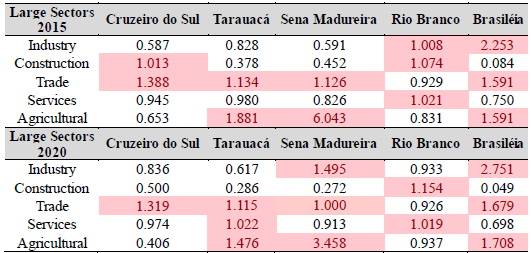
Source: own elaboration from RAIS/MTE data.
The Acre Valley stands out for its strong participation in the agricultural and livestock sectors, showcasing significant modernization in its productive structure. This advancement has elevated the region to a higher stage of development compared to the Juruá Valley. The dynamic presence of agriculture and livestock in the Acre Valley not only drives the local economy but also fosters technological innovations and sustainable practices, establishing the region as a hub for agro-industrial development. This modernization positively influences economic indicators and has substantial implications for the quality of life of the population, contributing to job creation, infrastructure improvement, and the strengthening of the regional economic base.
Another important measure of location is the locational coefficient, which highlights the influence of specific sectors on formal employment in each microregion relative to the total labor force in Acre. This metric helps identify the degree of relative dispersion of economic activities and selects those that show less tendency toward spatial concentration.
In the period from 2015 to 2020, several notable results emerged. Firstly, there was a spatial concentration of the trade sector in the microregions of Cruzeiro do Sul and Brasiléia, with Brasiléia showing a greater trend of concentration compared to 2015. Notably, civil construction emerged as a highlight in this context; while other sectors experienced a decline in relative participation and specialization, civil construction demonstrated an increased tendency for spatial concentration in the microregions of Cruzeiro do Sul, Tarauacá, Sena Madureira, and Brasiléia. This suggests a positive outlook for the creation of new formal jobs in this sector within these locations.
Table 04: Locational Coefficient of The Productive Structure by Microregion of Acre - 2015/2020
Source: own elaboration from RAIS/MTE data.
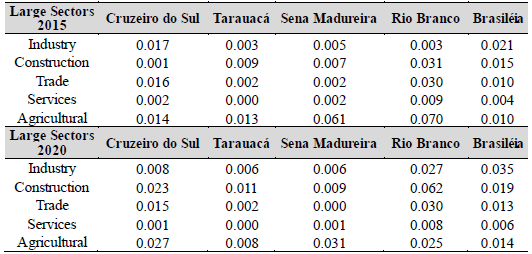
The Herfindahl-Hirschman Index (HHI) is used to assess the concentration of specific sectors within microregions compared to the overall economy of Acre. This analysis reveals a tendency for concentration in the microregions of Tarauacá and Brasiléia, which show greater prominence and a stronger power of attraction due to their specialization in three of the five key sectors. In Tarauacá, the highlighted sectors are trade, services, and agriculture, while Brasiléia excels in industry, commerce, and agriculture.
In 2020, there was a notable concentration of the trade sector in the microregions of Cruzeiro do Sul, Tarauacá, and Brasiléia, as well as in agriculture in Tarauacá, Sena Madureira, and Brasiléia. However, civil construction experienced a decline in its attractiveness across all microregions, except for Rio Branco. This trend indicates a development process that is polarized by microregion, aligning with Perroux's theory (1977).
Furthermore, it can be inferred that the pandemic spurred growth in the trade and services sectors, contributing to an internalization of the economy. In contrast, the industrial sector experienced a decrease in its attraction power in Rio Branco while gaining momentum in the microregions of Brasiléia and Sena Madureira. Meanwhile, construction remains concentrated in Rio Branco, which accounts for a significant portion of formal employment compared to other regions in the state.
Table 05: Hirschman Herfindahl Index of the Productive Structure by Microregion of Acre - 2015/2020
Source: own elaboration from RAIS/MTE data. Specialization Measures
This study utilized two indicators for measuring specialization: the Specialization Coefficient and the Restructuring Index (Alves et., 2019). The Specialization Coefficient compares the productive structure of a microregion with that of the entire state of Acre. A microregion that exhibits a more differentiated productive structure relative to the state is considered specialized in certain sectors.
In 2015, there was an increase in production specialization within the industry and construction sectors across the microregions of Tarauacá, Sena Madureira, Rio Branco, and Brasiléia. These specializations proved significant for the state. Notably, Cruzeiro do Sul did not achieve specialization in the industrial sector; however, it did experience an increase in productive specialization in civil construction.
It is also important to highlight the productive specialization of the microregion of Brasiléia across all sectors. This area comprises four municipalities - Brasiléia, Xapuri, Epitaciolândia, and Assis Brasil- each with populations ranging from 10,000 to 30,000 inhabitants. These municipalities share common characteristics, including the presence of a natural reserve within their boundaries.
Table 06: Coefficient of Specialization of the Productive Structure by Microregion of
Source: own elaboration from RAIS/MTE data.
Confirming the dynamism of the microregions of Rio Branco and Brasiléia across all sectors, industry remains strong despite a reduction in specialization for services and agriculture in Rio Branco. Brasiléia stands out by concentrating companies with significant potential, contributing to a large share of the state's GDP and a greater number of formal employees. In contrast, Rio Branco is characterized by its denser population, including the capital, and has historically benefitted from a higher level of industrialization. However, the trade, services, and agriculture sectors in the microregions of Tarauacá, Sena Madureira, and Rio Branco did not achieve specialization and, in some cases, even experienced declines relative to the state.
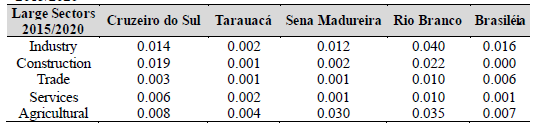
The coefficient for restructuring the productive structure indicates changes between 2015 and 2020, suggesting that certain microregions began to specialize in specific sectors in response to the economic conditions in Acre. Notably, the microregions of Rio Branco and Cruzeiro do Sul began to distinguish themselves from others in terms of civil construction, indicating a more advanced development in this sector. While Rio Branco experienced an increase in relative participation and job creation, Cruzeiro do Sul saw a lower intensity of growth in these areas.
Table 07: Restructuring Coefficient of the Productive Structure by Microregion of Acre - 2015/2020
Source: own elaboration from RAIS/MTE data.
The verticalization process in certain cities makes them more attractive for large companies to establish operations. For example, Cruzeiro do Sul in its respective microregion, as well as Rio Branco and its surrounding municipalities, benefit from this trend. Given their locations and the polarization of growth and development in the state, there is a noticeable flow of productive activities toward these two microregions. However, the changes in the productive structure of Sena Madureira, particularly in the agricultural and industrial sectors, are significant, alongside the industrial developments in Brasiléia, highlighting the productive restructuring occurring in Acre during this period.
Regarding the Juruá Valley and its municipalities, this mesoregion continues to exhibit a significant history of geographical isolation, particularly in the cases of Marechal Thaumaturgo, Porto Walter, and Jordão, where access is limited to waterways and/or airstrips. This distinctive geographical condition has led to a scenario where, for an extended period - at least until the early 2000s - the commercial and economic ties of Cruzeiro do Sul were more closely aligned with Manaus (via waterways) than with the capital, Rio Branco. This dynamic arose from the limited accessibility of the BR-364, which connects the state to the rest of the country.
This situation has notably shaped the developmental patterns of these two significant regions, establishing substantial disparities. The Juruá Valley, due to its geographical isolation, has faced unique challenges regarding connectivity and accessibility, directly impacting its economic and commercial interactions. In contrast, Cruzeiro do Sul has benefited from stronger connections with Manaus, resulting in a development trajectory influenced by distinct regional dynamics. This contrast underscores the complexity of geographical and logistical interactions in shaping the regional socio-economic landscape.
4.2. Exploratory Analysis of Spatial and Model Data
Conducting a spatial analysis is essential for understanding inequalities across the territory, as it provides insight into the location of less developed regions in relation to more developed ones and how to implement targeted development strategies. The Exploratory Spatial Analysis (ESA) method describes the distribution and spatial association of specific variables among the evaluated units (municipalities), allowing us to discern patterns of spatial instability and identify outliers. Clusters are classified into four categories: High-High, Low-Low, High-Low, and Low-High.
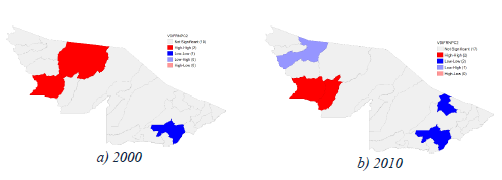
In this initial analysis using a univariate context, the goal is to identify spatial patterns and evidence significant clusters for the Local Moran's I. When examining cluster maps for 2000 and 2010, a notable expansion of High-High agglomerations is evident, particularly in the vicinity of the capital, Rio Branco. This indicates a concentration of per capita income in municipalities within the Rio Branco region and the western part of the state. Inequalities between the eastern and western regions are apparent, showing that income concentration around Rio Branco diverges from other municipalities, such as Tarauacá and Marechal Thaumaturgo, which reported per capita incomes below the state average in 2000.
Although Cruzeiro do Sul is one of the central cities, it ranks as High-Low in per capita income, as observed in 2010. Additionally, Jordão and Marechal Thaumaturgo were classified as Low-Low municipalities, characterized by low per capita incomes and similar profiles. It is important to note that outliers, such as Rio Branco, are not significant in this analysis.
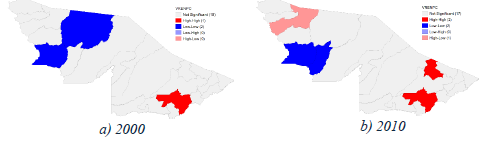
Source: Own elaboration from the results.
Figure 02: Single-rate LISA cluster map for per capita income variable - 2000 and 2010
Figure 03 presents the reverse side, illustrating the differences between the average per capita income of the state and that of its municipalities, thereby revealing per capita income differentials. The High-High clusters that transitioned to Low-Low, as well as the Low-Low clusters that became High-High, highlight inter-municipal inequalities. This pattern indicates that areas of concern regarding regional development are concentrated in the western part of the state, which is the westernmost region of Brazil. Overall, the analysis identifies weaknesses in driving forces that contribute to the creation and expansion of inter-municipal inequalities in Acre2.
Source: Own elaboration from the results.
Figure 03: Single-rate LISA cluster map for per capita income differentials variable - 2000 and 2010
The clusters identified in the analysis support the hypothesis guiding this study. They highlight that spatial factors significantly explain intermunicipal inequalities in Acre, revealing a high concentration of per capita income differentials in the western municipalities of the state. This concentration underscores the region's lag in productivity structure, despite the economic growth observed in Cruzeiro do Sul. Consequently, these regions contribute to perpetuating income inequalities across Acre in the early 21st century.
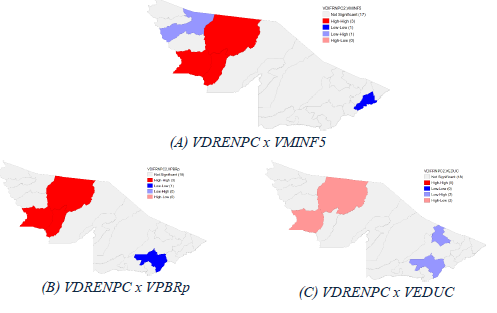
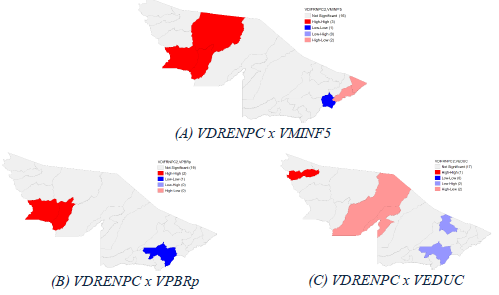
In the bivariate analysis, the dependent variable-per capita income differentials -was examined alongside three key variables: (A) Infant Mortality Rate (VMINF5), (B) Low-Income Population (VPBRp), and (C) Education (VEDUC). This approach is justified by the importance of health, education, and income indicators in assessing municipal human development. Ideally, municipalities should exhibit low infant mortality rates, higher average years of schooling, and a reduced proportion of the population with low per capita income.
Source: Own elaboration from the results.
Figure 04: Bivariate LISA Cluster Map - 2000 (Variables Selected)
The bivariate Moran's I statistics reveal that municipalities with high per capita income differentials and elevated infant mortality rates-indicative of poorer health and poverty conditions-are predominantly found in the microregions of Tarauacá and Cruzeiro do Sul in the western part of the state. Conversely, areas with low-income differentials and better health indicators are concentrated around Rio Branco, Plácido de Castro, and Xapuri.
Regarding education, there is an inverse relationship: as per capita income differentials increase, educational levels tend to decline. Notably, the municipalities of Xapuri and Bujari exhibit higher educational levels, forming low-high clusters.
By 2010, only minor changes occurred, maintaining positive spatial correlations between per capita income differentials and both the infant mortality rate and the low-income population. In terms of education, a new High-High cluster emerged in Rodrigues Alves, characterized by a significant per capita income differential (indicating lower income) alongside a higher educational attainment, with an average of 8.5 years of schooling compared to Acre's overall average of 7.75 years.
4.3. Intermunicipal Income Inequalities in Acre
This analysis aims to provide insights into the determinants of inter-municipal income inequality, taking spatial effects into account. Previous analyses have indicated that unobserved effects are significant for understanding this phenomenon and that spatial factors should be considered. In this context, we pose two key questions: Is the spatial factor relevant for explaining inter-municipal income inequality? What are its impacts?
To address these questions, it is essential to understand the statistics, estimates, and strategies employed to generate the results presented in Table 08, which refers to the Regression Model with Fixed Effects Panel Data and Spatial Dependence (SAR Model). For the Exploratory Spatial Analysis (ESA) conducted earlier, a neighborhood matrix based on the two nearest neighbors' criterion was utilized. This means that for a given municipality X, we considered its two closest neighboring municipalities relative to its centroid. The choice of this neighborhood matrix was informed by testing the regression residuals (Murphy et., 1989).
Initially, the regression was performed without considering spatial effects and was estimated using Ordinary Least Squares (OLS). The dependent variable, per capita income differentials in municipalities (VDRENPC), was analyzed alongside several independent variables: Gini coefficient, mean years of schooling, infant mortality rate (up to five years of age), water supply access, percentage of the population with income below half the minimum wage, gross added value from the administration sector (VABAdm), child labor, economically active population, and population density. Following this, we evaluated the regression residuals to identify spatial autocorrelation using Moran's I.
To determine the most appropriate model based on the neighborhood matrix, we conducted the Lagrange multiplier diagnostic test for spatial dependence. This test assists in identifying the best-suited model for the dataset and spatial weights. The estimated model exhibited non-normality in the residuals. Based on the results from both the normal and robust Lagrange Multiplier tests for spatial dependence, we concluded that the SAR model is the most appropriate for estimation and interpretation.
According to Silva (2019), additional robustness and adequacy tests were performed, including the Spatial Hausman test. This test helps to determine the most suitable choice between the fixed effects model and the random effects model. In this case, the Hausman test for models with spatial dependence indicated, at a 1% significance level, that the fixed effects model is preferred, leading to the rejection of the null hypothesis favoring random effects.
We also identified issues of spatial heterogeneity, which are linked to Goodchild's (2004) second Law of Geography. This phenomenon occurs when structural instability manifests across regions, resulting in varied responses based on location or spatial scale, often characterized by variable coefficients or spatial regimes (Almeida, 2012). Table 08 presents the key results derived from the econometric-spatial estimation.
Table 08: Regression Model with Fixed Effects Panel Data with Spatial Dependency -SAR Model and Impacts Generated3
Source: own elaboration from the results
The analysis of the Theil index coefficient, a statistical measure of income distribution, reveals a negative result. This outcome indicates that an increase in the Theil index will harm the per capita income of municipalities already below the state average, thereby exacerbating inequalities between them. Specifically, any increase in the Theil index within a municipality leads to a direct reduction of R$ 48.49 in its per capita income, while the neighboring municipality experiences an indirect reduction of R$ 42.16. Altogether, this poor income distribution results in a total reduction of R$ 90.65 in per capita income.
The proxy coefficient for schooling indicates a positive correlation, meaning that higher education levels are associated with increased per capita income, thus narrowing income disparities in Acre. Municipalities with more years of schooling tend to experience greater economic growth than the state average. For example, each additional year of average education boosts per capita income by R$ 6.60 directly and R$ 5.74 indirectly, leading to a total effect of R$ 12.34. This may also reflect the migration of youth to other municipalities in search of better educational opportunities.
The coefficient for the infant mortality rate shows a negative correlation, indicating that poorer health conditions hinder income growth. Municipalities with higher infant mortality rates generally exhibit lower per capita income compared to those with better health indicators. Specifically, a 1% increase in infant mortality results in a direct reduction of approximately R$ 6.38 in per capita income, along with an indirect impact of R$ 5.54 from neighboring municipalities, totaling a reduction of R$ 11.92.
The water supply coefficient demonstrates a positive relationship, suggesting that improvements in water access correlate with higher per capita income. Each improvement generates a direct increase of R$ 0.03 in the municipality, with an indirect benefit of R$ 0.02 for neighboring areas, leading to a total effect of R$ 0.05. However, the overall impact on per capita income remains minimal due to the specific characteristics of the Amazon hydrographic basin where Acre is located.
A positive relationship exists between adequate electricity supply and per capita income, confirming that municipalities with better electricity access tend to have higher incomes.
This relationship results in a direct impact of R$ 1.78 and an indirect effect of R$ 1.55, culminating in a total effect of R$ 3.33.
Conversely, a higher percentage of the population earning below half the minimum wage correlates with increased income inequality. Municipalities with more low-income residents tend to widen the income gap relative to the state average. This situation results in a direct impact of R$ 8.12 and an indirect spillover effect of R$ 7.06 from neighboring municipalities, totaling R$ 15.18.
The Gross Added Value (VAB) of the administration sector positively influences per capita income differentials. Municipalities with higher VAB tend to enjoy greater income. An increase of 1% in VAB generates a direct effect of R$ 20.60 and an indirect effect of R$ 17.90, leading to a total reduction in income disparity of R$ 38.50.
Population density exhibits a negative and statistically significant relationship with per capita income differentials. Densely populated areas often incur higher costs, which hinder income growth compared to the state average. A 1% increase in population density results in a direct reduction of R$ 28.14 and an indirect decrease of R$ 24.47, culminating in a total reduction of approximately R$ 52.60 in per capita income.
Finally, the Economically Active Population variable shows a negative correlation with per capita income differentials. This suggests that an increase in job seekers can lead to lower wages due to a higher labor supply, negatively impacting per capita income. A 1% increase in the economically active population leads to a direct reduction of R$ 0.01 and an indirect reduction of R$ 0.01, totaling approximately R$ 0.02. No significant relationship exists between child labor and per capita income differentials.
5. Conclusion
In general terms, the analyses suggest that the Microregion of Rio Branco has the most advanced productive structure in the state. This microregion employs the largest workforce and exhibits the highest demographic density. The strong economic dependence results from significant structural advantages, including the presence of the state capital and its connections to Manaus and Porto Velho, which foster greater economic dynamics.
Acre's industrial profile primarily consists of less dynamic sectors and tends to concentrate spatially. The main sectors of the state include construction, accounting for 54.6% of the industrial GDP, followed by food at 19.1%, industrial utilities at 16.4%, timber at 3.2%, and non-metallic minerals at 2.2%. Together, these sectors make up 95.5% of the state's industrial output. Notably, the food sector increased its participation significantly, rising by 10.1 percentage points between 2009 and 2019.
The trade and services sectors show remarkable dynamics, with the microregions of Brasiléia, Rio Branco, and Tarauacá experiencing significant growth in trade. The service sector has also expanded in Sena Madureira, Tarauacá, and Rio Branco, both sectors acting as the pillars of Acre's economy. Despite the challenges posed by the COVID-19 pandemic in 2020, Tarauacá, Brasiléia, and Sena Madureira specialized in three of the five main economic sectors-industry, trade, and agriculture-while Tarauacá focused on trade, services, and agriculture. However, the agricultural sector suffered the most during the pandemic, with reduced participation across all microregions, followed by declines in civil construction and industry.
The coefficient for restructuring the productive structure indicates that the microregions of Rio Branco and Cruzeiro do Sul are increasingly differentiating themselves in civil construction, suggesting a more advanced status in these areas. This inequality is particularly pronounced in western Acre, where polarization dynamics have diminished. The central part of the state does not exhibit high or low per capita income, likely due to low population density. While residents seek better living conditions, the Juruá Valley mesoregion continues to host a significant number of municipalities with low per capita income, reflecting underdevelopment in the region.
Two notable aspects deserve attention: 1) The Acre Valley has a strong presence in the agricultural and livestock sectors, showcasing a robust modernization of its productive infrastructure, placing it at a more advanced developmental stage than the Juruá Valley; 2) The municipalities in the Juruá Valley, particularly Marechal Thaumaturgo, Porto Walter, and Jordão, remain geographically isolated, with access limited to waterways and airstrips. Until the early 2000s, Cruzeiro do Sul's commercial and economic interactions aligned more closely with Manaus than with the capital, Rio Branco, due to the limited accessibility of BR-364, which connects the state to the rest of the country. Consequently, the developmental patterns in these two major regions have diverged significantly.
Overall, spatial factors indicate a concentration of high per capita income in two municipalities of the Acre Valley, while two municipalities with low income and one with high income were identified in the microregions of Tarauacá and Cruzeiro do Sul in 2010. This situation perpetuates regional inequalities in Acre during the first decade of the 21st century.
Regarding inter-municipal income inequality, reducing disparities goes beyond merely decreasing per capita income differentials. Improvements in socioeconomic indicators such as income distribution, health, and infrastructure-particularly in municipalities adjacent to Cruzeiro do Sul-are likely to enhance economic growth and further affect inter-municipal income differences in Acre.
The spatial factor plays a crucial role in explaining regional inequalities, especially in municipalities with a history of geographic isolation. In locations like Marechal Thaumaturgo, Porto Walter, and Jordão, where access is limited to waterways and airstrips, the lack of connectivity creates significant disparities compared to more accessible areas.
The economic impact of geographical isolation manifests in various ways. Limited road access hampers the transport of goods and inputs, negatively affecting local commerce. Furthermore, inadequate connectivity deters investment and infrastructure development, stunting economic growth in these regions.
These spatial inequalities also influence trade dynamics. For instance, Cruzeiro do Sul historically maintained closer ties with Manaus than with the capital, Rio Branco, due to accessibility issues surrounding BR-364. This situation illustrates how spatial conditions shape patterns of economic development and trade interactions across the state.
Thus, government intervention through explicit and implicit policies is crucial for reducing regional inequalities in Acre. The public sector plays an essential role in the economies of smaller municipalities, highlighting the need for adequate electricity, educational incentives, improved health conditions, and a better understanding of local economies and their spatial economic impacts. Strengthening public and welfare policies is vital, as the study reveals that health, education, infrastructure, and other factors significantly influence per capita income differentials between municipalities. Addressing these determinants is critical in combating inter-municipal income inequality.

