


 English (pdf)
 Article in xml format
 Article references
 Send this article by e-mail
 Cited by SciELO
  Cited by Google
  Similars in
SciELO
Similars in
SciELO  Similars in Google
 Permalink
1. Introduction
Bearing in mind that for universities, graduates play a crucial role in their development and continuous improvement. One of the most important factors that determines the quality of education in these institutions are the processes of characterization, monitoring and analysis of the labor market insertion of graduates (Campos-Mesa, 2008). In this way, carrying out evaluative follow-ups of future graduates in the academic sphere and of future graduates in the labor context contributes to obtaining key indicators of the quality of training provided at the university (Bautista-Rodríguez et al., 2015). Within the university and governmental context, different studies have been carried out, focused on determining the social impact of the graduates or the relevance of the training programmers for the context, focusing on the labor competences and employability of the graduates (Jaramillo et al., 2006).
In accordance with the above, nowadays higher education institutions are increasingly required and measured both by the employment position of graduates and by their social commitment, which is why graduate follow-up studies are essential to achieve these measurements (García-Ancira et al., 2019). Thus, one of the most relevant commitments of the University is the effective incorporation of the professional into the labor environment of the country (Bricio-Samaniego et al., 2018). Similarly, for higher education institutions it is essential to promote different strategies that contribute to maintaining a close and lasting relationship with graduates, since they are in the first instance potential students of postgraduate courses and in the second instance they can become employers of students who are graduating from the University (Schlesinger et al., 2014).
Based on the above, characterizing and predicting data related to graduates and graduates who enter the labor market is fundamental, given that such forecasts contribute to the monitoring of educational quality by continuously exploring the relationships between historical, current and ongoing data in different academic processes within the university context (Meng et al., 2022). In the same vein, according to (Nudin et al., 2022) it is also fundamental for higher education institutions to develop studies focused on predicting the level of preparation of graduates in terms of their incursion into the labor market. Similarly, according to Senay (2015), it is feasible to anticipate the skills required by graduates to succeed in the labor market and to improve the education system without restricting the role of universities exclusively to the training of specific labor competences. Hence, the importance of predictive models in higher education, as they allow institutions to adapt more effectively to the changing demands of the labor market and prepare students with the skills needed to meet the dynamic challenges of the current and future professional world.
Despite the aforementioned, various studies have demonstrated the shortcomings of the education sector regarding the utilization of advantages provided by artificial intelligence-based systems and knowledge-based management systems in enhancing different academic systems and procedures (Galgotia & Lakshmi, 2021). The aforementioned issue is not unfamiliar to the University of Cartagena, where although there is a record of graduates from different programs in an internal database, which is also backed by information provided by the Labor Observatory of the Ministry of National Education, there is no computer system for tracking graduates, and thus, the benefits of artificial intelligence in characterizing and predicting university graduates have not been leveraged.
Regarding the application of prediction models, different research has been found. Thus, in Chan et al. (2023), apply multimodal learning analysis to predict the behavioral change of students with special educational needs after their participation in applied behavior analysis therapies. In Yong et al. (2021), a linear regression model is used to evaluate the education system in four countries: USA, UK, China and Japan, in order to obtain 10-year forecasts to support decision-making regarding the structure of the education system. In Jie et al. (2021), make use of predictive models for characterizing and analyzing the employment status of biology graduates at Guangxi Normal University. In Choe & Borrego (2019), developed three sequential multiple linear regression models to predict the engineering identity level of students at different engineering graduate levels in the USA. In Nudin et al. (2022), propose a predictive model based on random forests in order to determine the relationship between soft skills competencies and the absorption of graduates in getting a job before six months.
In Uskov et al. (2019), perform a comparative evaluation of 8 machine learning algorithms for the analysis and prediction of academic performance of students in a Bradley University course. In Kashirina et al. (2021), a predictive model focused on the analysis of educational indicators related to the areas of employment with the highest demand in the regional labor market of the Voronezh oblast in Russia is proposed. In Shekhar et al. (2023), propose a predictive model based on decision trees to characterize determine the relationship between the average grades of engineering students and their enrolment in different business education programmers offered by higher education institutions. In Tahiru & Parbanath (2023), develop an exploratory data analysis to analyses students' records in the virtual learning environment to distinguish the characteristics of graduating and non-graduating students from higher education institutions.
Previous research demonstrates the relevance of applying artificial intelligence and specifically predictive models in obtaining value-added information, that can support decision-making regarding different processes within the educational context. It is observed that the characterization of graduates and their integration into the labor market is an area of interest for universities at the state of the art level. Moreover, it is important to note that, for the most part, the proposed predictive models have been implemented using supervised learning models (such as linear regression, decision trees, random forests, among others), without addressing time series-based models for the characterization and prediction of graduates. Building upon this, in this article, we propose a contribution in the form of an ARIMA-type time series model, which allows for characterizing the graduation rate of the University of Cartagena from 2003 to 2022, aiming to obtain predictions about the number of professionals graduating in the short and medium term. This proposed model serves as a strategic tool that not only offers a retrospective view of the evolution of the graduation rate but also anticipates future trends. Furthermore, its application entails significant benefits for academic decision-making, providing solid support to university leadership in formulating strategies that effectively contribute to improving the educational quality indicators of the University of Cartagena. Taking into account the importance for universities in the Colombian context of monitoring both the graduation rate and the reduction of the dropout rate, especially in the context of the rigorous processes of accreditation and accreditation of high quality, the proposed model has the primary objective of strengthening the software infrastructure of the monitoring systems of indicators at the University of Cartagena, thus providing solid predictive tools that allow not only monitoring, but also actively improving the educational quality standards required by the evaluating bodies.
The rest of the article is organized as follows: in Section 2, the different methodological phases that guided the development of this research are described. In Section 3, the results obtained in this work are presented, including the characterization of the dataset with the graduation rate, the separation of the data into training and testing sets, the determination of the parameters (p,q,d) of the ARIMA model, model fitting, and finally the predictions obtained for future years. Finally, in Section 4, the conclusions and future work derived from this research are presented.
2. Methodology
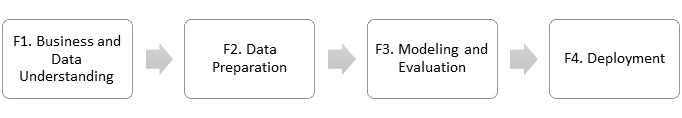
For the development of the present research, an adaptation of the CRISP-DM (Cross-Industry Standard Process for Data Mining) data science project methodology into 4 phases was carried out (Calvillo et al., 2016; Espinosa-Zúñiga, 2020; Martinez-Plumed et al., 2021), such that the following phases were defined: P1. Business and Data Understanding, P2. Data Preparation, P3. Modeling and Evaluation, P4. Deployment.
In phase 1 of the methodology, data on the graduation rate of the University of Cartagena were obtained and recognized, which were collected from the University's internal database and from the platform of the Labor Observatory of the Ministry of National Education. Given the temporal nature of the data to be worked with, using the Pandas library in Python, they were timestamped annually. It is worth mentioning that these data correspond to the consolidated attrition rate of the different programs of the University of Cartagena for each of the years between 2003 and 2022, so that the independent variable is the year and the dependent variable is the annual graduation rate. Regarding phase 2 of the methodology, the stages of data cleaning, obtaining the training and testing sets (80% and 20% respectively) from the dataset, as well as determining the possible parameters p, q, and d of the ARIMA model that best fit the data's characteristics, were carried out. This consideration stems from the fact that the equation of an ARIMA model consists of 3 components or parameters: p (autoregressive order), q (moving average order), and d (order of differencing) (Padhan & others, 2012), as depicted in equation 1.
In equation 1, Yt represents the time series at time (t). Additionally, p corresponds to the number of previous time steps that should be included in the model to predict the current value. Similarly, q indicates the size of the moving average window, i.e., how many past errors should be included in the model to predict the current value. Finally, d represents the number of times the time series has been differenced to make it stationary (Yt-i - Yt-i-1). To obtain the parameter d, the Dickey Fuller stationarity test was used, while the parameters p and q were respectively obtained using the correlation and partial autocorrelation plots. For this purpose, the advantages and functionalities provided by the statsmodels library in Python were utilized. It is important to mention that the process of determining the parameters p, d and q is of utmost importance in the context of ARIMA models, given that these may vary depending on the nature of the data, so that it is possible that with different combinations of these parameters, the model may not pass the goodness-of-fit tests with a specific set of data. Thus, the main challenge in the application of ARIMA models lies in the meticulous determination of the parameters that best fit the complexity and variability of the data in question. The careful choice of these parameters not only ensures the reliability and accuracy of the model, but also enhances its ability to effectively capture and forecast trends and patterns present in the data, which is crucial for informed decision making and the formulation of effective strategies in various application domains. Within phase 3 of the methodology, the adjustment of different ARIMA time series models were conducted, which adhered to the range of parameters d, p, and q obtained in phase 2, utilizing the training set. Similarly, within this phase, the evaluation of the best model obtained was performed, comparing the predictions with the data from the test set using error metrics such as MSE, MAE, and RMSE. Additionally, considering that the ARIMA model allows for determining the curve representing the data, the values of this curve were compared with the training set using error metrics. Finally, in phase 4 of the methodology, the model was deployed for the next 20 years, aiming to serve as a reference for the University of Cartagena in strategic decision-making aimed at enhancing the institution's quality indicators, particularly in terms of the number of graduates and their integration into the labor market.
3. Results and discussion
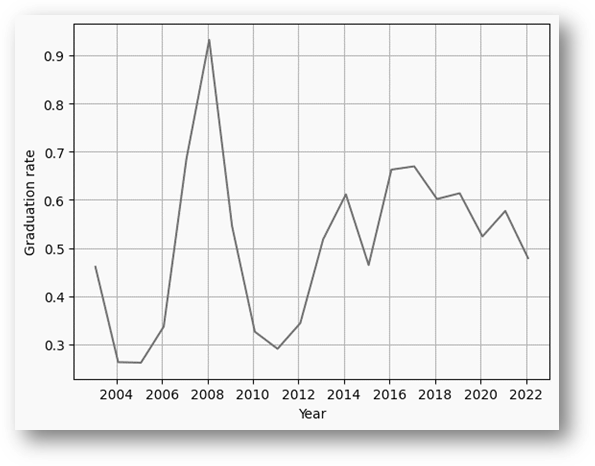
Firstly, it is important to mention that a dataset was formed with the graduation rate of professionals from the University of Cartagena from 2003 to 2022, based on data obtained from the Vice-rectorate of Academic Affairs of the University of Cartagena and the Labor Observatory of the Ministry of National Education. These data were labeled using the Pandas library in Python, so that each of them was timestamped with the corresponding year when the number of graduates was measured (see Figure 2), in order to facilitate the manipulation of this data within the Pandas and statsmodels libraries.
Once the different records of the dataset were adapted into the time series format, the data was divided into two sets: a training set (80%) and a test set (20%), for the purpose of carrying out the process of fitting time series models with the training set and validating their effectiveness by comparing the predictions of the best model obtained with the values of the graduation rate belonging to the test set. After obtaining the training and test sets, the training set was used to determine the parameters d, p, and q of the ARIMA model. Regarding the parameter d of the model, the Dickey-Fuller test was applied using the statsmodels library to the undifferentiated series, as well as to the first and second differentiations, obtaining the results shown in Table 1. It is important to highlight that the ADF statistic indicates how far the time series is from being stationary, while the p-value indicates if this difference is statistically significant. Thus, if the p-value is less than 0.05, the null hypothesis is rejected, and it is concluded that the series is stationary.
Table 1 Dickey-Fuller test results.
| Series type | Dickey Fuller test |
|---|---|
| Undifferentiated series | ADF statistic = -3.4581 p-value = 0.0091 |
| First differentiation | ADF statistic = -3.0568 p-value = 0.0299 |
| Second differentiation | ADF statistic = -2.394 p-value = 0.1432 |
According to the results presented in Table 1 for the time series regarding the Dickey-Fuller test, it is possible to observe that the p-value is less than 0.05 for both the undifferentiated series and the first differentiation of the series, while for the second differentiation, the p-value is greater than 0.05, leading to the acceptance of the null hypothesis in this case. Thus, the parameter d of the ARIMA model can take the value of 0 or 1. On the other hand, regarding the determination of the parameter p of the model, the partial autocorrelation function (PACF) plot was used for the undifferentiated series (parameter d value = 0), where the different lags are on the x-axis, and the autocorrelation values can be observed on the y-axis, as shown in Figure 3.
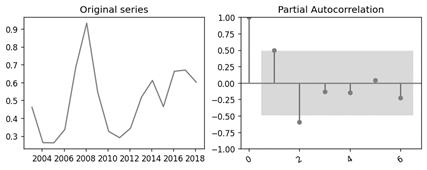
According to the partial autocorrelation plot presented in Figure 3, it is possible to observe that both in the first and second lag, the obtained autocorrelation value exceeds the confidence band, allowing to empirically conclude that the value of p can be either 1 or 2. This can be further contrasted by evaluating the AIC (Akaike Information Criterion) and BIC (Bayesian Information Criterion) metrics of the ARIMA model. Similarly, for the determination of the parameter q of the ARIMA model, the autocorrelation plot for the undifferentiated series (d = 0) presented in Figure 4 was used. Similar to the partial autocorrelation plot, in Figure 4, the x-axis corresponds to the different lags, while the y-axis represents the autocorrelation values.
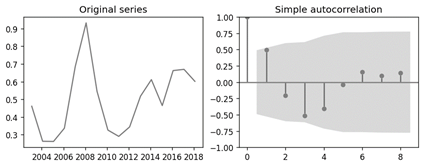
According to the results obtained in Figure 4, the different lags of the autocorrelation are within the confidence band, indicating that they are not significant. Thus, the possible value that the parameter q can take is 0. However, it is necessary to contrast this value using the AIC and BIC metrics of the ARIMA model.
Based on the aforementioned, it is possible to conclude that priority should be given to evaluating ARIMA models that meet the following combinations of values: d=0,1, p=1,2, q=0. Building upon these considerations, a comparison of different ARIMA models was conducted, ensuring that the p-values of the parameters for each model were significant, meaning that the p-value is less than 0.05. Additionally, it was ensured that the AIC and BIC metrics presented the lowest possible values. This is considering that both criteria penalize model complexity, indicating a preference for simpler and more parsimonious models. Therefore, it is desirable for the AIC and BIC values to be as low as possible, as this indicates that the model achieves a good balance between fit and complexity, suggesting better capability to predict future data and greater generalization to new situations. The comparative results of the different models are presented in Table 2.
Table 2 Comparative results of the evaluated ARIMA models.
| Model (p,d,q) | Results obtained |
|---|---|
| Mode (1, 0, 0) |
AIC -7.143 BIC -4.825 Log Likelihood 7 P_values const 1.458594e-08 ar.L1 3.443486e-02 sigma2 4.256092e-02 |
| Mode (1, 1, 0) |
AIC -3.944 BIC -2.528 Log Likelihood 4 P_values ar.L1 0.536565 sigma2 0.019910 |
| Mode (2,0,0) |
AIC -12.221 BIC -9.131 Log Likelihood 10 P_values const 2.257643e-27 ar.L1 3.105130e-05 ar.L2 4.875286e-03 sigma2 5.533706e-02 |
| Mode (2,1,0) |
AIC -4.937 BIC -2.813 Log Likelihood 5 P_values ar.L1 0.391404 ar.L2 0.154890 sigma2 0.024602 |
| Mode (1,0,1) |
AIC -9.077 BIC -5.986 Log Likelihood 9 P_values const 2.628217e-09 ar.L1 6.597660e-01 ma.L1 8.849947e-02 sigma2 7.688433e-02 |
| Mode (1,1,1) |
AIC -3.359 BIC -1.235 Log Likelihood 5 P_values ar.L1 0.653512 ma.L1 0.284533 sigma2 0.026048 |
| Mode (2,1,1) |
AIC -7.637 BIC -4.805 Log Likelihood 8 P_values ar.L1 0.013046 ar.L2 0.026977 ma.L1 0.969957 sigma2 0.969170 |
| Mode (2,2,1) |
AIC 1.58 BIC 4.136 Log Likelihood 3 P_values ar.L1 0.543157 ar.L2 0.261926 ma.L1 0.955450 sigma2 0.954555 |
| Mode(2,1,2) |
AIC -7.189 BIC -3.649 Log Likelihood 9 P_values ar.L1 3.890266e-10 ar.L2 6.645324e-05 ma.L1 9.858017e-01 ma.L2 9.926090e-01 sigma2 9.926314e-01 |
| Modo (2,2,2) |
AIC 0.552 BIC 3.747 Log Likelihood 5 P_values ar.L1 0.344135 ar.L2 0.117270 ma.L1 0.955590 ma.L2 0.977667 sigma2 0.977658 |
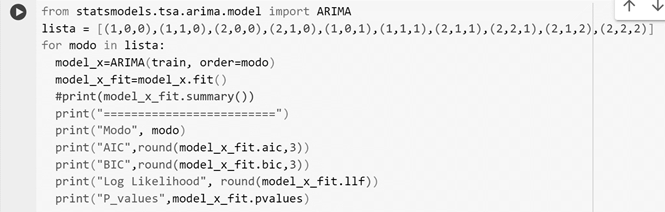
It is worth mentioning that the results obtained in Table 2 were implemented from the script presented in Figure 5, which obtains for each of the models the goodness-of-fit metrics, as well as the p-values associated with the parameters of each model.
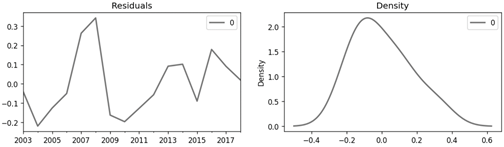
According to the results obtained in Table 2, where in addition to the feasible and empirical values of the parameters d, p, and q, models in which the value of parameter q=1 were also considered, it is possible to conclude that the model which is significant in its different components is the (1,0,0) model. However, the (2,0,0) model demonstrates that its parameters approach significance. Despite this, the absolute value of the AIC and BIC metrics is lower for the (1,0,0) model than for the (2,0,0) model, which is why the former is chosen for the adjustment and validation process. Similarly, it is possible to observe how the best obtained model falls within the range of empirical values obtained from the partial autocorrelation, simple autocorrelation, and Dickey-Fuller test for the parameters p, d, and q. Additionally, prior to the adjustment process, residuals were plotted for the ARIMA model (1,0,0), revealing that these residuals follow a distribution close to normal, which is suitable for the determined model (see Figure 6).
Once the residuals corresponding to the determined ARIMA model have been verified, the adjustment of the (1,0,0) model was proceeded by using the training set. Subsequently, the values of the model curve and predictions were compared to the values of the training and test sets using the error metrics MSE, MAE, and RMSE. Thus, in Table 3, it is possible to appreciate the results obtained in the ARIMA model regarding the mentioned metrics.
Table 3 Error metrics obtained with respect to training and test set.
| Set | Metrics obtained |
|---|---|
| Training |
MSE es 0.025 MAE es 0.1347 RMSE es 0.1592 |
| Test |
MSE es 0.0022 MAE es 0.039 RMSE es 0.047 |
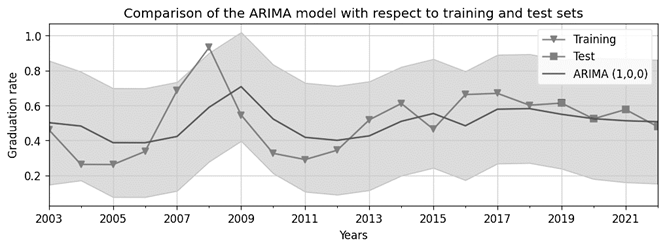
From Table 3, it is noticeable that although the error metrics do not have a defined range, values lower than 0.2 are observed in both the training and test sets, ranging between 0.025 and 0.1592 for the training set and between 0.0022 and 0.047 for the test set. This indicates that the ARIMA model curve adequately represents the graduation rate data and furthermore performs better for the test set than for the training set. Based on these results, it is possible to conclude that the obtained ARIMA model can be reliably used for predicting the graduation rate of the University of Cartagena. The findings can be more clearly appreciated through Figure 7, which presents a graphical comparison between the obtained ARIMA model and both the training and test data.
Finally, once the ARIMA model (1,0,0) was evaluated, the deployment phase of the methodology was carried out, in which a set of 14 predictions were made. These predictions encompass the 4 years covered by the test set (2019 to 2022) and an additional 10 predictions corresponding to the subsequent 10 years following the last year considered in the test set (from 2023 to 2032). Thus, Table 4 presents only the 10 predictions generated by the model for the period from 2023 to 2032. Thus, although of the 14 predictions obtained by the model after the data from the training set, the contrast could be carried out in 4 sections that correspond to the test set, it is worth noting that the ARIMA model managed to characterize the complete curve of the data, obtaining performance metrics. Adequate error for both the training set and the test set, so it is considered appropriate for the prediction phase.
Table 4 Predictions obtained from the determined ARIMA model.
| Year | Prediction |
|---|---|
| 2023 | 0.504426 |
| 2024 | 0.503116 |
| 2025 | 0.502489 |
| 2026 | 0.502188 |
| 2027 | 0.502045 |
| 2028 | 0.501976 |
| 2029 | 0.501943 |
| 2030 | 0.501927 |
| 2031 | 0.501919 |
| 2032 | 0.501916 |
From the results presented in Table 4, it is evident that the 10 predictions of the graduation rate at the University of Cartagena fluctuate around the average value of 0.5023 with a standard deviation of 0.0008, which can be explained by the fact that the different predictions range between 0.501 and 0.504. This indicates that for the upcoming 10 years, the ARIMA model predicts that 50% of the students who enrolled in the university managed to complete their studies and graduated. In other words, for every two students entering the university, one of them successfully graduates.
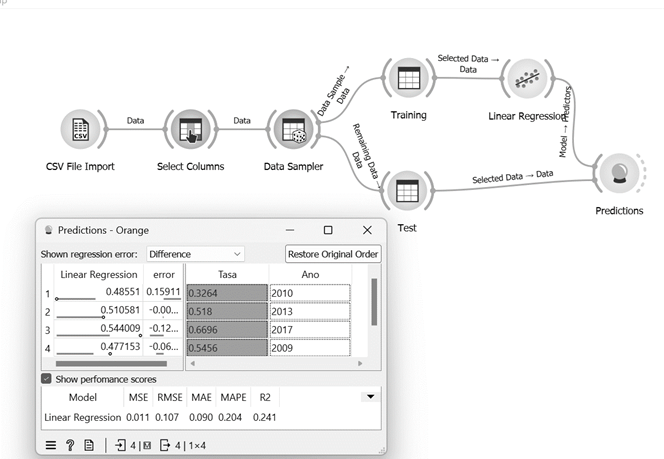
In order to compare the performance of the time series model with respect to machine learning models, the linear regression model was implemented through visual programming in the Orange tool with a partition of training and test data equivalent to those used in the time series model (see Figure 8). It is possible to appreciate from Figure 7 how the error metrics obtained by the linear regression are higher than those presented in Table 3. Likewise, the self-determination coefficient obtained is 0.241, which indicates that the linear regression is not adequate to characterize the time series data. This had been intuited when analyzing the stationarity of the data by means of the Dickey-Fuller test.
As a discussion point, it is important to mention that in the present study, a contribution was made by proposing an ARIMA time series model for characterizing and predicting the graduation rate at the University of Cartagena. This model demonstrated adequate adaptation to the data's specificity, minimizing errors concerning both training and test datasets. This work represents a substantial contribution compared to the proposals presented in (Yong et al., 2021) and (Choe & Borrego, 2019), where linear regression models were used to characterize and identify trends in different educational processes. The above, taking into account that given the periodic nature of university academic semesters, academic data captured semester to semester and year to year tend to have a periodic behavior as well, suggesting that they can be better characterized and adjusted by means of time series models. This could be verified in the present article by observing how the original data passed the Dickey-Fuller stationarity test.
Similarly, for the implementation of the proposed ARIMA model in this work, the advantages provided by various open-source tools and technologies were leveraged, allowing the proposed model to be extrapolated to different educational institutions for the characterization and prediction of data corresponding to various university educational processes. In this regard, both the Pandas library and the statsmodels library proved their relevance in terms of data acquisition and time series model fitting. Thus, these libraries demonstrated to be a viable and suitable alternative to proprietary tools for implementing predictive models based on time series data.
It is important to mention that time series models have the limitation of assuming that past relationships will continue into the future, which is not always true. Therefore, there is a need to self-adjust the model based on the real values obtained over the years, so that it is possible to readjust the parameters p, q, and d in response to changes in the training and testing sets. In this same context, these types of models can be affected by the presence of outliers or noise, which can reduce the accuracy of the predictions.
4. Conclusions
Considering that one of the challenges faced by higher education institutions is leveraging the advantages provided by artificial intelligence for process optimization and decision support aimed at improving the quality of education, this work proposes a contribution in the form of a model for characterizing and predicting the graduation rate at the University of Cartagena using ARIMA-type time series. The proposed model aims to support the Vice-rectorate of Academic Affairs of the University in formulating strategies related to increasing the number of graduates annually and reducing academic dropout rates. Similarly, this work aims to be extrapolated to different higher education institutions, intending to facilitate the characterization and prediction of graduation rates in these universities while considering the specificities of each dataset.
The model proposed in this work can serve as a reference for the implementation of software tools that enable the University of Cartagena to anticipate future graduation rates with high precision. Consequently, based on this information, the University of Cartagena has the opportunity to react promptly to imminent trends related not only to the number of graduating professionals but also to be proactive in formulating and implementing policies and strategies aimed at reducing university dropout rates and increasing the graduation rate across different academic programs. In this regard, the model offers the flexibility to be adapted and adjusted with new rates obtained as a result of the University's strategic plans, thereby serving as the foundation for the implementation of graduation rate monitoring tools in the short and medium term. To this end, it is essential that university directives take the necessary measures to articulate the proposed model to the monitoring and evaluation systems. It is also necessary to provide feedback to the model, allowing self-adjustment of the parameters based on the results obtained over the years.
One of the major advantages when extrapolating the proposed time series model into different academic contexts is the fact that it can be implemented using open-source technologies, which have proven to be suitable for implementing the various phases involved in constructing a predictive model based on ARIMA-type time series. In this regard, the Python library pandas allows for the processing of different data sources from which datasets can be obtained. Similarly, the statsmodels library enables data preprocessing, determination of model parameters (p, d, q), fitting the model with training data, and ultimately validating the model's relevance through the use of error metrics. The advantages provided by open source tools enable the implementation and development of systems for the university environment that allow the prediction of the graduation rate of institutions or other academic variables. However, in each case, given the nature of the data, it is necessary to determine the p, q and d parameters.
From the data corresponding to the graduation rate between 2003 and 2022 at the University of Cartagena, it was determined that the ARIMA model that best fits the data's characteristics is the (1,0,0) model. Thus, this model is not only significant through the components associated with the parameters p, d, and q, but also exhibits the lowest values in the AIC and BIC metrics. Furthermore, regarding the proposed model, it is noteworthy that both in the training set and the test set, values below 0.2 are obtained in the error metrics, with error metrics ranging from 0.025 to 0.1592 for the training set, and error metrics ranging from 0.022 to 0.407 for the test set. This indicates that the ARIMA model curve adequately represents the graduation rate data and performs better for the test set than for the training set. Similarly, based on the predictions obtained from the proposed model, it is possible to conclude that the graduation rate for the University of Cartagena over the next 10 years will remain around 0.50 with a standard deviation of 0.0008, indicating that within that time period, for every 2 students entering the University, 1 will graduate.
As a future work stemming from this research, it is intended to enhance the proposed ARIMA model by initially incorporating dropout and academic retention rates and subsequently integrating other factors as exogenous variables within a SARIMAX model. In this sense, the SARIMAX model can include as exogenous variables different economic and political factors, as well as changes at the educational level, in order to evaluate the impact on the characterization and prediction of the graduation rate. This approach aims to compare, in the future, the error metrics obtained in the SARIMAX model with those of the ARIMA model determined in this paper. It is also intended to feed back the time series model in such a way that it allows self-adjustment based on the new data obtained and derived from the strategies implemented by the University, so that the impact of the strategies implemented on the graduation rate can be evaluated. To provide a more comprehensive view of the graduation rate dynamics by exploring the impact of external factors (such as economic conditions, political changes, online versus traditional learning modalities) on the model predictions.

