


 English (pdf)
 Article in xml format
 Article references
 Send this article by e-mail
 Cited by SciELO
  Cited by Google
  Similars in
SciELO
Similars in
SciELO  Similars in Google
 Permalink
Clinical implications
Our findings suggest that frailty, as assessed by the 5-item FRAIL scale, is independently associated with greater cardiovascular risk according to the ASCVD 2013 and SCORE2 algorithms. This highlights the importance of incorporating frailty screening into cardiovascular risk assessment protocols in older adults, particularly in primary care and preventive cardiology settings.
Introduction
The global population is undergoing a significant ageing process, which is accelerating more rapidly than that observed in previous decades [1-3]. It is projected that the proportion of individuals aged over 60 will nearly double, increasing from 12% in 2015 to 22% by 2050 [1]. Furthermore, by 2050, approximately 80% of older adults are estimated to reside in low- and middle-income countries [1]. Concurrently, the burden of cardiovascular disease (CVD) increases substantially with advancing age, affecting up to 86% of patients aged 80 years and older and 75% of those aged between 60 and 79 years [4,5].
Moreover, dyslipidaemia is notably more prevalent among older adults, with reported rates reaching up to 76% in certain European cohorts [4-6]. Furthermore, a meta-analysis encompassing eight primary prevention trials in individuals over 65 years of age with high cardiovascular risk (CVR) revealed that statin therapy significantly reduces the incidence of myocardial infarction by 39.4% and stroke by 23.8% compared with that of placebo [7]. In parallel, studies conducted in Latin America have highlighted the role of social determinants of health in the development of CVD, demonstrating that adverse socioenvironmental and economic conditions are associated with increased CVRs in these populations [8-10].
Frailty is a common, multidimensional condition in older adults and is characterised by a reduced physiological reserve, which is associated with an increased risk of falls, hospitalisation, nursing home admission and death [11]. More recently, six predictive CVR equations have been validated and calibrated in Colombia, including the SCORE2, ASCVD 2013, and Framingham, which are three of the broadest and most commonly used CVR prediction models in Colombia [12].
Although several studies have reported associations between CVD risk factors and frailty [13-16], few studies have focused specifically on the relationships among frailty, CVR, and the attainment of LDL cholesterol (LDL-C) and non-HDL cholesterol (non-HDL-C) goals. Furthermore, in prior research conducted by our laboratory, we identified several social determinants of health -such as female sex, physical inactivity, and lack of affiliation with the health system- as being associated with failure to achieve LDL-C targets [8].
Nevertheless, the hypothesis that being frail or prefrail could be associated with a worse CVR and the attainment of lipid goals was proposed. Consequently, the aim of this study was to assess the associations between frailty, measured by the 5-item FRAIL questionnaire [17,18], and estimated CVR, as well as LDL-C and non-HDL-C goal attainment, in older adults without prior CVD.
Methods
Design, context, and data collection
This research study is a secondary analysis of our previous laboratory research [8] derived from a cross-sectional survey that involved 23,694 older adults: the 2015 SABE study [19]. The latter was performed as a multicenter project by the Pan American Health Organisation and was supported by the Epidemiological Office of Colombia's Ministry of Health.
To ensure a representative sample of the older adult population, the survey, which focused on Colombians 60 years and older, employed a combination of purposive and random sampling techniques in both urban and rural locations. To ensure data reliability, trained professionals collected data via standard protocols for personally conducting in-person interviews and physical measurements [19].
Data processing and coding for the SABE study were conducted in 2015. The collection of data was followed by a comprehensive examination and validation to ensure the accuracy and consistency of the data. Duplicate records, logical inconsistencies, and out-of-range values were among the errors corrected. Closed-ended answers were linked to numerical codes, whereas open-ended answers were manually categorised into predetermined codes. Assigning each participant a unique identifier and normalising the data in accordance with the survey's variable dictionary allowed for the standardisation of all the data [19].
Depending on its design, either manual input or direct entry from electronic devices was used to put the digitalised data into a storage system. Statistical software such as SPSS, Stata, or R was then used to organise and process the data in accordance with the survey's variable dictionary and coding instructions [19]. Our study's secondary analysis received ethical approval from the institutional ethics and research committee (CIE-1094-23). Furthermore, this study complied with the most recent Helsinki Declaration.
Operational Definitions of Frailty, Prefrailty, and other variables
Frailty was estimated via the 5-item FRAIL scale, which is a mixed model that combines physical and multidimensional criteria and assesses five domains: fatigue, resistance, ambulation, illness, and weight loss [17,18]. For this study, patients scoring 0 points were considered robust, 1-2 points as prefrail, or 3 or more points as frail. This scale was calculated considering the answers of the patients in the SABE Colombia study at the moment the survey was performed.
The LDL-C goals for Framingham CVR categories are as follows: high risk <70 mg/dL; moderate risk < 100 mg/dL; low risk <116 mg/dL; ASCVD 2013 CVR categories: high risk <70 mg/dL; intermediate risk and borderline risk < 100 mg/dL; low risk < 116 mg/dL; concerning SCORE2, for very high risk < 55 mg/dL; high risk < 70 mg/dL; moderate risk < 100 mg/dL; and low risk <116 mg/dL [20,21].
Additionally, with respect to non-HDL-C goal achievement, it was measured only for the global SCORE2 according to the European guidelines’ recommendation [21], with a goal of <85 mg/dL for very high risk, <100 mg/dL for high risk, <130 mg/dL for moderate risk, and <150 mg/dL for low risk [21].
Illiterate patients were defined as patients who could not read or write. Physical inactivity was defined as not performing physical activity three times a week. The body mass index was calculated from weight and height.
Statistical analysis
Categorical variables are presented as absolute numbers and percentages. Continuous variables are summarised as medians with 25th and 75th percentiles (interquartile ranges [IQRs]). The CVR was calculated according to Framingham, ASCVD 2013, and SCORE2 calibrated to Colombia [12], which was used to estimate the percentage of compliance with lipid profile goals. Because SCORE2-OP is not externally validated in Colombia, it was calculated in patients aged 70 years or older without a conversion factor. It was part of the global SCORE2 (i.e., SCORE2 and SCORE2-OP).
To identify whether frailty or prefrailty was associated with a worse CVR category in each CVR equation (SCORE2, ASCVD 2013 and Framingham) or the likelihood of not achieving the LDL-C goal and non-HDL-C goals, a logistic regression analysis was conducted, estimating the odds ratios (ORs) with 95% confidence intervals (CIs) that were calculated. Covariates were included in the multivariable logistic regression models if they showed an association with the outcome at a p value <0.10 in bivariate analyses.
Model diagnostics were performed to confirm the validity of the analyses. The goodness-of-fit of the logistic regression models was assessed via the Hosmer-Lemeshow test, whereas multicollinearity among covariates was evaluated via the variance inflation factor. No evidence of poor fit or problematic multicollinearity was identified.
All the statistical comparisons were two-tailed, and p < 0.05 was considered statistically significant. The calculations were carried out with Stata Statistical Software: Release 14 (StataCorp, College Station, TX, 2015).
Results
Frailty was significantly associated with a high CVR. Specifically, frail individuals had more than a fivefold increase in the odds of being classified in a high-risk category according to the ASCVD 2013 equation (OR 5.53, 95% CI 2.05-14.89) and more than a twelvefold increase in being classified in a very high-risk category according to SCORE2 (OR 12.05, 95% CI 2.77-52.39). In practical terms, this means that frail older adults were several times more likely to be placed in the highest CVR strata than their robust peers were. In contrast, frailty was not associated with failure to achieve LDL-C or non-HDL-C goals.
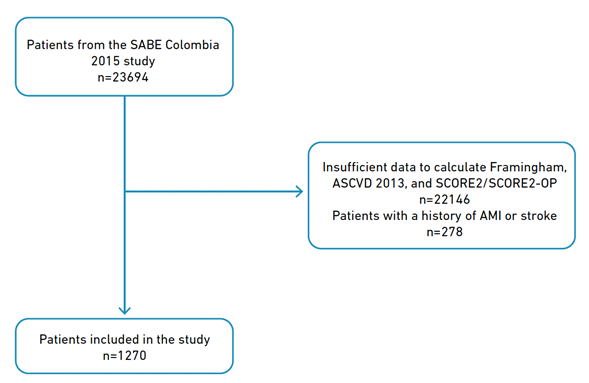
As reported in our previous research [8], out of the 23694 patients in the SABE Colombia 2015 study who were 60 years of age or older, 1270 patients were included in our study. The remaining 22,146 patients were excluded because they lacked the information necessary to estimate their CVR via SCORE2-OP, Framingham, ASCVD 2013, or SCORE2 calibrated for Colombia [12]. Additionally, 278 patients were removed because they had a history of acute myocardial infarction or stroke (Figure 1).
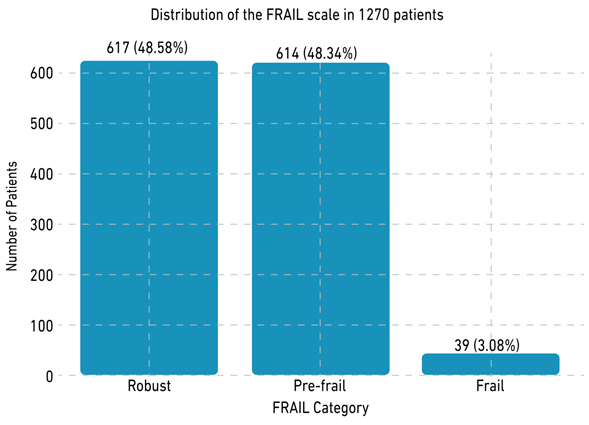
Among the 1270 patients, 60.79% (n = 772) were women, and 41.97% (n = 533) were mixed-race patients [8]. With respect to frailty, 48.58% (n = 617) were robust, 48.35% (n = 614) were prefrail, and 3.07% (n = 39) were frail according to the 5-Item FRAIL Scale [16-17] (Figure 2). Table 1 provides an extensive description of the sociodemographic characteristics of this population.
Table 1 Sociodemographic characteristics of the population.
| Characteristic | Male n = 498 | Female n = 772 | Total n = 1,270 |
|---|---|---|---|
| Marital status | |||
| Married | 242 (48.59) | 244 (31.60) | 486 (38.27) |
| Cohabitation | 104(20.88) | 76 (9.84) | 180 (14.17) |
| Divorced | 46 (9.23) | 95 (12.30) | 141 (11.10) |
| Widower | 62 (12.45) | 245 (31.73) | 307 (24.18) |
| Single | 44 (8.83) | 112 (14.50) | 156 (12.28) |
| Racial identity | |||
| Indigene | 44 (8.85) | 26 (3.37) | 70 (5.51) |
| Black | 28 (5.62) | 41 (5.31) | 69 (5.43) |
| White | 125 (25.10) | 219 (28.34) | 344 (27.09) |
| Mixed race | 207 (41.56) | 326 (42.23) | 533 (41.97) |
| Other | 26 (5.22) | 42 (5.44) | 68 (5.35) |
| Without answer | 68 (13.65) | 118 (15.28) | 186 (14.65) |
| Illiterate | |||
| Yes | 80 (16.06) | 113 (14.64) | 213 (16.77) |
| No | 418 (83.94) | 659 (85.36) | 1 057 (83.23) |
| 5-Item FRAIL Scale | |||
| Robust | 260 (52.21) | 357 (46.24) | 617 (48.58) |
| Prefrail | 223 (44.78) | 391 (50.65) | 614 (48.35) |
| Frail | 15 (3.01) | 24 (3.11) | 39 (3.07) |
| Hypertension | |||
| No | 287 (57.63) | 325 (42.10) | 612 (48.30) |
| Yes | 209 (42.37) | 446 (57.90) | 655 (51.70) |
| Diabetes mellitus | |||
| No | 439 (88.15) | 637 (82.51) | 1076 (84.72) |
| Yes | 59 (11.85) | 135 (17.49) | 194 (15.28) |
| Smoker | |||
| No | 428 (85.94) | 716 (92.75) | 1 144 (90.08) |
| Yes | 70 (14.06) | 56 (7.25) | 126 (9.92) |
| Physical inactivity | |||
| Yes | 370 (74.30) | 648 (83.94) | 1 018 (80.16) |
| No | 128 (25.70) | 124 (16.06) | 252 (19.84) |
Associations between frailty and the CVR
With respect to the bivariable analysis and the associations of ORs, being frail according to the 5-Item FRAIL scale was associated with a worse CVR category according to the ASCVD 2013 and global SCORE2 prediction models (OR 4.82, 95% CI 2.31--10.09; OR 18.56, 95% CI 4.43--77.68, respectively). In addition, being prefrail was associated with a worse CVR according to the global SCORE2 prediction model (OR 1.26, 95% CI 1.01--1.57). However, being prefrail according to ASCVD 2013 and Framingham was not associated with a worse or better CVR. Table 2 lists the ORs from the bivariable analysis together with the corresponding CIs.
Table 2 Bivariate analysis with OR for frailty and a higher CVR category across the three prediction models.
| Variable | Framingham: OR (CI 95%) | ASCVD 2013: OR (CI 95%) | Global SCORE2: OR (CI 95%) |
|---|---|---|---|
| 5 Item FRAIL scale | |||
| Frail | 2.10 (0.89 - 4.98) | 4.82 (2.31 - 10.09) * | 18.56 (4.43 - 77.68) * |
| Prefrail | 1.30 (0.90 - 1.87) | 1.24 (0.84 -1.82) | 1.26 (1.01 - 1.57) * |
Note. CI = confidence interval. OR = odds ratio. * The bold results obtained p values < 0.05.
Multivariate analysis between frailty and the CVR
In addition, logistic regression with multivariable analysis was performed for frailty across the three prediction models (Framingham, ASCVD 2013 and global SCORE2) and their risk categories.
Moreover, as an additional finding, being illiterate was associated with a worse CVR across the three prediction models. Being physically inactive was associated with a worse CVR category only according to the global SCORE2 prediction model, and being obese was associated with a better CVR category according to the ASCVD-2013 and global SCORE2 prediction models. The ORs found with their respective CIs are described in Table 3.
Table 3 Multivariate analysis with OR for frailty and a higher or worse category of CVD.
| Variable | Framingham: OR (CI 95%) | ASCVD 2013: OR (CI 95%) | Global SCORE2: OR (CI 95%) |
|---|---|---|---|
| 5 Item FRAIL scale | |||
| Frail | 2.46 (0.91-6.61) | 5.53 (2.05 - 14.89) * | 12.05 (2.77-52.39) * |
| Prefrail | 1.30 (0.87-1.92) | 1.06 (0.67-1.67) | 1.18 (0.93-1.51) |
| Illiterate | |||
| Yes | 2.70 (1.77-4.16) * | 2.51 (1.53-4.12) * | 2.62 (1.83-3.74) * |
| Body mass index | |||
| Underweight | 0.78 (0.25-2.35) | 1.38 (0.50-3.76) | 1.26 (0.62-2.53) |
| Overweight | 1.28 (0.81-2.01) | 0.68 (0.41-1.14) | 0.79 (0.59-1.04) |
| Obesity | 1.18 (0.70-1.96) | 0.43 (0.23-0.78) * | 0.54 (0.38-0.74) * |
| Physical inactivity | |||
| Yes | 1.29 (0.76-2.21) | 1.57 (0.77-3.16) | 1.37 (1.02-1.86) * |
Note. CI = Confidence interval. OR = odds ratio. RCV = Cardiovascular risk. * The bold results obtained p values < 0.05.
Association between frailty and nonattainment of LDL-C goals
With respect to the associations of ORs with nonattainment of the LDL-C goal, neither being frail nor prefrail according to the 5-Item FRAIL Scale was associated with nonattainment of LDL-C achievement according to any of the three prediction models. The ORs found in the bivariable analysis with their respective CIs are described in Table 4.
Table 4 Bivariate analysis with OR for frailty and noncompliance with LDL-C targets.
| Variable | Framingham: OR (CI 95%) | ASCVD 2013: OR (CI 95%) | Global SCORE2: OR (CI 95%) |
|---|---|---|---|
| 5 Item FRAIL scale | |||
| Frail | 0.85 (0.42 - 1.72) | 1.42 (0.61 - 3.30) | 1.67 (0.22 - 12.65) |
| Prefrail | 0.96 (0.75 - 1.24) | 1.02 (0.78 -1.32) | 1.03 (0.59 - 1.81) |
Note. CI = confidence interval. OR = odds ratio.
Associations between frailty and non-HDL-C goals
The associations of ORs between frailty and non-HDL-C goal achievement were analysed only for the global SCORE2, which revealed that frailty and prefrailty status according to the 5-Item FRAIL Scale were not associated with the nonattainment of non-HDL-C goals. Supplementary Table 1 describes the ORs and corresponding CIs that were found in the bivariable analysis.
Discussion
Our study examined the relationships among frailty, the CVR and the nonattainment of LDL-C and non-HDL-C goals among older adults aged 60 years or older, employing three widely used CVR prediction models. A worse CVR category was associated with frailty according to the ASCVD-2013 and global SCORE2 CVR prediction models. In addition, being illiterate was associated with a worse CVR category and physical inactivity was associated with worse CVR only in the global SCORE2 prediction model.
Similar to our results, Wong et al. [22] reported that a very high-risk category of CVR, compared with the low-to-moderate risk category, was associated with frailty (OR 3.51, 95% CI 2.69--4.58), a result that is also similar to that reported by Veronese et al. [23], who similarly reported an increase in the risk of developing CVD in frail populations (HR 1.70, 95% CI 1.18--2.45) and prefrail populations (HR 1.23, 95% CI 1.07--1.36) compared with robust individuals, a finding that was also reported in our study. Moreover, Wong et al. [22] reported that among those without prior CVD, the mean levels of CVD risk factors were closely correlated with higher frailty index scores.
In addition, other observational studies have revealed an association between frailty and CVR factors. For example, Strandberg et al. [15], who investigated whether frailty in old age was predicted by midlife overweight/obesity and CVD risk, reported that, compared with normal weight, the development of frailty was significantly greater among men who were overweight or obese in midlife (OR 2.06, 95% CI 1.21--3.52; OR 5.41, 95% CI 1.94--15.1, respectively). The same study also reported that the age-adjusted composite risk score of coronary artery disease in midlife similarly predicted 26-year total mortality (OR per 1% increase: 1.16, 95% CI 1.08-1.24) [15].
Another study carried out by Bouillon et al. [16] aimed at examining the capacity of existing CVD risk algorithms widely used in primary care to predict frailty reported that all four CVD risk scores evaluated (Framingham, coronary heart disease and stroke risk scores, and systematic coronary risk evaluation) were associated with the future risk of developing frailty, with ORs per standard deviation increment in the score ranging from 1.35 (95% CI 1.21--1.51) for the Framingham stroke score to 1.42 (95% CI 1.23--1.62) for the Framingham CVD score, which further supports the possible association found in other studies between these two variables.
Similarly, the study performed by Graciani et al. [14], which evaluated the relationship between being in ideal cardiovascular health according to 7 ideal metrics and frailty measured by the 5-item Fried criteria, revealed that, compared with reaching 0 to 1 ideal metric, achieving 2 or ≥3 ideal metrics was associated with a reduced risk of frailty (OR 0.51, 95% CI 0.30-0.84; OR 0.63, 95% CI 0.39-0.99, respectively), which suggests that aging in ideal cardiovascular health is associated with a reduced risk of frailty.
Together, these above-described results with our study findings show that several observational analytic studies have revealed an association between frailty and CVD and CVR factors and between frailty and CVR; nevertheless, it is relevant to highlight that the majority of this evidence comes from observational studies and that, for now, there is not enough evidence to confirm the hypothesis that frailty is a cardiovascular risk factor, given that it is currently not possible to demonstrate causality.
However, these studies, along with ours, serve as fundamental evidence for developing and guiding future analytical studies with better designs that will allow us to explore the possible existence of a causal relationship between CVR and frailty.
Illiteracy could eventually be associated with a worse CVR, as found in our study, because illiteracy can be seen as a social determinant of health, related to multiple factors that negatively influence CVR, since, as demonstrated in previous studies, some social determinants could be associated with not meeting LDL-C goals, which is one of the main determinants of CVR [8].
Similarly, another study conducted by Magnani et al. [24] demonstrated in a similar manner that individuals with low health literacy have worse cardiovascular outcomes. Additionally, other observational studies, such as that carried out by López et al., reported an inverse association between educational level and the presence of CVR factors such as obesity and diabetes [25]. Furthermore, in a similar way, another study carried out by Stringhini et al. demonstrated that a low socioeconomic status, indexed by occupational position, was associated with an increased likelihood of presenting CVD [26].
Additionally, we discovered that, on the basis of the ASCVD 2013 and global SCORE2 prediction models, obesity was linked to a decreased risk of falling into a worse category of CVR (OR 0.43, 95% CI 0.23-0.78; OR 0.54, 95% CI 0.38-0.74, respectively). This finding may be the result of the "obesity paradox", a hypothesis that suggests that in older adults, a higher body mass index or mild obesity in certain contexts is associated with better cardiovascular prognosis or lower mortality, which has been found mainly in observational studies of older adults with chronic diseases such as heart failure and chronic kidney disease, among others [27-30].
In contrast, in another cross-sectional study published by Nguyen et al. [31], being obese was associated with an increase in the likelihood of not attaining the LDL-C goal (OR 2.33, 95% CI 1.13--4.81), which could eventually be associated with a worse CVR given that LDL-C is one of the main determinants of CVR. Given that this hypothesis is not entirely accepted, we cannot rule out that this finding may be due to confounding biases, reverse causality, or inherent limitations of body mass index as a measure of adiposity in older adults.
Otherwise, the absence of an association between frailty and lipid goal attainment in our study and its scarcity in the literature may reflect several factors. In clinical practice, lipid targets are often prioritised in frail patients, with greater emphasis placed on symptom control and quality of life. Additionally, frail individuals may experience differences in treatment adherence, tolerance to statins, or access to lipid-lowering therapy, which could attenuate any expected relationship between frailty status and lipid goal achievement.
Clinical implications
Although our results reinforce the association between frailty and increased estimated cardiovascular risk, this relationship should be interpreted with caution. The association remains observational, without established biological plausibility or evidence of causality, and no interventional studies have yet demonstrated that improving frailty translates into better cardiovascular outcomes.
Therefore, our findings do not justify modifications in current risk estimation models or lipid-lowering treatment strategies. Nonetheless, they add to the accumulating evidence that frailty and cardiovascular risk are closely linked, supporting the need for prospective and experimental studies to clarify whether frailty independently contributes to worse cardiovascular outcomes and whether addressing it could improve prevention strategies in older adults.
Consequently, future studies should address two key questions: (1) Does frailty exert a causal influence on cardiovascular risk through biologically plausible mechanisms? (2) Could the prevention or reversal of frailty lead to improved cardiovascular outcomes, including cardiovascular mortality, myocardial infarction, stroke, and heart failure?”
Strengths and Limitations
The key strengths of this study include the use of a large, nationally representative sample of older adults, the application of three established cardiovascular risk equations, and the simultaneous assessment of lipid goal attainment in relation to frailty status.
Furthermore, some limitations should be acknowledged. First, the estimation of the CVR in older adults aged 70 years or more via the SCORE2-OP model was conducted without the application of a specific recalibration factor, as external validation of this model has not yet been performed in the Colombian population. This limitation may have resulted in a potential overestimation of the CVR in this subgroup. Second, the cross-sectional nature of the study precludes the assessment of causal relationships, given the inability to establish temporality between exposure and outcome. However, logistic regression was used to estimate ORs via both bivariable and multivariable analyses to overcome these constraints.
Additionally, a large proportion of participants were excluded because of missing data on essential variables for calculating the CVR. Multiple imputation was not pursued given the extent of missingness and the central role of these variables in the risk equations, which could compromise the validity of the imputed values.
Finally, certain forms of bias inherent to survey-based research-such as selection bias, nonresponse bias, recall bias, and knowledge bias-cannot be entirely excluded. However, the qualitative variables incorporated into the CVR estimation models, including age, sex, smoking status, and the presence of diabetes or hypertension, were straightforward for participants to recall and report. In addition, quantitative parameters-such as systolic blood pressure, total cholesterol, and HDL cholesterol-were directly measured at the time of data collection, enhancing the reliability of these inputs.
Conclusion
Our findings highlight a clinical disconnect: although frailty was strongly associated with a higher CVR according to ASCVD 2013 and SCORE2, this did not translate into poorer attainment of LDL-C or non-HDL-C goals. This paradox suggests that current lipid-based risk management strategies may not fully capture the vulnerability of frail older adults. These results underscore the need for more comprehensive approaches that integrate frailty assessment into cardiovascular prevention strategies in this population.

