Services on Demand
Journal
Article
 English (pdf)
 Article in xml format
 Article references
 Send this article by e-mail
Indicators
-
 Cited by SciELO
 -
 Access statistics
Related links
-
 Cited by Google
 -
 Similars in
SciELO
Similars in
SciELO -
 Similars in Google
Share

 Permalink
Perfil de Coyuntura Económica
On-line version ISSN 1657-4214
Perf. de Coyunt. Econ. no.13 Medellín Aug. 2009
INTERNATIONAL ECONOMIC AND POLITICAL SITUATION
The International Economic Crisis, the Trade Channel, and the Colombian Economy
La crisis económica internacional, el Canal de Comercio y la Economía Colombiana
Ricardo Argüello C.*
* Profesor principal de carrera de la Universidad del Rosario. Dirección electrónica: arguello@urosario.edu.co.
Introduction. –I. Background on the Global Economic Crisis. –II. Behavior of the Transmission Channels in the Case of Colombia. –III. Objective and Modeling Strategy. – IV. Model Structure and Scenarios. –V. Results. –A. The case of the US and the EU-27 –B. The Case of the Colombian Economy. –C. Sensitivity Analysis. –VI. Comments on the Results and Conclusions. –References. –Appendix.
RESUMEN
Esta investigación proporciona una vía para la evaluación del impacto de corto plazo que la crisis financiera y económica internacional, transmitida esencialmente a través del canal comercial, puede tener sobre la economía colombiana. Para el efecto se emplea un modelo del sector real, el modelo GTAP, caracterizado por ser de alcance global y operar bajo el supuesto de retornos constantes a escala. La estrategia de modelación se basa en la implementación de un choque negativo a la dotación de capital de las economías de Estados Unidos y la Unión Europea, de forma tal que se genere un decrecimiento del PIB similar al pronosticado para 2009 por el FMI. Los principales resultados indican que la economía colombiana puede decrecer en el vecindario de 1,54 por ciento. Si los correspondientes cambios en el comercio son acordes a estimaciones recientes de la elasticidad del comercio a cambios en el producto, el comercio colombiano puede disminuir en alrededor de 5,7 por ciento. Dado que el índice de precios al consumidor disminuye en 1,3 por ciento, la caída real en el PIB podría ser del orden de 0,24 por ciento.
Palabras clave: comercio internacional, crisis global, Colombia, equilibrio general computable.
ABSTRACT
This research attempts to provide an avenue for assessing the short run impact of the financial and economic crisis on the Colombian economy, as it is transmitted along and (mostly) only through the trade channel. For this a real sector model is used, the multiregion, constant returns to scale, computable general equilibrium GTAP model. The modeling strategy is based on implementing a negative shock to the capital stock of the US and EU's economies, in such a way that the resulting behavior of the value of GDP is close to that forecasted for 2009 by the IMF. The main results indicate that the economy may shrink in the vicinity of 1,54 per cent. If trade changes respond accordingly to an estimated elasticity of trade to growth, Colombian real trade flows may decline by 5,7 per cent. As the consumer price index decreases in 1,3 per cent, the decline in real GDP would be around 0,24 per cent.
Key words: international trade, global crisis, Colombia, computable general equilibrium.
RÉSUMÉ
Cette recherche fournit une méthodologie d'évaluation de l'impact de court terme de la actuelle crise financière et économique internationale sur l'économie colombienne, laquelle à été propagée à travers un canal de type commercial. Pour ce faire, nous proposons un modèle du secteur réel –le modèle GTAP–, lequel est caractérisé par sa portée globale et par sa capacité d'opérer sous l'hypothèse de rendements constants d'échelle. Le modèle est construit sur la mise en oeuvre d'un choc négatif concernant l'adoption de capital en provenance des Etats-Unis et l'Union Européenne, de telle sorte qu'on obtient une chute du PIB, semblable à celle pronostiquée par le FMI en 2009. Les principaux résultats montrent que l'économie colombienne peut voir réduire son PIB autour d'un 1,54%. Si les changements dans le commerce international sont conformes à des estimations récentes de l'élasticité du commerce par rapport aux changements dans le produit, le commerce colombien peut diminuer autour d'un 5,7%. Etant donné que l'indice de prix au consommateur diminue dans un 1,3 %, la chute réelle dans le PIB pourrait atteindre un 0,24 %.
Most clef: commerce international, crise mondiale, Colombie, équilibre général calculable.
Clasificación JEL: F13, F15, F17.
Introduction
EThe current global financial and economic crisis put a halt on recent economic growth and endangers achievements in poverty reduction worldwide. World output is expected to shrink 1,4 per cent in 2009 (IMF, 2009) and start weakly recovering in 2010 (2,5 per cent positive growth). The slump will affect the most the developed nations (-3,8 per cent) while emerging and developing economies are expected to attain low but positive growth (1,5 per cent). However, Western Hemisphere economies are forecasted to lose output (-2,6 per cent), especially Mexico whose GDP is expected to fall by 7,3 per cent. World trade volume (goods and services) are expected to decrease by 12,2 per cent.
Started as a financial crisis, it quickly developed as a real sector crisis affecting first the economies of the United States and the European Union and then spreading to most countries. Economies most closely linked to the international financial system will suffer the most, as credit becomes scarce. Yet, economies with looser ties to international finance will be negatively affected mainly through four types of transmission channels: international trade, capital flows and investment, remittances, and international aid.
As the US and the EU dip into recession, the world economy losses two of the main drivers of international trade. A recently released report by the OECD (2009), shows that G-7 countries trade is decreasing at a fast pace. Exports volume fell 13,6 per cent in the first quarter of 2009 while imports volume decrease by 10,5 per cent (the corresponding annualized rates are -22,8 per cent and -16,8). The figures in terms of values are equally worrisome. Exports value decreased 13,4 per cent in the first quarter of 2009, while imports value decreased 15,2 per cent (the annualized rates are 27,1 and 27,9 per cent, respectively). The financial component of the crisis, compounded by exchange volatility, has sent international capital flows in disarray, while several major investment projects have been called off. According to the World Bank (2009), the pace of remittances decreased sharply starting in the third quarter of 2008 as the crisis took root in the countries were migrants workers have their jobs and their total volume is expected to markedly decrease during 2009. The problem of indebtedness and the instability of fiscal policy in industrialized countries could negatively affect development aide and donor countries' commitments to contribute 0,7 percent of their GDP to developing countries.
While it is clear that none of these transmission channels operates in isolation, it is useful and illustrative for analytical and policy reasons to attempt to assess the likely impact of the crisis through these channels. The objective of this paper is to provide an avenue for appraising the short run effects of the current crisis as it is transmitted through the trade channel, on the Colombian economy. A real sector model (a global computable general equilibrium model) is employed for this end.
The modeling strategy can be broadly described as follows. A negative shock is applied to the US and EU economies in such a way that it yields as a result a decline in the value of GDP similar to the one that has been forecasted for these economies by the most recent estimate issued by the IMF (2009). The shrinkage of these economies is transmitted to the rest of the world mainly through the trade channel. As the different forms of demand decline, the economy demands less goods and services from both domestic and foreign origin. Therefore, production decreases lowering supply for domestic consumption as well as exports. This means that the rest of the world will be supplying less goods to these economies while, possibly, buying less from them.
The main results indicate that the economy may shrink in the vicinity of 1,54 per cent. If trade changes respond accordingly to the estimated elasticity of trade to growth (Freund, 2009), Colombian real trade flows may decline by 5,7 per cent. This outcome, of course, will be affected by the impacts arising from other transmission mechanisms (mainly foreign investment and remittances, but also international credit availability) and new developments in the international economy that may affect the performance of the Colombian economy. As the consumer price index decreases in 1,3 per cent, the decline in real GDP would be around 0,24 per cent.
The paper is organized as follows. Section two provides some background on the crisis. Section three illustrates on the most recent behavior of the transmission channels in the case of Colombia. Section four states the objective of this research and presents the modeling strategy. Section five discusses the model structure regarding the areas of interest for the objective proposed and describes the scenarios simulated. Section six presents and discusses the results. Lastly, section seven concludes.
I. Background on the Global Economic Crisis1
The current global financial and economic crisis is the most serious threat that the world has faced in over half a century. According to Eichengreen and O'Rourke (2009) world industrial production, trade, and stock markets are going down faster than in 1929-1930. In its July 2009 update of the World Economic Outlook, the International Monetary Fund (IMF) forecasted 1,4 percent negative growth for the global economy during the current year (a 0.1 per cent deterioration over its April update). The severity of the crisis is readily appreciated if one considers that the corresponding figure for the IMF's January forecast was a positive 0,5 percent and that global growth recorded 5,1 percentage points in 2007 and 3,1 percentage points in 2008.
The global economy is expected to gradually return to positive growth in 2010 (the IMF forecasts 2,5 percent growth), thanks to numerous monetary and fiscal stimulus programs in developed and developing countries. However, it is generally agreed that recovery will likely be sluggish (IMF, 2009) and that the crisis will have a significant impact on poverty reduction in spite that developing countries are expected to experience lower growth decline (Chen and Ravallion, 2009).
It is accepted that the global financial and economic crisis originated in the 2006 mortgage crisis in the United States. That crisis was itself seeded by both the United States (US) Federal Reserve and inadequate practices among financial institutions and intermediaries. Its origin can be traced back to expansionist monetary policy earlier in the decade that drove US interest rates to very low levels. This policy played a major role in resuscitating US economic growth in the years that followed, but also led to unprecedented levels of debt among American households2. This was coupled up by risky banking practices among financial institutions which approved mortgages to barely solvent households at higher interest rates, known as ''subprime'' mortgages. The subsequent process of converting subprime debt into complex financial products (including asset-backed commercial paper) via securities markets, together with liquidity inflows in search of attractive investments, internationalized the bad (subprime) credit that was present among many American households.
The mortgage crisis began to unravel in 2006 when the Fed introduced a sequence of major increases to the interest rate3. The policy was aimed to counter the threat of rising inflation in the American economy, in the context of spectacular increases in market prices for petroleum and most primary materials. The strategy not only affected inflation but resulted in millions of American households facing foreclosures4, leading to the ''mortgage crisis'', also known as the ''subprime crisis'', in the second quarter of 2006. Following, the ''mortgage crisis'' spread, affecting first American financial institutions all across the board and then European ones in the second quarter of 2007. The global ''financial crisis'' was then born. Finally, a loss of confidence took hold at the global level and what has been termed the ''confidence crisis'' hit the real economy in the autumn of 2008, transforming the ''financial crisis'' into a global ''economic crisis''.
''Financial contagion'' across international financial markets has been the main channel through which the crisis transmitted to industrialized and emerging economies. Emerging economies come from a decade of remarkable growth performance, significantly higher than that of developed nations. This had led to posit a new conventional wisdom in the sense that these economies have become of age and the rulers of their own economic performance. The idea that emerging economies have decoupled from advance economies' business cycle (flouted for instance in Hebling et al., 2007) seemed to be confirmed by their resilience before the subprime crisis. However, analysts fear that a prolonged and deep recession in the US may send them in disarray notwithstanding evidence that their business cycles are indeed becoming relatively independent from those of industrial countries –at least in the financial sphere (Kose et a., 2008).
Relatively weak integration into the global financial system seemed to shelter most developing countries from the effects of the crisis. However, as it has become more of a real sector crisis, for most developing countries this may be characterized mainly as a ''trade crisis'' (Evenett and Hoekman, 2009). Trade is expected to shrink by 10% in 2009, the worst decline since the Great Depression. According to Freund (2009), in the first quarter of 2009 global nominal trade fell by 30% on average relative to the same period last year. A decrease attributable partly to a massive decline in final demand and a shortage of trade credit (Baldwim and Evenett, 2009). Nevertheless, the decline in final demand and the trade credit crunch alone do not seem to explain neither the sudden collapse of trade nor that trade contraction has been rather asymmetric and that this asymmetry does not seem to be correlated with exposure to the crisis. In fact, Irwin (2002) and Freund (2009) find that the elasticity of real world trade to real world income has been increasing from about 2 in the 1960's to near 3,7 in the 2000's; an increase that may be due to the international fragmentation of production (Yi, 2008) and to vertical foreign direct investment (Tanaka, 2009). This is due to the fact that income (GDP) is a net measure (vale added) while trade is a gross measure. An increase in GDP, linked to greater outsourcing, will lead to a greater increase in trade as materials and parts travel along the globe back and for before getting to the final consumer.
The macroeconomic impacts and the distributive effects of the economic crisis in developing countries will largely depend on the magnitude and length of the recession in developed countries, the main transmission channels applying in each case, the initial conditions in each country, and the macroeconomic policies they implement to respond to the crisis. The main transmission channels delivering the effects of the crisis at the global level to the national economies of developing countries are trade, capital flows and investment, remittances, and international aid.
II. Behavior of the Transmission Channels in the Case of Colombia
Trade is expected to be one of the most important transmission channels. Trade openness is about 30 percent in Colombia and there is a high dependency in trade on the US and the EU, two of the regions for which trade is expected to shrink the most. About 39 percent of Colombian exports and 29 percent of Colombian imports are to and from the US, while the figures corresponding to trade with the EU are 19 percent and 22 percent, respectively.
For the first five months of 2009, total Colombian exports decreased 17,7 percent with respect to the same period last year. Traditional exports decreased 24% (mainly due to lower sales of oil and its derivatives, -40,1 percent; although in terms in volume there was an increase of 23,7 percent) and non-traditional exports decreased 10,3 percent (mainly due to lower apparel exports, -40,5 percent, and lower exports of plastics, -25,7 percent). Exports to the US decreased 27,5 percent during the same period, lead by a decrease in fuels and mineral oils and its derivatives of about 34,5 percent (DANE, 2009).
Regarding imports, figures for the first five months of 2009 show a decrease of 16,3 percent (with respect to the same period last year). This decrease was led by lower vehicles and parts imports, -37,5 percent and recording and imaging equipment, -42,3 percent. Imports of air navigation equipment, iron and steel products, and pharmaceutical products increased; 82,8 percent, 41,5 percent, and 17,4 percent, respectively (DANE, 2009).
Remittances from abroad amounted to US$4.492,6 million in 2007 and US$4.842,4 million in 2008. In 2008, remittances were equivalent to almost 13 percent of total Colombian exports (the corresponding figure for 2007 was 15 percent). During the period January-May 2009, remittances represented US$1.773,5 million; 9,6 percent below the same period a year before. Given that, historically, there has been no marked seasonality in the behavior of monthly remittance flows continuation of this trend would imply a near 10 percent annual decrease, most likely affecting poor urban and rural households (Banco de la Rep ública, 2003).
After an annual increase in 2008 with respect to 2007 of about 17 percent (US$10,600 million vs. US$9.049 million), FDI in Colombia (according to the Colombian central bank, 2009) showed a 12 percent decrease in the first quarter of 2009, as compared to the same time period in 2008. However, according to press reports, during the first five months of 2009, the decrease amounted to 15 percent. Along the 2006-2008 period, FDI has traditionally been the highest in the oil sector (34 percent), followed by the mining sector (19 percent), the manufacturing sector (15,4 percent), and the financial sector (11,5 per cent). Excluding investment in the oil sector, the largest foreign investor in Colombia, during 2006-2008, was the US (37,6 percent), followed by Anguilla (17,8 percent) -a country that until 2006 (included) has never invested in Colombia-, and by Panama (11,9 percent) and Spain (10,9 percent).
International aid relatively lacks economic importance in Colombia. In 2007, official development assistance and official aid amounted near US$731 million (0,35 percent of GDP). In spite of this, any decline in international aid will be felt by the poorest of the poor in the country.
As follows from the above, the main foreseeable transmission channels in the case of Colombia are trade, remittances, and capital inflows. The importance of neither is extremely high in the Colombian case, but all of them are significant in determining GDP growth. Between 2003 and 2007, the Colombian economy grew at an annual rate above 4,5 percent, reaching 7,5 percent in 2007. However, in 2008 growth dropped to 2,5 percent. Quarterly annualized growth rates during 2008 were positive but decreasing during the first three quarters of the year (4,1 percent, 3,9 percent, 2,9 percent) and negative in the fourth quarter (-0,7 percent, or -1 percent with respect to the third quarter). The behavior of the last quarter was determined by drops of 8 percent each in the construction and in the manufacturing sector, compounded by slight decreases in the agricultural (0,6 percent) and the commerce (0,1 percent) sectors. The economy stayed in the positive side thanks to the mining sector (6,6 percent increase) and the services sector (financial, 4 percent; electricity, gas, and water, 1 percent; transport, 0,8 percent; and social services, 0,5 percent). Recently released figures show that the economy shrunk again in the first quarter of 2009 (-0.6 percent with respect to the same time period a year before) nominally entering into recession. Also, unemployment (that has slowly decreased during the second half of 2008) is increasing again. In May 2009, the unemployment rate was 11,7 percent, 0,9 percent more than in May 2008.
III. Objective and Modeling Strategy
As follows from the above, the crisis (that started as a financial one) has become a real sector crisis. While it is true that none of the transmission channels briefly depicted operates in isolation, it is useful and illustrative for analytical and policy reasons to attempt to assess the likely impact of the crisis through these channels. The objective of this paper is to provide an approximation to such an assessment for the trade channel for several Latin American economies, with a short run perspective (i.e. to the likely trade impacts from the 2009 projected slump of the US and EU's GDP).
A real sector model is employed for this end. I make use of the standard GTAP model, a static, decreasing returns, multiregion, general equilibrium model widely used for trade and other global phenomena analysis. The model is described in detail in the GTAP web page5. The modeling strategy can be broadly described as follows. A shock, detailed ahead, is applied to the US and EU economies in such a way that it yields as a result a decline in the value of GDP similar to the one that has been forecasted for these economies by the most recent estimate issued by the IMF (2009). The shrinkage of these economies is transmitted to the rest of the world mainly through the trade channel. As the different forms of demand decline, the economy demands less goods and services from both domestic and foreign origin. Therefore, production decreases lowering supply for domestic consumption as well as exports. This means that the rest of the world will be supplying less goods to these economies while, possibly, buying less from them (due basically to lower supply).
Dixon et al. (2009) portrait the credit crisis as having an effect similar to that of a sales tax. In a credit crisis, households and firms that can normally obtain credit to conduct transactions find out that they no longer have access to it. Therefore, a credit crisis inhibits economic transactions in much the same way that a sales tax would do. Their modeling strategy (with a real sector dynamic model) is thus to implement a ''phantom'' sales tax on transactions in which credit is important (like durables purchases by households and firms inputs for capital creation) in such a way that economic activity is hindered consistently with OECD's forecasts for GDP. Of course, no tax revenue is collected by the government and no taxes are actually paid for by firms and households (all tax revenue is given back to firms and households as a lump sum). The tax is just a device for lowering purchases of the relevant goods and services.
Results obtained by these authors and consideration of the actual behavior of the US currency and foreign trade, left them with the need to conduct a simulation in which there is a sharp reduction in investment but no real depreciation (and hence no positive and strong trade response). This led the authors to explore several alternative ways of modeling the crisis, among them a contraction in world demand for US exports and excess capacity. In the first modeling exercise (Dixon et al., 2009), the authors thought that excess capacity was adequately represented by the shift in the capital-labor ratio that occurs as a consequence of lower labor supply in the face of fixed capital at the industry level. As it turns out, this assumption would lead to high capital returns decreases that inevitable generate currency depreciation (and a rebound in trade). Therefore, the authors fix the model to explicitly introduce excess capacity by means of sticky adjustment of capital rent rates (Dixon and Rimmer, 2009).
As I am interested in the short run effects of the crisis and make use of a static model, I draw on Dixon and Rimmer's (2009) intuition as well as on Clark et al (2008) to model the impact of the crisis on the US and EU economies as a negative shock to the capital endowment of these economies.
The procedure is akin to having a certain level of excess capacity without leading to a decrease in the capital rental rate, avoiding an unrealistic effect on international trade.
On the other hand, there is need to model labor markets (for both skilled and unskilled labor) as featuring fixed wages while the number of workers adjusts to clear the market. This way, the main characteristics of the short run development of the crisis are captured: excess capacity, unemployment, and sticky wages. Admittedly, the approach used here lacks the detail (and differentiated effects) that the Dixon et al (2009) approach has. However, as the path along which the economy recovers is of no importance for our objective, I believe this to be an acceptable limitation.
IV. Model Structure and Scenarios
Before moving to describe the scenarios that are implemented, it is convenient to discuss a couple of features of the GTAP model that impinge upon the results. There are two ways in which the economies embodied in the model interact. The first is international trade. The second is global savings and investment.
As in most trade models, trade is modeled based on the Armington assumption (i.e. traded goods are differentiated by their country of origin). This is typically handled by means of Constant Elasticity of Demand (CES) functions. Therefore, agents source imports independently of the price of domestic like products. This separability in demand implies that each source region has some market power, since its product is only imperfectly substituted for by products originated in other regions.
According to Zhang (2008), there are two well known drawbacks common to Armington models. First, they tend to yield larger than expected changes in inter-country relative prices (i.e. result in relatively large terms of trade effects), especially for small countries (as their export demand elasticities depend mainly on the Armington elasticity in the importing country, whereas export demand elasticities for large countries are affected by market share). Second, they tend to yield smaller than expected changes in inter-industry relative prices and, therefore, in national output (possibly underestimating gains from allocative efficiency).
The general equilibrium properties of an Armington model are controlled through the choosing of an ''appropriate'' Armington elasticity value. It has to be set above one to avoid ''abnormal'' behavior in the model, since a lower than unity value implies that consumers regard country of origin differentiated products as gross complements. However, high elasticity values would be inconsistent with products of different origin being dissimilar.
Hence, in an Armington model trade shifts from one supplier to the other are determined by the Armington elasticity. This is critical when a shock implies changes in market access conditions. However, in a situation as the one we have at hand (where there are no such changes) the above mentioned shortcomings of the model seem to be less severe, but it is likely that some underestimation of trade flows changes takes place.
Regarding savings and investment we have the following. Because the global economy is closed, Walras Law implies that global income must equal global expenditure or that global savings must equal global investment. However, global savings is just the aggregation of regional savings and, therefore, it is determined by them. Being a static model, there is no explicit intertemporal optimization and regional savings are determined by constrained static optimization. Savings is an argument in the regional household utility function and constrained optimization leads to a demand for a homogeneous savings good. As in the case of any other good, demand for savings depends on the income level of the regional household and on the relative price of the savings good.
The savings good is supplied by a global bank. The global bank is just a device for aggregating savings from and for allocating investment to the regions. The bank sells a homogenous savings good to each region and buys shares in a portfolio of regional investment. Once the bank has collected all regional savings, there are two possible ways in which it allocates investment.
One follows the ''fixed regional composition'' criterion. That is, investment is allocated to regions in such a way that the regional composition of global capital stocks does not change. In this case, regional and global net investment (regional investment minus depreciation) move together and rates of return will differ among regions (while the global rate of return will just be a weighted average of regional rates of return.
The second is based upon the idea that there is a competitive allocation of investment across regions and, therefore, expected returns are uniform globally. In this case, investment depends on the ''expected'' rate of return and this, in turn, inversely on the capital stock. Global investment is allocated so that changes in the expected rate of return are equalized across regions and the global rate of return changes by the same percentage.
With the closure I use here, global investment is savings driven. That is, the global bank adjusts global investment to meet any change in global savings. However, it should be noticed that although there is balancing at the global level, this is not necessarily so at the regional level since regional economies are open. The regional budget constraint implies that expenditures must equal income or, simpler, that the difference between savings and investment must equal the difference between exports and imports.
From the above, it follows that there may be implications on changes in trade flows arising from the particular way it is assumed that the global economy reaches the savings-investment equilibrium. While the representation of savings-investment flows in the model is not ''realistic'', the two alternatives provide plausible scenarios and it becomes advisable to observe estimated trade impacts arising from the crisis under both.
Lastly, it is important to notice that I use a general equilibrium closure, allowing for full adjustment of the economy. This rule is broken in the case of the US and the EU in that, as mentioned, labor markets clear through employment levels rather than wage levels. For regions of interest other than these two6, I make consideration of an alternative closure that fixes the relative trade balance (i.e. the ratio of the current account to GDP). This allows, in the case of a competitive allocation of investment across regions, to avoid the ''free lunch'' effect that can arise from potentially high foreign capital inflows. However, it must be noticed that the existence of a global bank controls this effect to a large extent.
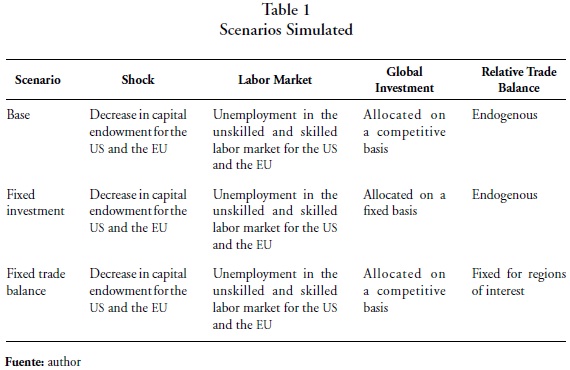
As follows from these considerations, the scenarios that are simulated in this research share a common feature: capital endowments for the US and the EU are negatively shocked in such a way as to attain drops in the value of GDP close to forecasted levels. Beyond this, the first scenario considers that global investment is allocated on a competitive basis, the second scenario that global investment is allocated following the fixed regional composition assumption, and the third scenario considers that global savings are allocated on a competitive basis but that the regions of interest (those for which we want to assess the extent of the trade transmission channel) keep their relative trade balance fixed. Table 1 summarizes the characteristics of the scenarios.
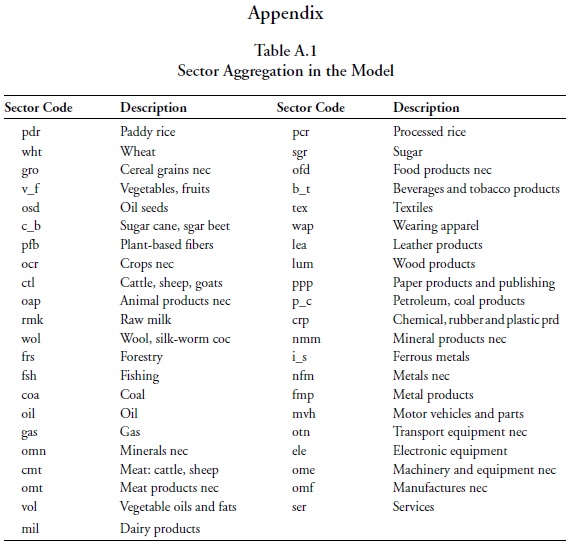
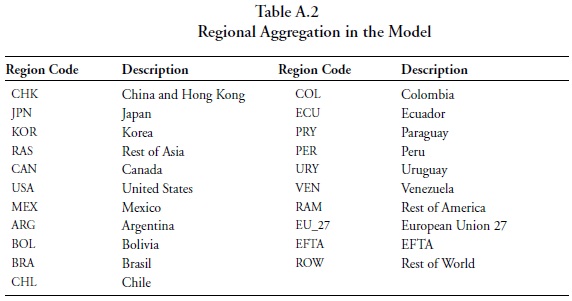
The model runs on version 7 of the GTAP database, which has 2004 as the base year. It has 21 regions and 43 sectors. The regional disaggregation emphasizes the Western Hemisphere and its main trade partners.
The sectoral disaggregation keeps agricultural, resource-based, and manufacturing sectors as detailed as the database allows. Tables A.1 and A.2 in the appendix summarize both aggregations.
V. Results
A. The case of the US and the EU-27
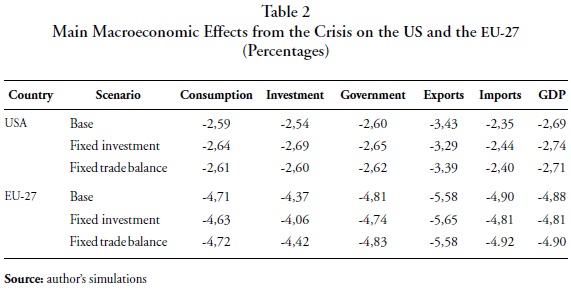
As mentioned, the US and EU's economies are negatively shocked to reduce their capital endowment. The US capital endowment is reduced by 4 per cent, while that of the EU is reduced by 6,5 per cent. As a result the US' GDP drops by 2,69 per cent and the EU's by 4,88 per cent under the base scenario. The corresponding IMF's (2009) forecasts for the two economies are -2,6 per cent and -4,8 per cent, so the estimates arising from the simulation are reasonably close to the expected behavior of these economies.
Table 2 shows the main macroeconomic effects arising from the simulations. From there it can be appreciated that for both countries there is small variation in GDP changes under the three scenarios. In the case of the US, exports are the GDP component that is the most affected, while imports is the least affected. As regards the EU, foreign trade is affected the most. Exports show the highest percentage change, followed by imports. As expected, given the type of shock implemented, changes in all components of GDP are commensurate with the total change in GDP for both regions.
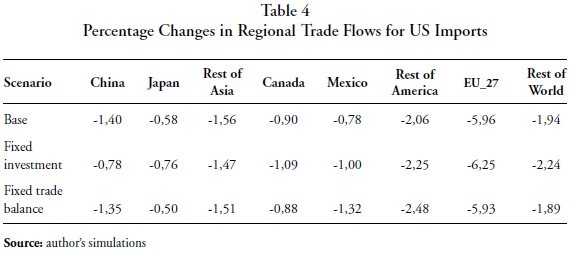
In spite of changes in exports and imports, the regional structure of trade (in terms of regional shares) practically does not change for neither of the two countries. Tables 3 and 4 show percentage changes in trade flows for the main US trade partners, for exports and imports, under the three scenarios.
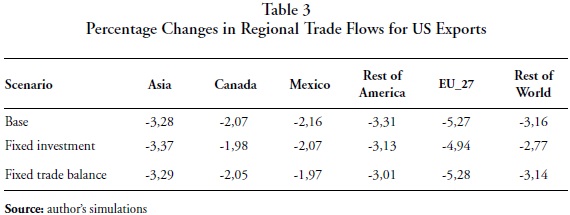
Taking into account that US exports decrease in between 3,3 per cent and 3,4 per cent, depending on the scenario (Table 2), it is clear that trade with the EU decreases more than proportionally, as this region also dips into the crisis, while US exports to Canada and Mexico decrease the least.
US imports decrease around 2,4 per cent under all scenarios. As happens with exports, imports from the EU decrease the most and proportionally more than exports do. Therefore, there is more shifting among regions in US import flows as imports from regions other than the EU decrease moderately, especially in the cases of Japan and Canada (Table 4).
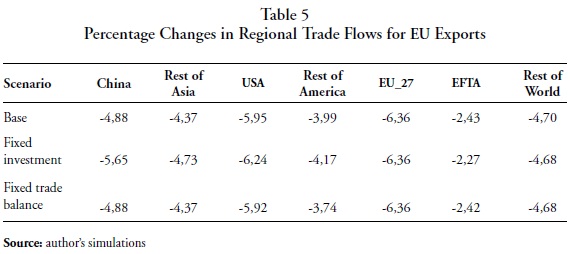
As regards the EU, Table 5 shows percentage changes in regional export flows for the region. As EU's exports decrease around 5,6 per cent (Table 2), intra EU exports and exports to the US decrease more than proportionally. In this case, EFTA countries are the ones for which EU exports decrease the least. It should be noticed that trade with China suffers the most among regions other than the EU and the US.
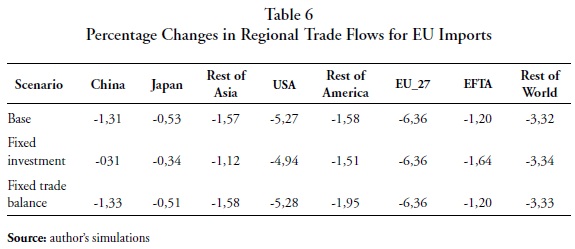
Lastly, Table 6 presents percentage changes in regional imports by the EU. EU's imports decrease between 4,8 and 4,9 per cent, so it follows from the table that intra EU trade and imports from the US make the bulk of the adjustment. However, it must be noticed that trade with the Rest of the World also bears an important adjustment.
In terms of volumes, trade shrinks for both regions. Export volumes from the US to all regions decrease. Exports to the EU contribute in between 40,2 per cent and 41,6 per cent to trade shrinkage, depending on the scenario, while exports to Asia contribute from 26,7 per cent to 28,4 per cent. Exports to Canada account for around 11,5 per cent of the decrease, while exports to Mexico for around 6,6 per cent. In the case of the EU, the greatest contributor to export shrinkage is intra-EU exports. It accounts for around 70 per cent under all scenarios. The second largest is trade with the US, which makes up in between 9,3 and 9,7 per cent of export volume decreases.
Imports volumes decrease as a whole for the US. However, not all import flows decrease, as there are regions for which figures are positive. The most notable cases are those of Canada, Mexico, and EFTA under the base scenario (although increases are meager in general). The situation is similar for the EU. Imports from EFTA (under the base scenario and the fixed trade balance scenario) and China and Japan (under the fixed investment scenario) increase modestly while decrease for the rest of regions. The EU is the biggest contributor to the decrease in US imports, under all scenarios followed by Asia. In the case of the EU, intra-EU trade shows the biggest share in trade shrinkage (around 88 per cent), followed by the US (7,8 per cent as average).
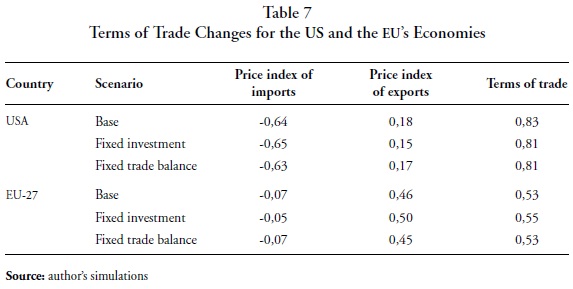
A notable result is the way terms of trade play to somehow mitigate the deterioration of the two economies (a characteristic associated with both being big countries). As shown in Table 7, the price index of imports decreases relatively sharply in the case of the US, while the price index of exports increases. This brings, as a result, a noticeable improvement in the terms of trade for this economy. Important but lower improvements in the terms of trade attain for the EU. However, in this case, they are mostly due to an important increase in the price index of exports (although the price index of imports decreases, the decrease is relatively modest).
B. The Case of the Colombian Economy
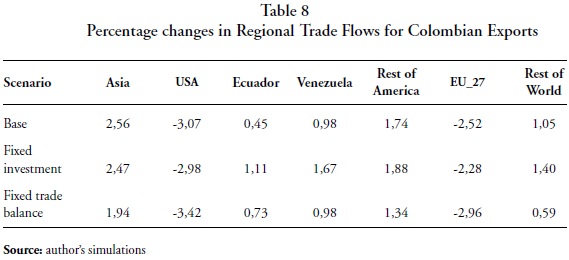
As a result from the shock, Colombian exports decrease 1,1 per cent under the base scenario, 0,9 per cent under the fixed investment scenario, and 1,4 per cent under the fixed trade balance scenario. Table 8 shows percentage changes in Colombian exports value according to destination. From there, it can be appreciated that exports to the US and the EU decrease while exports to other regions increase, most notably to Asia. In contrast, total export volumes increase. The biggest increase is found under the fixed investment scenario, followed by the base scenario (24 per cent lower), and by the fixed trade balance scenario (62 per cent lower). Export volumes to the US and the EU decrease under all scenarios. The biggest decrease corresponds to the fixed trade balance scenario, followed by the base scenario and by the fixed investment scenario. Volume decreases are substantially higher for exports to the US as compared to exports to the EU. Therefore, total exports volume increase is due to larger exports to other destinations. In particular, exports to the Rest of America make the bulk of export volume increases.
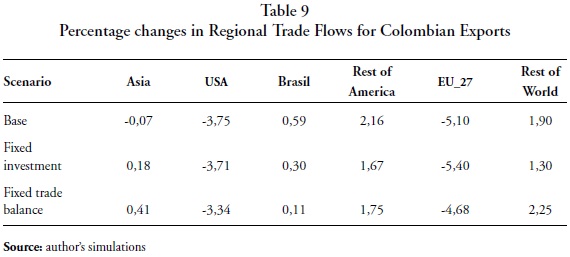
From the side of imports, Colombian trade also decreases. Imports value decrease by 1,6 per cent under the base scenario, 1,8 per cent under the fixed investment scenario, and 1,4 under the fixed trade balance scenario. The figures in Table 9 indicate that imports from the EU decrease the most, in between 36 and 46 percent more than imports from the US. Imports from the rest of regions generally increase, in particular those from the Rest of America. Total import volumes also decrease under all scenarios. However, this behavior is determined by the decline in import volumes from the US and the EU. As a matter of fact import volumes from the rest of regions increase in almost all cases (the only exceptions are imports from Bolivia and Paraguay, two marginal suppliers) under the fixed investment scenario.
The contrast in the behavior of exports and imports values and volumes indicates deterioration in terms of trade. In effect, the price index for imports declines 0,27 points while the price index for exports declines 2 points. As a result, terms of trade for the Colombian economy deteriorate 1,74 points.
Changes in trade impinge upon quantity of output for the economy. The Colombian GDP quantity index decreases by 0,01 per cent under both the base and the fixed investment scenarios, and shows practically no change under the fixed investment scenario. The top five sectors in terms of output quantity increases are: other machinery and equipment; electronic equipment; leather products; chemical, rubber, and plastic products; and textiles. The bottom four sectors, in terms of output quantity decreases are: coal, oil, other crops (including coffee and cut flowers), and gas. The bottom five sectors contributing to total output quantity decrease (i.e. weighted by their share in total output) are: services; oil; coal; other crops; and petroleum and coal products.
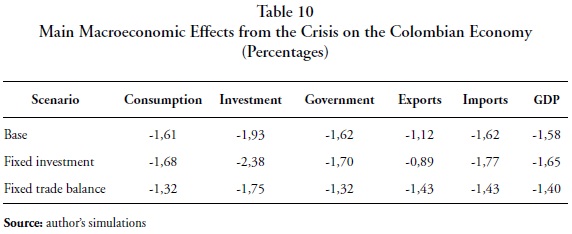
The GDP price index decreases under all scenarios. It falls 1,57 per cent under the base scenario, 1,63 per cent under the fixed investment scenario, and 1,4 per cent under the fixed trade balance scenario. Therefore, as shown in Table 10, Colombian GDP decreases in between 1,4 and 1,65 per cent. All components of GDP from the expenditure side decrease. Decreases are proportional to the fall in GDP; however, it should be noticed that exports decrease the least and investment decrease the most under almost all scenarios.
Real factor returns decrease for all factors but unskilled labor. Real returns fall as follows: land 0,46 per cent, skilled labor 0,07 per cent, capital 0,08 per cent, and natural resources 8,14 per cent. The drop in the latter is large as several of the sectors for which output decreases the most are heavily dependent on natural resources. Real returns for unskilled labor increase by 0,03 per cent. Therefore, the distributional effects from the crisis appear to favor unskilled workers.
Welfare changes summarize all the above effects. Table 11, shows the equivalent variation (i.e. how much more money a consumer would pay before a price increase to avert the price increase) attained under the three scenarios, as well as the contributions of the US and EU economies to welfare results. Welfare losses represent 0,4 per cent of GDP in the base year under the base and fixed investment scenarios and 0,3 per cent of GDP under the fixed trade balance scenario. It is worth noticing that the impact from the EU's economy is larger than that arising from the US economy. In average, the EU contributes about 56 per cent of welfare changes.
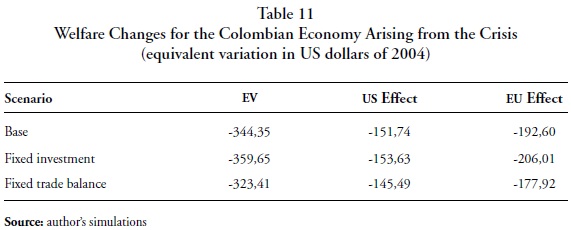
Decomposing welfare results in terms of allocative effects, savings/investment balance effects, and terms of trade effects, it turns out that terms of trade effects are, by large, the main determinant of welfare changes. The contribution of terms of trade to welfare ranges from 92 to 95 per cent; that arising from the EU's economy represents around 57,6 per cent of terms of trade effects (the remaining 42,4 per cent stems from the US economy). On the other hand, changes in quantity of output have a positive but negligible effect on welfare (between 5,1 and 6,5 million dollars), while imports record negative contributions (between 17,4 and 22,2 million dollars) and exports and consumption of domestic production small positive contributions.
C. Sensitivity Analysis
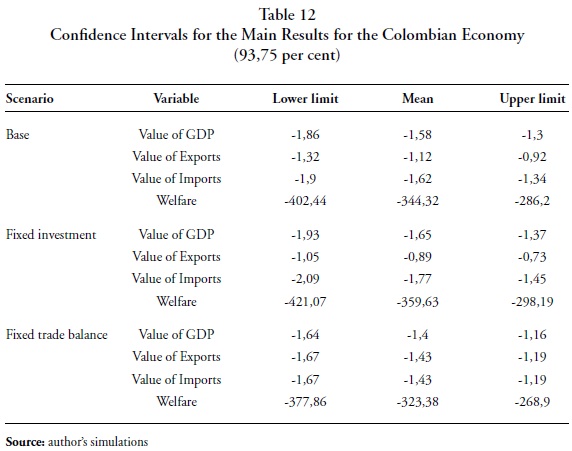
To ensure that the above results are robust, a systematic sensitivity analysis was performed by varying the level of the capital endowment shock. The decrease in capital endowments for the US and EU's economies was allowed to vary 25 per cent below and above the simulation levels (4 per cent for the US and 6,5 per cent for the EU economy).
Confidence intervals at the 93,75 per cent level are shown in Table 12 for the main results. From there, it can be appreciated that results are robust in that there are no sign switches within the intervals. The Colombian economy may be expected to lose GDP, to show lower export and import levels (in terms of value), and to experience welfare loses.
VI. Comments on the Results and Conclusions
This research attempts to provide an avenue for assessing the short run impact of the financial and economic crisis on the Colombian economy, as it is transmitted along and (mostly) only through the trade channel. For this a real sector model is used, the multiregion, constant returns to scale, computable general equilibrium GTAP model. The modeling strategy is based on implementing a negative shock to the capital stock of the US and EU's economies, in such a way that the resulting behavior of the value of GDP is close to that forecasted for 2009 by the IMF. It also considers that labor markets in these economies clear by adjusting the level of employment, an assumption consistent with a short run perspective and observed behavior.
Results for the US and EU's economies indicate that the US economy may shrink in between 2,69 and 2,74 per cent and the EU's in between 4,81 and 4,9 per cent. The value of exports would decrease around 3,37 and 5,6 per cent in the US and the EU, respectively, while the value of imports would do so by around 2,4 per cent in the US and 4,87 per cent in the EU. US exports to Colombia are estimated to fall 3,6 per cent on average (across scenarios), while imports from Colombia may decline by 3 per cent. On the other hand, EU's exports to Colombia are expected to decline 5 per cent on average and imports from Colombia by 2,5 per cent.
Colombian trade is expected to decrease. The value of exports would shrink by 1,15 per cent on average and the value of imports by 1,61 per cent, also on average. Exports to the US are estimated to decrease by 3,2 per cent and imports from the US by 3 per cent. On the other hand, exports to the EU would decrease by 2,6 per cent and imports from there by 5,1 per cent. The differences between these figures and the corresponding ones from the perspectives of the US and the EU respond to adjustments in trade costs (international transportation). It is estimated that Colombian GDP would decrease 1,54 per cent on average (across the three scenarios).
In the case of the US and EU's economies, the estimated decline in GDP closely matches (by design) that forecasted by the IMF (2009). In contrast, the resulting estimation for the decrease in trade is well below (the IMF forecasts a 13,6 per cent decline in imports volume and a 15 per cent decline in exports volume for advanced economies). As mentioned in section 2, with the fragmentation of international production, frequently accompanied by vertical FDI, changes in GDP get amplified when reflected in changes in trade. Therefore, a decline in GDP, linked to smaller outsourcing, will lead to a greater decrease in trade as intermediate goods cease to travel back and for, at the international level, before a good gets to the final consumer. If, as Freund (2009) estimates, the growth elasticity of trade is near 3,7, a 2,6 per cent decline in US' GDP may lead to a 9,6 per cent decline in trade and a 4,8 per cent decrease in EU's GDP to a 17,8 per cent decline in trade.
There may be several reasons why a model like the one used here do not reflect such a big change in trade when GDP is affected (leaving aside issues related to parameters, like the elasticity of substitution between domestic and imported goods). One may be sectoral aggregation. The more aggregated the sectoral representation of the economy in the model, the less likely it is to fully reproduce the full impact of trade in intermediate goods. In a way, aggregation tends to damp the extent of trade. However, this effect is relatively minor as compared to that of other factors.
By its own nature, the model cannot take into account a whole set of factors that may bear heavily on trade changes. Freund (2009) lists a series of reasons why trade may respond more sharply to GDP during global slowdowns than during normal times, which are not taken into account in this modeling exercise. (a) firms may draw down accumulated inventories sharply when faced to forecasts that deteriorate unexpectedly; (b) during crisis, protectionist policies tend to kick in; (c) goods decline by more than services during downturns, and services make up the bulk of GDP, while goods make up the bulk of trade; (d) firms may tend to source relatively more from home country suppliers during downturns because of trust or financing problems. Furthermore, being a financial crisis, the issue of trade financing is key. Escaith and Gonguet (2009) provide an approximation to the analysis of the role of international supply chains as transmission channel of a financial shock. They show that when banks operate at the limit of their institutional capacity, and if assets are priced to market, then a resonance effect amplifies the back and forth transmission between real and monetary circuits, sharply lowering trade flows.
Even though this type of models seem to underestimate trade flows changes, not only because of the above but also due to the constant returns to scale specification, they tend to yield more precise estimates for GDP changes. The main reason is that big changes at the sectoral level translate into relatively small changes in the aggregated economy. In other words, it takes dramatic and key changes at the sectoral level (including trade) to generate sizeable changes at the aggregate level. For instance, it takes a 4 per cent reduction in the US' capital stock (a truly big shock in a key variable) to get a decrease of 2,6 per cent in GDP. Therefore, at least for a case like the one that is of interest here, estimates for the change in GDP should be deemed more dependable than, say, changes in trade flows.
It follows from the above that, in spite of an understandable underestimation of changes in trade flows, the estimated change in Colombian GDP should be close to the expected effect that the international crisis may have on the Colombian economy, as it is transmitted through the trade channel. According to the results presented, the economy may shrink in the vicinity of 1,54 per cent. If trade changes respond accordingly to the estimated elasticity of trade to growth (Freund, 2009), Colombian real trade flows may decline by 5,7 per cent. This outcome, of course, will be affected by the impacts arising from other transmission mechanisms (mainly foreign investment and remittances, but also international credit availability) and new developments in the international economy that may affect the performance of the Colombian economy. As the consumer price index decreases in 1,3 per cent, the decline in real GDP would be around 0,24 per cent.
References
1. Baldwin, R. and Simon E. (eds.). ''The collapse of global trade, murky protectionism, and the crisis: Recommendations for the G20'' [online], available at: http://voxeu.org/index.php?q=node/3199, accessed on July 13, 2009. [ Links ]
2. Chen, S., and Martin R. (2009). ''The Impact of the Global Financial Crisis on the World's Poorest'' [online] available at: http://www.voxeu.org/index.php?q=node/3520; accessed on July 13, 2009. [ Links ]
3. Clark, G., O'Rourke, K. and Taylor. A. (2008). '' Made in America? The New World, the Old, and the Industrial Revolution'', American Econmic Review: Papers & Proceedings, pp. 98:2, 523-528. [ Links ]
4. Decaluwe, B. and Flores, R. (2009). The distributive impact of the global financial and economic crisis on developing countries. A survey, PEP Research Network, draft vesion, May 12. [ Links ]
5. Develpment Research Centre on Migration, Globalization, and Poverty (2009) Migration and the Financial Crisis: How will the Downturn Affect Migrants, Briefing No. 17, February. [ Links ]
6. Dixon, P. and Rimmer M. (2009, June 10 to 12). ''Simulating the US Recession'', early incomplete draft, [conference] 12th GTAP Annual Conference, Santiago, Chile. [ Links ]
7. Dixon, P., Rimmer, M. Johnson, M. and Rasmussen C. (2009, June 10 to 12). ''The Effects of a Credit Crisis: Simulations with the USAGE Model'' [conference], 12th GTAP Annual Conference, Santiago, Chile. [ Links ]
8. Eichengreen, B., and O'Rourke K. (2009). ''A Tale of Two Depressions'' [online], available at: http://www.voxeu.org/index.php?q=node/3421, accessed on July 13, 2009. [ Links ]
9. Escaith, H., and Gonguet, F. (2009). International Trade and Real Transmission Channels of Financial Shocks in Globalized Production Networks, Staff Working Paper ERSD-2009-06, World Trade Organization, Economic Research and Statistics Division, May. [ Links ]
10. Evennet, S. and Hoekman, B. (2009). ''Policy Responses to the Crisis: Implications for the WTO and International Cooperation'' [online], available at: http://www.voxeu.org/index.php?q=node/3738, accessed on July 13, 2009. [ Links ]
11. Freund,C. (2009). ''Demystifying the Collapse in Trade'' [online], available at: http://www.voxeu.org/index. php?q=node/3731, accessed on July 13, 2009. [ Links ]
12. Hebling, Thomas. et al. (2007). ''Decoupling the Train? Spillovers and Cycles in the Global Economy'' World Economic Outlook, pp. 121-60. [ Links ]
13. International Monetary Found –IMF– (2009). World Economic Outlook. Update. An update of the key WEO projections, July 8. [ Links ]
14. Douglas, I. (2002). ''Long-Run Trends in World Trade and Income'', World Trade Review, 1: 1, pp. 89-100. [ Links ]
15. Kose, M. Ayhan, Otrok, Ch. and Prasad, E. (2008) ''Global Business Cycles: Convergence or Decoupling?,'' IMF Working Papers 08/143, International Monetary Fund. [ Links ]
16. Organisation for Economic Co-operation and Development –OECD– (2009) OECD International Trade Statistics. Press Release, July 15. [ Links ]
17. Tanaka, Kiyoyasu (2009). ''Trade Collapse and Vertical Foreign Direct Investment'' [online], available at: http://www.voxeu.org/index.php?q=node/3537, accessed on July 13, 2009. [ Links ]
18. UNCTAD (2008) World Investment Report 2008, United Nations, New York and Geneve. [ Links ]
19. World Bank (2009) Global Development Finance. Charting a Global Recovery. I: Review, Analysis, and Outlook, Washington. [ Links ]
20. Yi, K-M (2008). ''The collapse of global trade: The role of vertical specialisation'' in Richard Baldwin and Simon Evenett (eds.), ''The collapse of global trade, murky protectionism, and the crisis: Recommendations for the G20'', A VoxEO.org publication. [ Links ]
21. Zhang, Xiao-Guang (2008). ''The Armington General Equilibrium Model: Properties, Implications, and Alternatives'', Working Paper, Australian Government, Productivity Commission, Melbourne, February. [ Links ]
Primera versión recibida el 4 de mayo de 2009; versión final aceptada el 26 de junio de 2009.
Note
1 This section draws on Decaluwe and Flores (2009).
2 The Fed's headline interest rate consistently declined between May 2000 and June 2003, reaching its lowest level since 1954, at 1 percent; this remarkably low interest rate remained relatively stable over the twelve months that followed (The Reserve Federal Board, http://www.federalreserve.gov/fomc/fundsrate.htm; April 24, 2009).
3 From 1 percent in June 2004, the Fed's headline interest rate rose to 5.25 percent in June 2006 (The Reserve Federal Board, http://www.federalreserve.gov/fomc/fundsrate.htm; April 24, 2009).
4 http://www.americanprogress.org/issues/2007/03/foreclosures_numbers.html (April 1, 2009).
5 https://www.gtap.agecon.purdue.edu/
6 This feature is enabled for Mexico, Argentina, Brasil, Chile, Colombia, Ecuador, Peru, and Venezuela.
Appendix