Serviços Personalizados
Journal
Artigo
Indicadores
-
 Citado por SciELO
 -
 Acessos
Links relacionados
-
 Citado por Google
 -
 Similares em
SciELO
 -
 Similares em Google
Compartilhar
DYNA
versão impressa ISSN 0012-7353versão On-line ISSN 2346-2183
Dyna rev.fac.nac.minas v.75 n.154 Medellín jan./mar. 2008
RATIONAL ENERGY USE AND WASTE MINIMIZATION GOALS BASED ON THE USE OF PRODUCTION DATA
ESTABLECIMIENTO DE METAS DE USO RACIONAL DE LA ENERGÍA Y DE MINIMIZACIÓN DE DESECHOS BASADAS EN LA UTILIZACIÓN DE DATOS DE PRODUCCIÓN
ENRIQUE POSADA
Ingeniero Mecánico, MSc, INDISA S.A, Medellín, Colombia , eposadar@indisa.com.co
Recibido para revisar Mayo 05 de 2007, aceptado Agosto 08 de 2007, versión final Agosto 21 de 2007
RESUMEN: Las empresas productivas acostumbran a generar conjuntos muy amplios de datos, relacionados con la producción, con los desechos, con la energía y con aspectos ambientales. Estos números tienen un potencial grande de utilización como base racional para establecer metas de mejoramiento continuo, de minimización de desechos, de reducción en los consumos de energía y de control ambiental. Sin embargo, no ocurre esto generalmente, probablemente porque las personas responsables carecen de conocimientos específicos sobre cómo usar estos datos con estas finalidades. Lo más común es que se establezcan metas fijas sin base real, sin relación con los niveles de producción ni con los consumos de energía y de producción de desechos. Este artículo muestra cómo utilizar datos para procesos de seguimiento y establecimiento de metas aplicables a la reducción de desechos y de consumos de energía. Se basa en la experiencia del autor en más de 20 casos industriales.
PALABRAS CLAVE: URE, energía, ahorros, metas, minimización, estadística, datos, seguimiento.
ABSTRACT: Companies normally generate rich sets of data, related to production, waste, energy and environmental parameters. These numbers have a great potential to be used as rational means to establish goals for continuous improvement, waste minimization, energy use reduction and environmental pollution control. However, this is not the case, in general, because people in charge lack knowledge on how to use the data for this purpose. It is common that fixed goals are set without real bases, with no relationship to production levels or energy and waste real data. This paper shows how to use data for monitoring process and targeting goals for waste minimization and specific energy use reduction. It is based on the experience of the author on applying this practice to more than 20 industrial cases.
KEY WORDS: rational energy use, energy, savings, minimization, statistics, monitoring
1. INTRODUCTION MANAGEMENT OF ENERGY RELATED INFORMATION
Industrial companies gather a lot of process information as part of their normal working procedures. This information is gathered both by operators in written formats and by automatic means based on the process instrumentation. The author had the opportunity of visiting more than
30 companies in Colombia in 2006, as part of an energy auditing effort made by its company, INDISA, to several customers. In these visits the author found the following, in relationship to the use of energy related data:
- Most companies gathered enough useful information as to be able to establish meaningful energy use indicators. All of them used the data to calculate energy costs for their general process.
- Only a handful was able to use them to calculate costs for specific operations or processes. In general the energy data was general and only in a few cases was related to specific operations.
- About two thirds of the companies had the data taken to Excel electronic sheet data formats and calculated, with them, specific energy use indicators. The rest of the companies did not show evidence of doing anything special with the information
- About 35 % of the companies made graphs of the behavior of the indicators against time. This was the major use of the indicators. Usually these companies had goals associated with the indicators. In all cases, the goals were based on fixed numbers, without attempts to relate them to production levels or to scientific or technological basis.
The normal use the companies did with the data was to prepare a table of consumptions and costs of energy against production for periods of time. These tables are usually presented in graph form, using bar graphs. In a few cases dispersion graphs are used. Figure 1 shows a typical graph.
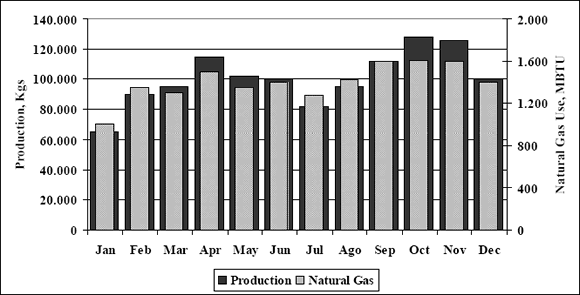
Figura 1. Gráfico típico de barras con datos de producción y consumo de energía
Figure 1. Typical bar graph presentation of production and energy data
Only a couple of the visited companies used the energy data in correlation with the production. In no case the specific energy consumption indicators were employed to establish rational energy use or energy saving goals. This was always discussed with the company personal in an attempt to establish a reference frame to give the visited companies the best possible advice on establishing goals for rational use of energy.
2. RATIONAL USE OF APPROPRIATE SPECIFIC ENERGY CONSUMPTION INDICATORS FOR TARGETING AND MONITORING
Given the observed facts, the author made a deliberate effort to discuss with the companies how to use energy and production data to generate rational and attainable goals. In the reports written as a result of the auditing program, a procedure for this was explained and the data gathered was used as an example of the procedure. This can be done by means of the calculation of specific consumptions (electric energy kwh per ton of production and fuel consumption per ton of production, for example). These are very appropriate indicators, since they give comparable objective units which can be examined both in relationship to time and to production rates. The use of specific consumptions allows the company to draw very useful conclusions and enable it to establish goals for savings and energy rational use. This is based on obtaining graphs with the indicator as function of production rates. Figure 2 shows a typical graph, prepared with the data of figure 1.
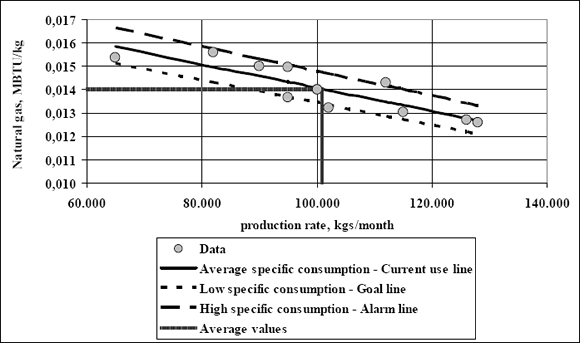
Figura 2. Datos de consumos específicos presentados con metas de uso racional de la energía
Figure 2. Specific consumption data for rational energy use goals
The normal thing observed in this type of graphs, is a tendency for the specific consumption to diminish when increasing the production rate. When observing the graph, it is evident that at least three data regions can be located. One of them includes the near average data. An average line data can be obtained, for example, using linear correlations or similar averaging techniques. This is shown as a black line which includes the average data and which represents data close to it. Other set is conformed by the data with lower specific consumptions. There is a line of representative minimum values shown as a short slashed black line and called Goal line. A third set corresponds to the larger specific consumptions and in the graph a long black slashed line has been drawn to represent the maximum values for this set, called the
Alarm line. What these two lines indicate is that there is a relatively ample range of specific consumptions, resulting from the normal operation for the process. This fact gives rise to the opportunity of establishing realistic goals of reductions of consumptions, based on real data and process parameters that occur actually.
The high (alarm) and low (goal) specific consumption lines were drawn in a conservative way, at the criteria of the author, and do not include the entire range of high and low consumption points.
The Alarm line, gives indication of the extremes of inefficient operation that are occurring at the current forms of work at the process. Paying attention to these operating ways, will show the things that could cause excessive expenses or inefficiencies. Even more useful, is the line of lower smaller consumptions, the goal line which gives indication of the extremes of more efficient operation that are currently occurring. These more efficient ways are real, attainable and can be studied and determined. It is possible to use the line as a base to established realistic specific consumptions goals, with the existing systems and available knowledge and means
By using this technique, realistic goals of reduction of consumptions with respect to the present average situation were proposed for the majority of the companies that were visited. Three major points were stressed:
- It is important to try to use the equipment at points in which they show higher operating efficiencies. Usually they will occur at higher production rates. Attaining this will be related to logistics, programming, sales and a good knowledge of the best operating points for the process.
- Its is possible to attain the energy consumption reductions signaled by the goal line, simply based on process internal auditing and close operation attention, usually without the need of investing in additional equipment. However, the savings will allow for some basic expenses and investments to facilitate the operation and the monitoring of the processes with the goals in mind.
- Specific energy consumptions goals are related to production rates. A table of production rate related goals should be prepared and used as a base for targeting and monitoring. Fixed goals will not give a real sense of what is happening.
In this perspective, historical analysis of data does not lose importance. The historical monitoring of production rates and costs is now complemented with the monitoring of the historical behavior of the indicator. With the idea of targeting and monitoring, it is important then to analyze the causes of the variations that occur and to make decisions that will allow to lower the consumptions of energy and other resources. The stated goals of specific consumption are to be reached based on the monitoring of the indicator. A team of people focused in the energy efficiency looks for the fulfillment of the goals, putting attention in the operation and control of the systems and equipment that consume the greater amounts of energy.
When good results are obtained, attention should be paid, at once, to observe what might have happened, in order to be able to replicate the results and the learning. Also, when the indicators show abnormal rises of consumption, remedial actions are to be proposed and taken at once, based on analysis of the possible causes. In this form the energy working team will be detecting and taking actions that will result in the continuous diminution of the consumptions. This will mean, eventually, the establishment of new and more demanding goals. It is possible to obtain the goals of reduction by this methodology in less of a year. The basic steps are:
- Establish a responsible team, conformed by people from process, engineering, maintenance, administration and operation.
- The team should be trained in techniques of continuous improvement, group work, analysis of opportunities and strategies.
- Establish appropriate specific indicators for the plant in general and for specific equipment and processes, supported by adequate monitoring of associated production and energy variables.
- At least once weekly, the behavior of the indicators should be analyzed.
- Propose actions and take them to practice.
- Gather and stimulate ideas from the involved personnel.
- Let the results, targets and benefits be known by all parties.
3. GENERALIZATION OF THIS TECHNOLOGY BASED IN RESULTS OBTAINED IN A STUDY OF 21 INDUSTRIES.
The author decided to take a general view of the results obtained after getting energy consumption information from 21 companies in Colombia , with the idea of proposing a simple system to find targeting goals based on statistical information on production rates and energy usage for a given process. In order to do this, the information was converted to non dimensional numbers, so that very different ways of measuring rates and specific consumptions could be compared. The non dimensional numbers were:
Indicator of production rate= Rate / Average rate
Indicator of specific consumption = Specific consumption / Average specific consumption.
Figure 3 shows the data for figure 1 and figure 2 presented in this non dimensional format.
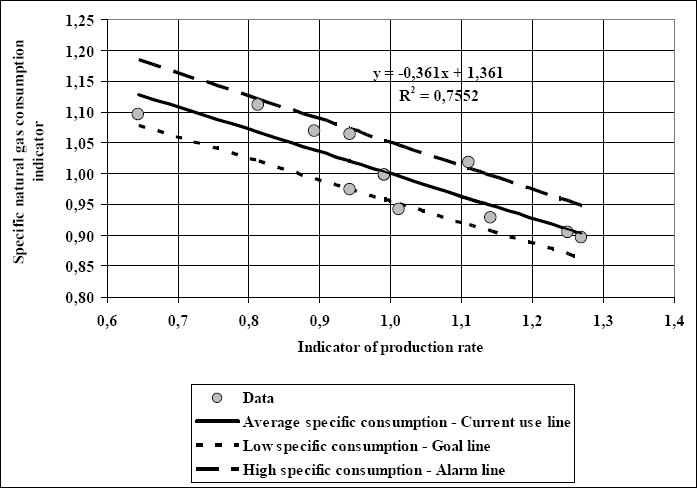
Figura 3. Datos de consumos específicos de las figuras 1 y 2 presentados en forma no dimensional
Figure 3. Specific consumption data for figures 1 and 2 presented in non dimensional format
The linear tendency of the data shows a correlation factor R2 of 0.755, with a slope of -0,361 and an intersection of 1,361. The range of the production indicator is from 0,65 to 1,28. The specific consumption indicator goes from 0,90 to 1,12 . The possible savings at average production are of 4.5 %, while the over costs are of 5,0 %. The standard deviation for the production indicator is 17,7 % and standard deviation for the specific consumption indicator is 7,4 % compared each one to their respective average values.
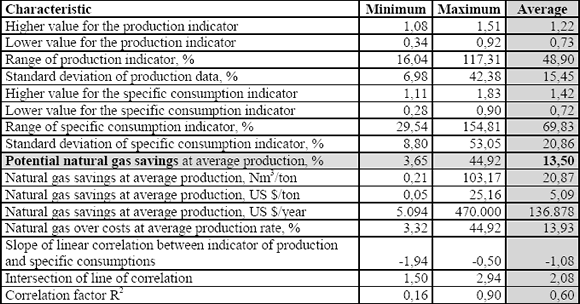
Twenty one different companies with 27 processes were studied in the following fields: Cement production, scrap steel works, sewing threads manufacturing, steel car rings manufacturing, coffee roasting, rice milling, beer manufacturing, fiber cement roofing tile manufacturing, aluminum can manufacturing, rubber tire manufacturing, brake paste manufacturing, cocoa roasting, barley malt roasting. In most cases general production indicators were considered, in some cases specific systems were part of the study. In general, data corresponded to monthly averages, but in some few cases daily data were studied. For this study two energy resources were considered, electricity and natural gas. For each case non dimensional graphs, similar to the ones shown in figure 3, were prepared, and the correlation factors of the linear correlations were obtained, plus the other factor associated, including possible savings and over costs.
Tables 1 and 2 show the general characteristics of the gathered data, using the non dimensional indicators. In the table, the possible yearly savings at average production were calculated based in the current electricity cost (0,088 US $ per Kwhr) and natural gas cost (0,244 US $ per standard cubic meter)
Tabla 1. Resultados para los consumos específicos de electricidad (datos de 27 procesos)
Table 1. Results for specific electric energy use (data for 27 processes)
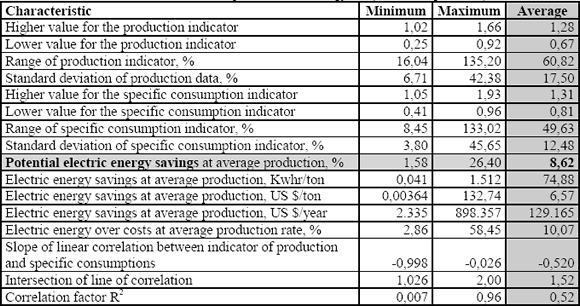
Tabla 2. Resultados para los consumos específicos de gas natural (datos de 8 procesos)
Table 2. Results for specific natural gas use (data for 8 processes)
The data is now shown in general graphs (fig 4 and 5) for all the cases studied, correlating the non dimensional indicators for production and specific consumptions. The high and low specific consumption lines were drawn in a conservative way, at the criteria of the author, and do not include the entire range of points.
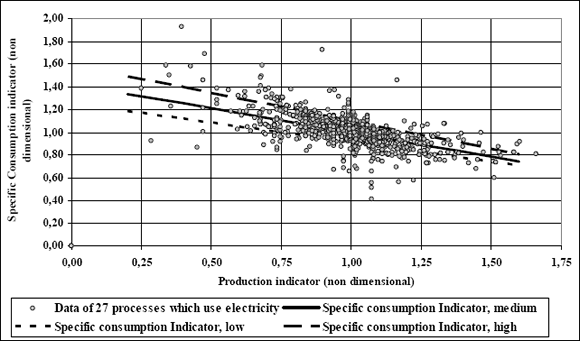
Figura 4. Análisis estadístico de consumos específicos de electricidad en una muestra de procesos industriales en Colombia
Figure 4. Statistical analysis of electricity specific consumption in a sample of industrial processes in Colombia
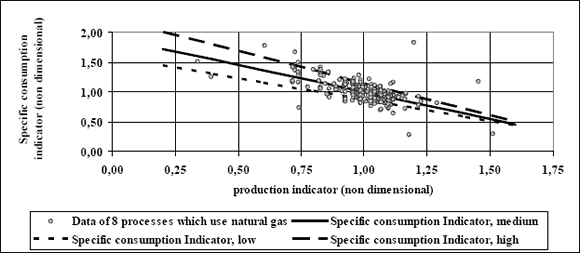
Figura 5. Análisis estadístico de consumos específicos de gas natural en una muestra de procesos industriales en Colombia
Figure 5. Statistical analysis of natural gas specific consumption in a sample of industrial processes in Colombia
It is very interesting that such a diverse set of data can be arranged in a general graph. This was possible with the use of the non dimensional indicators.
Figure 6 shows the potential savings deducted from figures 4 and 5, as a function of the production indicator. It is clear that the savings tend to diminish with production.
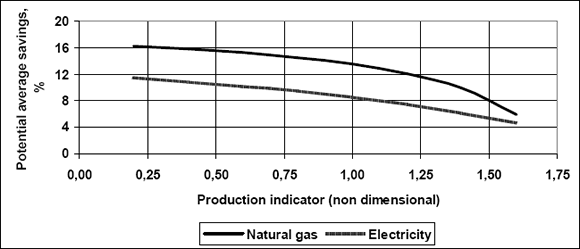
Figura 6. Ahorros potenciales para las muestras estudiadas mediante seguimientos operativos
Figure 6. Potential savings for the studied sample as a result of operational monitoring
The average potential savings were correlated with the different variables of which the average values were presented in tables 1 and 2. The idea is to be able to predict the potential savings as a function of statistical production and consumption data. It was found that the savings could be correlated with standard deviation for non dimensional specific consumption and with the range of values for this indicator, expressed as percentage. Figure 7, for example, shows the correlation found with the range of the specific consumption indicator). Table 3 shows the proposed correlations presented as a result of this study for the statistical variables considered.
Tabla 3. Correlaciones lineales propuestas para predecir los ahorros potenciales en los procesos estudiados
Table 3. Linear correlations proposed to predict potential savings in the studied industrial samples

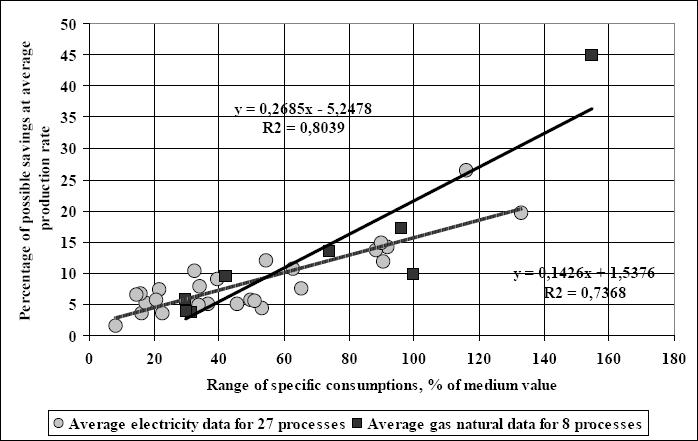
Figura 7. Correlación de los datos de ahorros potenciales de electricidad y gas natural gas a producción promedio contra el rango de variación del indicador de los consumos específicos
Figure 7. Correlation of data of savings of electricity and natural gas at average production with the range of the specific consumption indicator
4. CONCLUSIONS
The proposed method of data analysis permits a more rational approach to rational energy use, as the goals can be declared in relationship to production goals. This demands a more comprehensive and technical analysis, but will direct the companies to greater savings and more knowledge of their process.
The proposed methodology is based on the use of existing data plus a monitoring and goal setting program, applied to normal production. In principle, no investments are considered.
The existing potential for savings, based on normal operative practices and process monitoring is large. This study, based in 21 well established companies in Colombia, found electricity potential savings of 8,6 % and gas natural potential savings of 13,5 % , in the average. This savings could be reached by
operative practices and getting them will help greatly in the national programs related to global warming and sustainable development.
It is possible to predict potential savings in specific energy consumption by using statistical data of production and specific energy consumption, based on a non dimensional format for the data.
REFERENCES
[1] POSADA, ENRIQUE. Guía de buenas prácticas de manejo energético en las pequeñas y medianas empresas, Medellín, Centro Nacional de Producción más Limpia, Medellín, 2002 [ Links ]
[2] FIKSEL, JOSEPH. Ingeniería de diseño medio ambiental. DFE, McGraw-Hill, Madrid, 1997 [ Links ]


