Services on Demand
Journal
Article
Indicators
-
 Cited by SciELO
 -
 Access statistics
Related links
-
 Cited by Google
 -
 Similars in
SciELO
 -
 Similars in Google
Share
DYNA
Print version ISSN 0012-7353On-line version ISSN 2346-2183
Dyna rev.fac.nac.minas vol.76 no.160 Medellín Oct./Dec. 2009
AUTOMATIC VISUAL MODEL FOR CLASSIFICATION AND MEASUREMENT OF QUALITY OF FRUIT: CASE Mangifera indica l
MODELO VISUAL AUTOMATICO PARA LA CLASIFICACION Y MEDIDA DE CALIDAD DE FRUTO: CASO Mangifera indica l
Pedro Atencio
Grupo de Investigación y Desarrollo en Nuevas Tecnologías de la Información y la Comunicación , Universidad del Magdalena
Germán Sánchez T
Grupo de Investigación y Desarrollo en Nuevas Tecnologías de la Información y la Comunicación , Universidad del Magdalena
John William Branch
Grupo de Investigación y Desarrollo en Inteligencia Artificial – GIDIA, Universidad Nacional de Colombia – Sede Medellin jwbranch@unal.edu.co
Recibido para revisar septiembre 25 de 2009, aceptado octubre 28 de 2009, versión final octubre 31 de 2009
Abstract: The physical properties of fruits in the agriculture industry constitute the main information in the quality determination for activities as exportation. This work presents a visual inspection based method for the classification of mango (Mangifera Indica L.). The classification process is made according to the Norma Técnica Colombiana (Colombian Technical Norm) NTC 5139 standard, by means of automatic estimation of physical properties of fruits, such as height, width, volume, weight, caliber, and maturity level using the Principal Component Analysis and a fruits ellipsoidal 3-D model. Finally, the level of maturity is inferred through a similarity measure of the color distribution between the fruit and experimentally fixed models in the HSL space. The results showed that the method is computationally efficient, non invasive, precise and of low cost.
KEYWORDS: Digital image processing, volume and color estimation, mango fruit.
RESUMEN: Las propiedades físicas de las frutas en la industria agrícola constituyen la principal información en la determinación de calidad para las actividades como la exportación. Este trabajo presenta un método basado en la inspección visual para la clasificación de mango (Mangifera indica L.), acorde con la Norma Tecnica Colombiana NTC 5139, realizado mediante la estimación automática de las propiedades físicas de la fruta, como la altura, anchura, volumen, peso, calibre y nivel de madurez, por medio de la utilización del Análisis de Componentes Principales y un modelo elipsoidal tridimensional del mango. Por último, el nivel de madurez se infiere a través de una medida de similitud de la distribución de color en el espacio HSL, entre la fruta y un modelo experimental fijo. Los resultados mostraron que el método es computacionalmente eficiente, no invasivo, preciso y de bajo costo.
PALABRAS CLAVE: Procesamiento digital de imágenes, fruto mango, estimación del color y volumen en frutas.
1. INTRODUCTION
The correct and agile evaluation of physical properties of products in food industry has represented one of the most relevant issues in this industry, because of the high value in costs and time required by this process. The solution in many of the cases has been the augmentation of personnel, but the general tendency is the implementation of automation technology. The high cost of these technologies has represented an obstacle because this technology cannot be used by small and medium sized companies devoted to this industry, which in Colombia represents a high percentage: therefore, computer vision is an efficient, quick and cheap technique to support productive processes. Its speed and accurateness in estimation and measurement of parameters are the main features which complement the nonexistence of errors related to subjective interpretation. In addition to this, it is a non invasive natural technique, which turns it into a very suitable technique to be used in the food industry. In this field, specifically in mango processing, the process of fruit selection, according to national rules that determine the physical features that fruits must have to be exported, use to be manual, performed by a group of people, not necessarily supported by rigorous measurement steps by means of specialized instrumentation due to the long time this implies. On the contrary, most measurement and classification processes are performed by means of a process of subjective interpretation, optimized through practice. From the determination phases of maturity degrees, to the measurement of physical features and classification for exportation, precise estimations are required, which make possible for an adequate classification. This work presents a method based on visual inspection for the classification of sugar mango fruit (Mangifera Indica L.), according to standards described in Colombian Technical Norm NTC 5139 [1], through automatic measurement of fruit's physical properties such as height, width, volume, weight, caliber, and maturity. The method begins with image acquisition, which is later pre-processed and segmented. The fruit caliber is estimated according to NTC-5139 which co-relates mango caliber with its weight. Finally, the maturity degree is inferred through estimation of a similarity measurement between color distribution represented in a histogram of the mango segmented image and a set of pattern histograms determined by experimentation (See Figure 1). This work is organized as follows: Section 2 shows a set of works related to visual inspection in the food industry. Section 3, describes the procedures of image pre-processing. Section 4, presents the proposed method for the estimation of fruit maturity level. Section 5, describes the proposed method for fruit caliber estimation. The following sections describe experimental results and the conclusions.
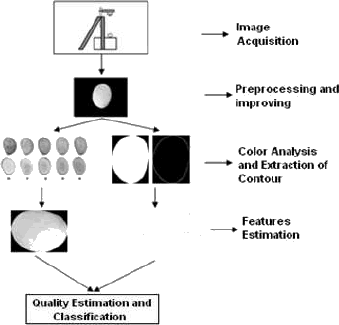
Figure 1. Proposed method for the classification process of Mangifera Indica L Fruit
2. LITERATURE REVIEW
Computer vision attempts to simulate the performance of human vision as to the inspection of color, content, shape and texture [2]. Supported by learning systems, computer vision provides a mechanism in which human thought is artificially simulated and can help people to make complicate decisions in an accurate, fast and very consistent way over long periods of time [3]. Learning techniques can be used to automatically find nontrivial or significant relationships over a set of training data and produce a generalization of those relations that can be used to interpret new test data [4]. Therefore, using sample data from a learning system can generate an updated basis to improve the classification of subsequent data from the same source, and express the new base in an intelligible symbolic form [5]. However, there is a need for further research about the combination of computer vision and learning techniques of food quality inspection[6].
An automatic classification system of strawberries was developed by [7] with an effectiveness average in the evaluation of the shape and size from 98% to 100%, respectively, and invariant to the position and orientation of the fruit with a processing time of 1.18 s. In [8] an image processing algorithm is developed, based on Fourier expansion to objectively characterize the shape of the apple and thus identify different phenotypes. This research showed that four images per apple were needed to quantify the average shape of a randomly chosen apple. This analysis of profile can be used to characterize the list of existing apple shape descriptors as defined by the International Plant Genetic Resources. Therefore, this study shows a relationship or link between subjective shape descriptors and objective measures of shape recognition.
Some other recent studies in computer vision, associated with classification of vegetables, color inspection and defects in the classification of peppers are presented in [9]. Morrow et al. [10] present techniques of Visual inspection of mushrooms, apples and potatoes in terms of size, shape and color. The use of computer vision for the location of the stem-root junction in carrots has also been addressed in [11]. Feature extraction and pattern recognition techniques were developed by [12] to characterize and classify carrots by surface defects, curvature and fragility. The rate of misclassification was below 15% in a total of 250 samples examined. More recently, onions were scanned by X-rays to examine internal defects [13]. An effectiveness average of 90% was achieved when spatial and transformation characteristics were evaluated in the classification of products. A broader review of work in the area can be found in [14] and its references.
3. IMAGE ACQUISITION, PRE-PROCESSING AND SEGMENTATION
Image acquisition, pre-processing and segmentation represent important steps in computer vision systems. These steps determine, largely, the behavior of the system in later stages [16]. After we acquire the images, we pre-processed them, applying brightness and contrast adjustment, and Median and Gauss Filters [15].
3.1 Image segmentation
In image segmentation, each pixel is classified according to the background or to the fruit. Pixels that are in the range [(0:r),(0:g),(0,b)], where r, g, b are threshold values for the RGB color model in the image, are considered as belonging to the background and their value is set to 0 for each channel. The other pixels represent the fruit, and then their values are not modified. Hence, if C(x, y) denotes the intensity value of a channel C for a pixel in the point (x, y) of a RGB image, G(x, y) denotes the value obtained by filtering the color and µ denotes the filter threshold for the channel C, then we get:

Once the color filter is applied, the image shown in Figure 2a, is obtained. In this image, both the object and the background are distinguishable without ambiguity.
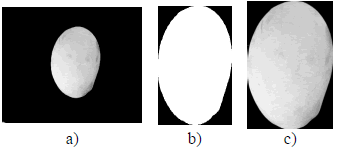
Figure 2. a ) Color-Filtered Image b) Fruits BLOB and c) segment of Fruit Extracted
In a subsequent processing, the image is converted to gray scale and binarized using a thresholding method for labeling objects that belong to the image [17] (Figure 2b).
4. FRUIT MATURITY ESTIMATION METHOD
The technical standard NTC 5139 defines 5 based-graphics color models for classification of fruits in their varying stages of maturation (see Figure 3). For classification, the standard shows the distribution of internal color (related to pulp color) and external color, (referring to the fruit skin). Due to the invasive nature of the internal analysis of the fruit, in this work the determination of the level of maturity is based on analyzing the color distribution of the skin or peel of the fruit, similar to what an expert would do.
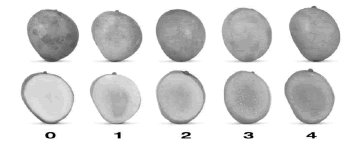
Figure 3. Fruit maturation level’s table color from NTC
While the manner in which a human expert makes the determination of the level of maturity of a fruit is a complex process to be modeled automatically, there are tools that allow to express the distribution of color through mathematical models in a quantitative way. These tools constitute, among others, the HSL ( Hue , Saturation, and Lightning) color system, which defines the possible range of colors, by defining three axes that describe separate features to define a color [18].
The estimation of the level of maturity is a procedure by which the acquired initial image, pre-processed and segmented, is compared with fixed models that indicate each of the levels of maturity described in the norm. This comparison is performed by estimating the difference in models of color in the HSL space. The estimated HSL color model for each of the images requires initially, the transformation of each color in the RGB space to HSL space. This change of space is performed initially by normalizing the RGB colors as shown in Equation 2.

Where R, G, B are the values of three RGB color space layers of a pixel in the image.
Then, each one of the values of the corresponding HSL components is obtained through the equations 3, 4 and 5.
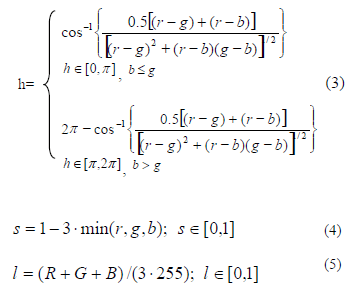
Because the method used in this work is based on the comparison of histograms, it is necessary to transform the values of the components H, S and L to the range [0.255] used for 8-bit images. The conversion of these values is expressed by equations 6, 7 and 8.

Finally, the estimated level of similarity of each particular fruit and each of the models that represent different levels of maturity of mango are calculated. The models for each level are fixed and they have been estimated as average histograms of a sample of fruit from each of the selected levels of maturity through the assistance of an expert. The similarity measure takes into account the color distribution of each of the layers of color model used. That is, the level of similarity is given by the average similarity in each of the layers of color model of the acquired image and a model.
As mentioned earlier, H and S components of the HSL model are the ones that really represent the color of the image, so the component L is not used in this paper to determine the color of the fruit. Because of this, the determination of the level of maturity is given by the minimization of the functional of similarity with respect to a model histogram (see Equation 9).

Where M is each of the reference models, J is the image of the fruit for which you want to infer its level of maturity. S(M, J) is the similarity function and  is the distance measure between an image M and image J in a X layer.
4.1 Model histograms estimation
For the estimation of these histograms, sampling was conducted independently, assisted by an expert of fruit in each classification in accordance with the standard. Then, the histograms H and S layers of each image were obtained, and finally each of the histograms of each layer was averaged. The average histogram is expressed in Equation 10.

Where  is the average histogram of the layer k of a set of images n.
4.2 Measure of similarity between histograms
The distance between any two histograms can be expressed in terms of the distances of the measures of the values of its elements. Given two data sets of n elements, A and B, this problem is considered as finding the minimum difference between pairs of the two sets. The problem is to determine the best relationship between two data sets so that the sum of all differences between a pair of individual elements is minimized. For these reasons, this method evaluates the mean square error between the normalized histograms of each of the layers H and S of an image with respect to two model histograms H and S, and calculates the average, according to the following equations:
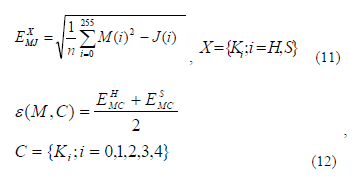
Where  is the mean square error of the histograms M and J of the layer k.
 is the average of the errors between histograms H and S of an image M and the set of model histograms C. A set of histograms model consists of two histograms: H and S, which have been obtained through averaging the histograms of H and S layers of two-dimensional images of a set of mangoes belonging to the same level of maturity. Finally, error minimization allows to find the greatest similarity of a two-dimensional image of a sugar mango with a set of model histograms. This allows to estimate the level of maturity of a mango that is described on an image.
5. FRUIT CALIBER ESTIMATION METHOD
5.1 Contour extraction and geometric dimensions estimation
Different approaches have been proposed for estimating geometric dimensions [18-19]. However, the automatic application of these approaches is often difficult and sometimes requires taking the image in a fruits particular position. This paper proposes a robust mechanism to estimate geometrical-measuring, independent of the fruit location inside the image, by the application of the Principal Component Analysis (PCA) to the fruit contour. It is, the direction of the axis that describes the mayor tendencies represent an estimation of the fruits length and width.
For this, the pixels group that forms the contour is initially obtained. Note that it is not necessary to analyze the pixels complete group, that is to say, the pixels inside the fruits image, because what is sought is to find the direction of the axis on which to measure these lengths. To determine the contour pixels group, a recursive search over the completed image is applied, by extracting a group of the contiguous pixels that appear in its neighborhood (determined by the surrounding Grid) black and white neighbors. This group represents the fruit contour and is named  . The 4 shows the graphical result of the extraction procedure.
When the C group is obtained, the main fruit lengths are similar in direction in respect to the principal component directions in C . To estimate the principal directions in C, we use a Multivariate Statistical Model named PCA or Karhunen-Loève transform [20]. It begins with covariance estimation of ci making a dimensional reduction to  . The matrix of covariance is defined according the Equation 13.

Where,  is the C size and
  is the center of mass point of c , and is defined by:

The PCA method returns as many vectors as spatial dimensions have the data; in this particular case, we worked with Bi-dimensional images, hence two vectors were obtained. Thus, the  corresponds to the Eigenvalues and the
  are the Eigenvectors of Mc. If
  , then v1 represent direction of the minor variability in the data and coincide with the direction of the line that crosses through the width of the fruit. In a similar way, v2 represents the direction of the principal variability in the data that is an approximation of the fruit length.
If we consider the fruit length as the longest line that cuts the fruit contour twice, then in order to measure it, we start a path from the images center of mass  in the v2 direction to both sides. The amount of pixels through the line is calculated, as it approximates to the real value of the fruit length. In this work, the width of the mango was defined as the longest line that cuts the contour in two different points and is perpendicular to the line of length. So, the second direction v1, which is perpendicular to the length line, was used to find the longest line to measure the width. The found length and width can be observed in Figure 4.
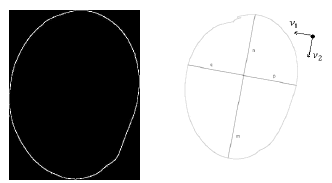
Figure 4. Contours and its estimated Principal Components
In order to approximate the fruit volume, we reconstruct a three-dimensional model that approximates the volume by ellipses, as in [21]. The geometrical features of both the Manila and sugar mango differ in its roundness, so we approximate the fruit volume by only four sections formed by two lines intersection. This intersection defines 4 semi-axis; n, m, p and q, as shown in Figure 5.
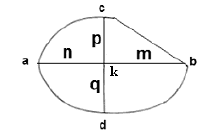
Figure 5. Manila mango fruit’s sections [4]
Let a, b, c, d be the endpoints of the principal axis that belongs to the extracted contour and k the point of interception of the principal axis  and
and  , the principal axis are defined by:
  ,
,  . Finally m and q are the complementary axis.
Once we defined the four components n, m, p and q, the volumes of the four segments were approximated by segment of ellipses, those volumes: V1, V2 y V3, were defined by the equation 15-17.
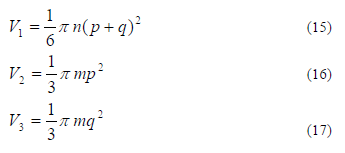
where V1 is half part of the volume of the ellipse formed in the region 1, its ratio is n and  ; V2 is a quarter part of the volume of the ellipse formed in the region 2, with ratio p and m; V3 is a quarter of the ellipses volume formed in the region 3 with ratio q and m.
The total volume of the mango Vt , is defined by the sum of volumes in each of the regions (see Equation 18).

Once the volume of the mango is obtained, the procedure to approximate the weight is carried out. We use the relationship among the mass, volume and density (see the Equation 19):

Where, d represents the density of the fruit, Vt is the estimated volume and m is an approximated measuring of the mass. The density was experimentally defined by a measuring fruit set M. For each one, the mass and the volume was measured with specialized instruments. Thus, d is defined as the average density estimated from the samples.

Where, N is the size of the sample M and Vi and mi correspond to the volume and average weight of each mango respectively. Because this quantity is an average, it will be most representative if the sample N is larger. And the estimated weight will be more accurate (see Figure 6). Finally, the weight is estimated by the Equation 21.

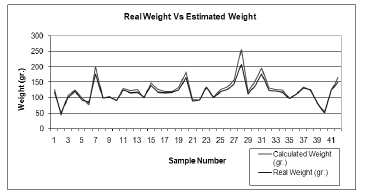
Figure 6. Real weight vs Estimated weight
The caliber estimation is made by a direct comparison of the estimated weight and the Table 1 ranges.
Table 1. NTC 5139 Technical standard Fruits Caliber
Tabla 1 . Calibres del mango de azúcar de la norma técnica NTC 5139

6. EXPERIMENTS AND RESULTS
The fixed images used in this study were obtained with a KODAK digital camera, to control the lens height in relation to the fruit. The resolution used to take the photos was 1280 x 960 pixels, in .jpg format, to obtain the best relationship between computational expense and quality of estimated measurements. A sampling was performed with 142 fruits. An image of every fruit was taken, and its weight was measured by a scale with grams resolution. The images where stored in RGB format, for the segmentation stage, in which a technique of color filtering was used. The illumination factor was worked under normal conditions with white light. To make the extraction of the mango easier in relation to the background, a non-reflectant surface painted with black mate was used.
The algorithms and techniques previously commented where developed with C++ using OpenCV library [22], and C# using Aforge library [23], and they were executed in a desktop computer, with the following features: Pentium IV @ 2.8 Ghz, 1GB RAM memory, and 7200 RPM SATA Hard drive.
6.1 Experimental estimation of average densityTo estimate the parameter related to the fruits density, an independent additional sampling was performed in 100 fruits, randomly selected from a farm.
6.2 Estimation of weight
For the 142 mangoes, their weight was estimated by means of the proposed method, using the average density which was found. Figure 6 shows the behavior of real weight and the estimated weight for 42 randomly selected fruits. The generated error in the weight, using previously found density is 11.16g, which indicates that the estimated weight can be ±11.16g from the real weight.
6.3 Estimation of mango caliber by means of the proposed method
Once that approximated weight for 142 mangoes was obtained by means of their image analysis, its caliber was estimated by means of caliber table of NTC-5139. Figure 7 shows the behavior of estimated caliber in relation with real caliber for the first 42 mangoes of the sampling of 142 mangoes.
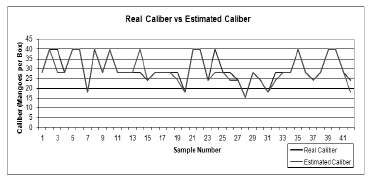
Figure 7. Real caliber vs Estimated caliber
The effectiveness percentage in the calculation of sugar mango caliber calculation by means of estimated weight was 83.3%.
6.4 Experimental Estimation Of Model Histograms
To estimate model histograms required for automatic classification of mango's color, a sampling was performed on 40 mangoes by an expert. Once those images were obtained for every mango, H and S average histograms of every color classification were found.
6.5 Color estimation of the mango by means of the proposed method
Once that model histograms were found for the 5 classifications of the norm through the latter sampling of 40 mangoes, the color was evaluated for the sampling of 142 mangoes by means of the mean square error method in histograms. In Figure 8, the color classification performed by the expert can be observed, and the color classification performed by means of square error method in histograms. For the sampling of 142 mangoes, the automatic classification method generated an accurateness percentage of 99.29%.
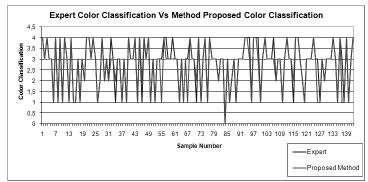
Figure 8. Automatic vs Manual Expert Color-Classification Method
The estimation of process times was performed since the image entered at the pre-processing stage, until the values of mango's caliber and color classification were estimated.
The average time generated for the developed algorithms was 2.1 seconds. This time varies notoriously according to captured image resolution, which can be reduced according to the quality of the camera in use.
7. CONCLUSIONS
The method proposed in this work for weight estimation of sugar mango (Mangifera Indica L.) using computer vision techniques presents, according to the performed tests, a good approximation for measurement of this property (weight), and therefore the volume. Its main feature is that it is completely automatic and because of the higher computational load associated to the equation system resolution which forms the co-variance matrix, this method results computationally efficient.
The assembly required for implementing a system based in the proposed method is simple and cheap, because a personal computer and a standard color camera can be used for it. In addition to this, it is possible to extend this study to other fruits with similar density as orange and watermelon is shown.
The generated error is near to 11g average. However it is possible to reduce this error, by increasing the size of estimation samples. Equally, the roundness of the fruit improves the ellipsoidal approximation, so, it would be convenient to study a penalty factor on the weight according to the fruit roundness level. An additional aspect which was not addressed in this work is the study of the effect of the maturity level in relation to the density estimation. If it were possible to establish this relationship, an extension based in the study of color which indicates the maturity level, would help to augment the precision of estimation.
REFERENCES
[1] ICONTEC, Colombian technical Standard NTC 5139, Frutas frescas. Mangos criollos. Especificaciones, ICONTEC, Bogotá D.C, 2002. [ Links ]
[2] Domenico, S., AND Gary , W. Machine vision and neural nets in food processing and packagingnatural way combinations. In Food processing automation IIIProceedings of the FPAC conference (pp. 11). Orlando , Fl: ASAE., 1994. [ Links ]
[3] Abdullah, M. Z., Guan, L. C., Lim, K. C., AND Karim, A. A. The applications of computer vision system and tomographic radar imaging for assessing physical properties of food, Journal of Food Engineering, 125–135, 2004. [ Links ]
[4] Mitchell, R. S., Sherlock, R. A., and Smith, L. A. An Investigation Into The Use Of Machine Learning For Determining Oestrus In Cows, Computers and Electronics in Agriculture, 15, 95–213, 1996. [ Links ]
[5] Michie, D. Methodologies from machine learning in data analysis and software, The Computer Journal, 34, 559–565, 1991. [ Links ]
[6] Vizhányá , T., AND Felfoldi, J. Enhancing colour differences in images of diseased mushrooms, Computers and Electronics in Agriculture, 26, 187–198, 2000. [ Links ]
[7] Bato, P.M., Nagata, M., Cao, Q.X., Hiyoshi, K., and Kitahara, T. Study on sorting system for strawberry using machine vision (part 2): development of sorting system with direction and judgement functions for trawberry (Akihime variety), Journal of the Japanese Society of Agricultural Machinery, 62, 101-110, 2000. [ Links ]
[8] Paulus, I. and Schrevens, E. Shape characterisation of new apple cultivars by Fourier expansion of digital images, Journal of Agricultural Engineering Research, 72, 113-118, 1999. [ Links ]
[9] Shearer, S. A. and Payne, F. A. Color and defect sorting of bell peppers using machine vision, Transactions of the ASAE, 33, 2045–2050, 1990. [ Links ]
[10] Morrow, C.T., Heinemann, P.H., Sommer, H.J., Tao, Y. and Varghese, Z. Automate inspection of potatoes, apples, and mushrooms, Proceedings of the International Advanced Robotics Programme, Avignon, 179-188,1990. [ Links ]
[11] Batchelor, M.M. and Searcy, S.W. Computer vision determination of stem/root joint on processing carrots, Journal of Agricultural Engineering Research, 43, 259-269, 1989. [ Links ]
[12] Howarth, M.S. and Searcy, S.W. Inspection of fresh carrots by machine vision, Food Processing Automation II, ASAE , USA , 1992. [ Links ]
[13] Tollner, E.W., Shahin, M.A., Maw, B.W., Gilaitis, R.D. and Summer, D.R. Classification of onions based on internal defects using imaging processing and natural network techniques, ASAE International Meeting, Toronto, Onteroi, Paper no. 993165, ASAF, 2950 Niles Road, St. Joseph, MI 49085-9659, USA, 1999. [ Links ]
[14] Tadhg B. and Da-Wen, S. Inspection and grading of agricultural and food products by computer vision systems--a review, Computers and Electronics in Agriculture, 36, 193-213, 2002. [ Links ]
[15] PAJARES G. Visión por computador: imágenes digitales y aplicaciones, ALFAOMEGA Grupo Editor, 2002. [ Links ]
[16] Sun, D.W. and Du, C. J. Segmentation of complex food images by stick growing and merging algorithm, Journal of Food Engineering, 61, 17–26, 2004. [ Links ]
[17] DU, C. AND SUN, D. Learning techniques used in computer vision for food quality evaluation: a review, Journal of Food Engineering 72, 39-55, 2006. [ Links ]
[18] Vasquez-Caicedo, A.L., Neidhart, S. and et al. Physical, Chemical, and Sensory Properties of Nine Thai Mango Cultivars and Evaluation of their Technological and Nutritional Potential, International Symposium: Sustaining Food Security and Managing Natural Resources in Southeast Asia Challenges for the 21st Century, 8-11, 2002. [ Links ]
[19] Yimyam, P, Chalidabhongse, T, Sirisomboon, P. and Boonmung. S. Physical properties analysis of mango using computer vision, Proceeding of ICCAS, 2005. [ Links ]
[20] DUDA, R. Pattern Classification Second Edition, Wiley-Interscience, 2000. [ Links ]
[21] GUZMÁN C., Alcalde, S., Mosqueda R. and Martínez, A. Ecuación para estimar el volumen y dinámica de crecimiento del fruto de mango cv. Manila, Revista Agronomía Tropical, 46, 395-412, 1996. [ Links ]
[22] Source Forge, Open Computer Vision Library, Available: http://sourceforge.net/projects/opencvlibrary/, 2009 [cited October 2th of 2009] . [ Links ]
[23] Aforge.Net, C# Computer Vision Framework, Available: http://www.aforgenet.com/framework/ , 2009 [cited October 2th of 2009] . [ Links ]


