


Services on Demand
Journal
Article
 English (pdf)
 Article in xml format
 Article references
 Send this article by e-mail
Indicators
-
 Cited by SciELO
 -
 Access statistics
Related links
-
 Cited by Google
 -
 Similars in
SciELO
Similars in
SciELO -
 Similars in Google
Share

 Permalink
DYNA
Print version ISSN 0012-7353On-line version ISSN 2346-2183
Dyna rev.fac.nac.minas vol.77 no.161 Medellín Jan./Mar. 2010
A NEW PRODUCTIVITY INDEX TO MEASURE ECONOMIC SUSTAINABILITY OF THE MINING INDUSTRY
UN NUEVO ÍNDICE DE PRODUCTIVIDAD PARA MEDIR LA SOSTENIBILIDAD ECONÓMICA EN LA MINERÍA
XOSÉ A. RODRÍGUEZ
Profesor en la Universidad de Santiago de Compostela, xoseanton.rodriguez@usc.es
Received for review June 16 th, 2009, accepted December 6 th, 2009, final version December 17 th, 2009
ABSTRACT: This document aims to introduce a total productivity index to measure the economic sustainability of the mining industry. This index will take into account any technical developments, means of use of productive factors (i.e. inefficiencies and scale effects) and the effects on the growth of the geological properties in the resources to be exploited (particularly the effects of resource reduction or reserves depletion). This new index will then be applied to the example of the Spanish mining industry, with some interesting findings regarding the configuration of sustainable mining policies.
KEYWORDS: economic sustainability, productivity index, technological change, reserves depletion.
RESUMEN: En este trabajo se propone un índice de productividad total para medir la sostenibilidad económica en las industrias mineras. En este índice se tiene en cuenta los avances técnicos, el modo de utilización de los factores productivos (ineficiencias y efectos de escala) y los efectos sobre el crecimiento de los cambios en las características geológicas de los recursos a extraer (en particular, los efectos de la reducción de recursos o agotamiento de reservas). Este nuevo índice lo aplicamos al caso de le la minería española, deduciendo de los resultados interesantes conclusiones en cuanto a la configuración de una política minera sostenible.
PALABRAS CLAVE: sostenibilidad económica, índice de productividad, cambio tecnológico, agotamiento de reservas.
1. INTRODUCTION
According to Munasinghe [1], any alternative means of sustainable development needs to adhere to the following three sustainability criterions: economic, environmental and social. The criteria regarding economic sustainability aims to maintain the highest possible rate of economical growth, using the available resources in an optimal manner from the point of view of the market.
This document aims to introduce a total productivity index that measures the economic sustainability of the mining industry. This index will take into account any technical developments, means of use of productive factors (i.e. inefficiencies and scale effects) and
the effects on the growth of the geological properties in the resources to be exploited (particularly the effects of reserves depletion). Therefore, this index will act as a complete indicator to measure the economic sustainability of the mining industry, given that:
- Productivity is an adequate indicator to gauge economical development, and this growth can be limited by the effects of changes in the geological characteristics of resources to be exploited.
- The index takes into account the way in which productive potentialities are employed: for instance, whether there are any scale effects, whether there are inefficiencies, or whether the degree of usage capacity of these factors is appropriate.
- The index allows us to analyze the dynamics between the effects of technical developments (which tend to reduce costs) and the effects of resource depletion (which tend to increase costs). According to Tilton and Lagos [2], such dynamics could determine the future availability of mining resources.
- In addition to this, this index offers an estimate of technological developments, which allows us to anticipate whether the conditions are optimal for the replacement of natural capital with artificial capital. Indeed, according to Romer [3], only new technologies can enable such a replacement and generate extraction processes that contribute to saving natural resources. If such a replacement takes place, it is then also possible to fulfil the criteria of social sustainability (inter-generational equity) from a perspective of weak sustainability [4].
This work is divided into three main sections. Section 2 describes the methodological development in the elaboration of the index of decomposition of productivity growth, and section 3 applies the aforementioned index to the example of the Spanish mining industry. The document then concludes with the most relevant conclusions.
2. INDEX ELABORATION
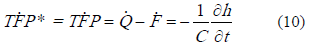
The starting point is the traditional Divia index of Total Factor Productivity (TFP). Solow [5] proves that under constant returns to scale in a long run competitive equilibrium the index ( ) can be interpreted as a measure of technical change. In the index
  , (
, ( ) is a index of aggregate output and can be written as:
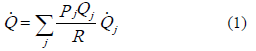
where, Qj is the quantity of the j-th output, Pj is the price of the j-th output,  is total revenue and
  the growth rate of the j-th output.. Likewise, (
 ) is a index of aggregate input and can be written as:
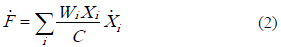
where, Xi is the quantity of the i-th input, Wi is the price of the i-th input,  is total cost and
  is the growth rate of the i-th input.
This index , referred to in the literature as the Solow residual [6,7], measures the changes in the output aggregate not explained by changes in the input aggregate.
The starting point is a primal representation of technology such as  or alternatively their dual cost function
  . Under constant returns to scale in a competitive equilibrium in the product and factor markets, it can be shown that:,
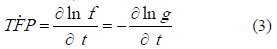
where, the Xi’s are input, t denotes technology , Q output, C is total cost and the Wi’s are input prices.
The result in (3) shows that the Solow Residual can be interpreted as a shift of the production function, not attributable to changes in inputs but to technical change or can also be interpreted as well as a shift of the cost function, not attributable to changes in input prices or output quantity but to technical change.
The use of the Solow Residual as a measure of technical change relies on a number of simplifying assumptions. If these assumptions do not hold, the residual has to be corrected accordingly. The effects of non-constant returns to scale and the violation of the various conditions of a long run competitive equilibrium have been analyzed empirically [8-11].
In this paper we derive a multi-decomposition of the Total Factor Productivity (TFP) index that explicitly takes into account the distinguishing productive characteristics of mining industries. Our alternative decomposition simultaneously introduces the possible effects on productivity growth of non constant returns to scale, mark-up pricing, inefficiencies and sub-equilibrium due to quasi-fixed factors, and the influence of geological factors.
A measure of productivity in mining industries starts with the production function:
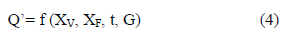
where Q’=( Q1,...,Qm) is a vector of m outputs obtained with r variable inputs, XV=(X1,…,Xr); n-r quasi-fixed inputs, XF=(Xr+1,…,Xn); the technology (t); and a set of s geological characteristics (such as level of reserves, quality of deposits…) of the natural resource denoted by G=(G1…Gs).
Under certain regularity conditions of the production function [12] and under the assumption of cost-minimizing behaviour, there is a dual variable cost function that contains all relevant information about the technology and which can be represented as:
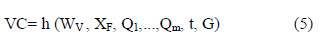
where VC denotes variable cost and WV=(W1,…,Wr) is a vector of prices of the variable inputs (XV). The total cost function can be written as:
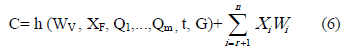
where Wi is the price of the j-th quasi-fixed input.
Next, we extend previous results [8-11] to take into account the productive characteristics of mining industries.
Using the index and totally differentiating the function (6) with respect to time and rearranging, we obtain:
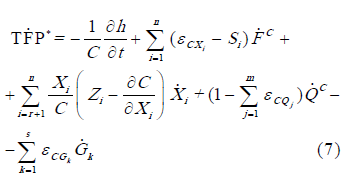
where  is the corrected index of Total Factor Productivity growth,
  is the elasticity of cost with respect to input i,
  is the cost shares of input i,
  denotes aggregate input growth using cost elasticities, rather that cost shares, as weights,
  is the shadow value of quasi-fixed input i,
  is the marginal cost of quasi-fixed input i,
  is the rate of change of quasi-fixed input i,
  is the elasticity of cost with respect to output j,
  is the index of aggregate output, but using cost elasticities, rather than revenue shares, as weights,
  is the elasticity of cost with respect to geological characteristic k (for example, level of reserves) and
  is the rate of change of geological characteristic k.
Following De la Fuente [13] the global cost elasticity ( ) can be written in terms of Capacity of Utilization (CU) and returns to scale (RS) and which can be represented as:
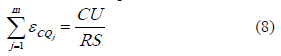
Therefore, substituting (8) into equation (7) the corrected index can be written as:
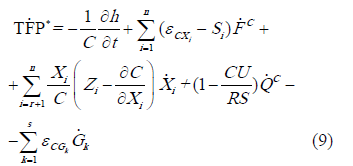
Equation (9) provides a decomposition of the corrected index of Total Factor Productivity growth ( ) into five components. The first component (
 ) is commonly interpreted as a measure of technical change. The second component (
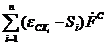 ) can be interpreted as a measure of allocative inefficiency: it measures the effects of non-optimal allocation of factors on TFP. If the industry is allocatively efficient, then
  , and this term is equal to zero. The third component (
 ) measures the effects on Total Factor Productivity of sub-equilibrium due to quasi-fixed factors. This term vanishes in a competitive equilibrium when the shadow value of the fixed factors (
 ) is equal to its marginal cost (
 ). The fourth component
  measures the effects of changes in the scale of production on Total Factor Productivity. Firms might find it difficult to change some inputs and, as result, they do not necessarily operate at the optimum level of capacity utilization. This term vanishes when there are constant returns to scale (RS=1) and the capacity is fully utilized (CU=1). The last term (
 ) measures the effects of changes in geological characteristics on Total Factor Productivity. This term vanishes only if the geological characteristics do not change.
If the geological characteristics do not change, under constant returns to scale and at a competitive equilibrium in the product and factor markets, it can be easily shown that:
3. APLICATION TO THE SPANISH MINING INDUSTRY
In this section, the corrected measure of TFP (described in expression 9) is applied to Spanish mining during the period 1974-2004. The starting point is the following production function:
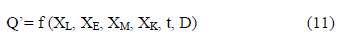
where Q’≡( Qe, Qm, Qn, Qq ) is a vector of outputs –energy mining output (Qe), metal mining output (Qm), non-metal mining output (Qn) and quarry mining output (Qq)– obtained with three variable inputs: employment (XL), energy (XE) and materials (XM); a quasi-fixed input, capital (XK); the technology (t); and the depletion of mineral reserves denoted by D (the geological characteristic is the level of reserves).
The dual variable cost function of (11) can be represented as:
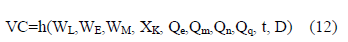
where VC denotes variable cost and WL, WE and WM are the input prices of labour, energy and materials. The total cost function can be written as:
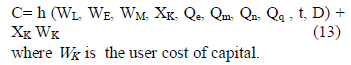
where WK is the user cost of capital.
Therefore, differentiating with respect to time the function (13) and rearranging, we obtain a decomposition of the corrected index similar to (9):
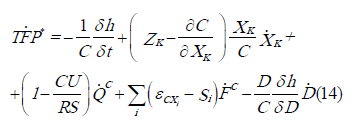
where  is the shadow value of Capital,
  is the rate of change of Capital,
  is the rate of change of mineral reserves and
  measures the effects of reserves depletion on Total Factor Productivity.
The estimation of (14) requires the estimation of a Variable Cost Function in which the mineral reserves depletion is included as an explanatory variable. A central issue of this empirical analysis is the definition of a variable that measures the quantity of mineral depletion available for extraction at each period of time. To the best of our knowledge, there is no annual estimation of mineral reserves in Spain .
However, we have data on the quantities of mineral extracted from 1974 to 2004. For this reason, we estimate a proxy variable of mineral reserves depletion in year t (Dt) using data on mineral extracted as:
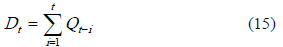
where (Q1, … , Qt-1) are the aggregated quantities of mineral extracted in previous periods of time. The basic simplifying assumption contained in expression (15) is that minerals extraction is the main force in the evolution of reserves depletion while new discoveries are not very relevant. This assumption is not unrealistic in the case of Spanish mining (in fact, the number of active mines went from 4443 in 1974 to 4226 in 2004).
We estimate a variable cost function using data on minerals production, input prices and quantities reported in Mining Statistics (Estadística Minera) an annual publication of the Spanish Ministry of Economy [14]. The dataset contains data of mining industries operation in Spain aggregated by the four big industries (energy mining, metal mining, non-metal mining and quarry mining) from 1974 to 2004. The mining industries include government and privately-owned firms carrying out both surface and underground mining. Some descriptive statistics of the variables used for the estimation are shown in Table 1.
Table 1. Descriptive statistics (1974-2004)
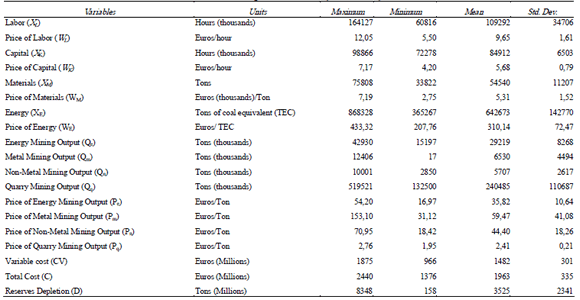
Some clarifications on the construction of the variables are needed. Firstly, the hours of Labor (XL) are weighted by the cost share of each labor qualification. The tons of Materials (XM) are weighted by the cost share of each type of material. Capital is measured as hours of machinery use. In this case, the hours are weighted by the power of each type of machinery. The user cost of Capital (WK) is defined as:
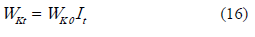
where WK0 is the user cost of Capital in the base year reported in Gómez [15] and It is an
Index of price of machinery. Finally, output is measured in Tons of mineral extracted. The output of each big industry is weighted by the values of the different minerals included in the industry. Similarly, the aggregated quantities of mineral extracted used in estimation of Reserves Depletion (D) are weighted by the value of the different minerals
The Translog functional form has been used in the estimation. This is a flexible function form used previously by Brown and Christensen [16] and Berndt and Hesse [17]. The variable cost function can be written as:
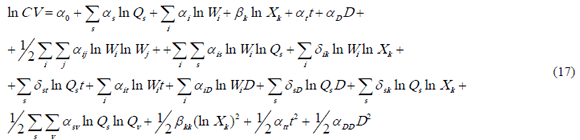
where i,j refer to the three variable inputs, Labor (L), Energy (E) and Materials (M); s,v refer to the four outputs, energy mining (e), metal mining (m), non-metal mining (n) and quarry mining (q) while D is the measure of reserves depletion in expression (15). All variables in the translog cost function are in natural logarithms with the exception of the time trend (t) and the measure of reserves depletion (D).
In addition to the variable cost function we estimate the input equations for the variable factors and the price equations. Using Shephard’s lemma in equation (17) we have that:
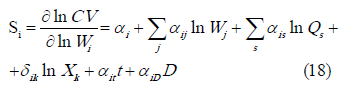
where  , and Si denotes the variable cost share of input i.
The price equations are derived using expression 17. Under imperfect competition, which typifies
the mining industries, market power leads firms to set prices above (or under) marginal costs:
(19)where  , and
, and  denotes the markups on marginal costs.
However, price markups over marginal costs are not directly observable. Various approaches to their indirect estimation are suggested in the literature. For example, Dobringsky et al. [18] propose a direct relationship between the markup and the returns to scale index as:
(20)
where  is the industry’s average profit margin and
  is a returns to scale index of the s-th industry. Substituting equation (20) into equation (19), the index
  can be estimated as an additional parameter of the s-th industry production technology.
The system of equations (17), (18) and (19) is estimated after imposing parametric restrictions of symmetry and homogeneity of degree one on input prices. The share equation of materials is dropped to avoid singularity of the system. Prices and Variable Cost have been divided by the price of Materials to impose homogeneity of degree one on input prices of the cost function. The resulting system of equations is estimated by Iterative Three-Stage Least Squares (I3SLS).
I3SLS is an appropriate technique when right-hand side variables are endogenous. We use this method since the possible endogenously of the outputs. As instruments of outputs we use their lagged values. Furthermore, we adjust the ISURE estimates to account for serial correlation by adding AR(1) terms to the price equations.
The estimation produced a number of coefficients not significantly different from zero. Moreover, we could not reject the null hypothesis that the non significant coefficients were jointly different from zero. Therefore, in order to deal with what looks like a multicollinearity problem, we decided to re-estimate the cost function without the terms whose coefficients were jointly non significant. The final results of the estimation are show in Table 2.
Table 2: Restricted Translog Variable Cost Function
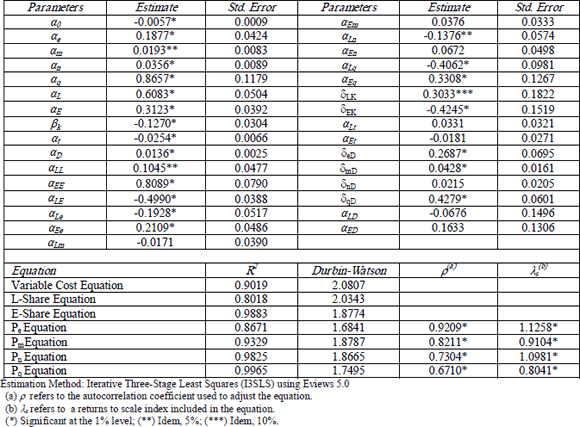
The findings suggest that the model is robust. The R-squared of the estimated equations indicated good explanatory power. The values of the Durbin-Watson test indicated that autocorrelation is corrected. The coefficients have the expected signs and are significantly different from zero at conventional levels of significance.
The decomposition of the corrected TFP growth rate following equation (14) is shown in Table 3. The five components of in equation (14) are shown in the first five columns of Table 3 while the estimated value of appears in the sixth column. The result´s that TFP grew at an average annual rate of 1.75%, although there was a great deal of variation across years (for example, TFP growth has been negative in some years). The Technical Change (column 1) was a main source of TFP growth gains (this component grew at an average annual rate of 2.49%). The other four components had jointly a negative contribution to TFP growth (-0.74%), although the particular effect of each component was different. The component that measures the subequilibrium due to quasi-fixed capital factor present a average value positive but quite small (0.09%). This value is positive since the shadow value of capital is generally larger than its marginal cost ( ). The average value of the scale effect is positive but also small (0.66%). The small average value is driven by the existence of positive values that are partially balanced by negative values. In most years of the sample the elasticity of scale (RS) is larger than the index of Capacity Utilization (CU), with average values of 0.96 and 0.79 respectively. The average value of the effect of non-optimal allocation of factors is negative (-0.71%). This result is driven mainly by the existence of negative values that are partially balanced by positive values.
Table 3: Total Factor Productivity growth and its components
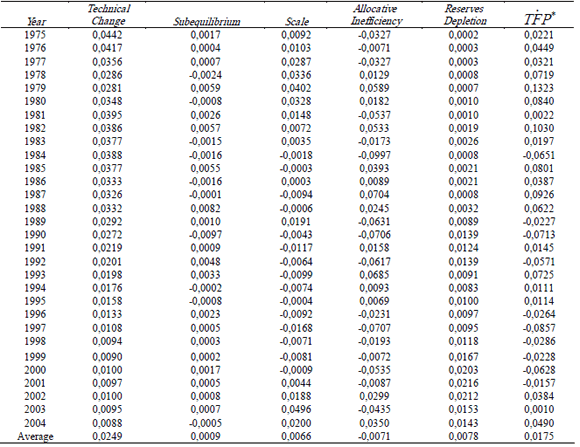
Finally, the average value of the component that measures the effect of the reserves depletion has a negative contribution to the average TFP growth (-0.78%), which might indicate that the reserves depletion are likely to increase the cost of extraction.
4. CONCLUSIONS
To take into account the productive characteristics of mining industries we present a decomposition of the corrected TFP growth into five components: technical change, subequilibrium, scale, allocative inefficiency and resource depletion. This index can be used as an indicator of economic sustainability for mining, and its application to the example of Spain ’s mining industry has brought us to the following conclusions:
- The economic growth of the sector for the suggested period (in terms of productivity) has proved to be moderate (an average per annum growth rate of 1.75%). This growth was partly undermined (by about 0.78%) by the effect caused by reduction in reserves (this is known as the “depletion effect”).
- The use of production potential has not proved to be optimal, given that scale economics have not been used to their full advantage, production capacity has been under-used, and production factors have not been efficiently assigned.
- The component of technological change has shown the best behaviour, anticipating that it is possible to generate a process of replacement of natural capital with artificial capital in the Spanish mining industry. Should this process take place, it would help lay out some good groundwork to improve the criteria of inter-generational equity, a hitherto hard-to-achieve goal in this type of industry.
- In addition to this, the effects of technological change on this growth have amply compensated for the effects of reserves depletion on said growth, which is akin to what occurs with other minerals [2].
Because of these results, and with view to establishing some policies to maintain sustainability in Spain ’s mining industry, we suggest the following:
- To improve knowledge of mineral reserves, in order to more accurately measure the effects of its reduction in economic growth and to enable some planning to optimize its use.
- To continue favouring technological progress, as this is a safe way to guaranteeing the growth of artificial capital (given the evident reduction in natural capital) and to compensate for the possible effects of resource reduction (and in this way guarantee their better availability in the future).
- To improve the human capital that intervenes in the management and production processes within the mining industry. This seems like the safest alternative to enable its efficient management and, by default, an optimal use of its productive capabilities.
REFERENCES
[1] Munasinghe, M. Environmental Economics and Sustainable Development. Environmental, Paper nº 3. World Bank. Washington DC, 1993. [ Links ]
[2] TILTON, J. E. AND LAGOS, G. Assessing the long-run availability of copper, Resources Policy, 32, 19-23, 2007. [ Links ]
[3] ROMER, P. M. Increasing Returns and Long-Run Growth, Journal of Political Economy, 94, 1986. [ Links ]
[4] Pearce, D.W. AND Atkinson, G. D. Capital theory and the measurement of sustainable development: an indicator of weak sustainability, Ecological Economics, 8 (2), 103-108, 1993. [ Links ]
[5] SOLOW, R.M. Technical Change and the Aggregate Production Function, The Review of Economics and Statistics, 39 (3), 312-320, 1957. [ Links ]
[6] Hartley, J. Does the Solow Residual Actually Measure Changes in Technology, Review of Political Economy, 12, 27-44, 2000. [ Links ]
[7] RAA, T. AND Mohnen, P. Neoclassical Growth Accounting and Frontier Analysis: A Synthesis, Journal of Productivity Analysis, 18, 111-128, 2002. [ Links ]
[8] Denny, M., Fuss, M. AND Waverman, L. The Measurement and Interpretation of Total Factor Productivity in Regulated Industries, with an Application to Canadian Telecommunications. In Productivity Measurement in Regulated Industries, T. G. Cowing and R.E. Stevenson (Eds), New York: Academy Press, (1981). [ Links ]
[9] Bauer, P. Decomposing TFP Growth in the Presence of Cost Inefficiency, Nonconstant Returns to Scale, and Tecchnological Progress, The Journal of Productivity Analysis, 1, 287-299, 1990. [ Links ]
[10] Morrison, C. Unraveling the Productivity Growth Slowdown in the United States , Canada and Japan : the Effects of Subequilibrium, Scale Economies and Markups, The Review of Economics and Statistics, LXXIV ( 3), 381-393, 1992. [ Links ]
[11] Boscá, J. E., Escribá, J. AND Murgui, M. J. Total Factor Productivity Growth in Spanish Regions: Effects of Quasi-fixed and External Factors and Varying Capacity Utilization, Regional Studies, 38 (6), 587-601, 2004. [ Links ]
[12] Lau, L. J. A characterization of the normalized restrictive profit functions, Journal of Economics Theory, 8, 131-163, 1976. [ Links ]
[13] De La Fuente, A. On the determinants of cost performance and the decomposition of returns to scale measures in the presence of quasi-fixed inputs. A comment on Morrison and Schwart (1996) and related work. UAB-IAE WP 445.00, (1999). [ Links ]
[14] Ministerio de Economía: Estadística Minera de España, 1974-2004. Ministerio de Economía. Madrid. [ Links ]
[15] Gómez, J. Cambio técnico en la economía española. Un análisis desagregado para el periodo 1964-1981, Unpublished Doctoral Thesis. Universidad Complutense de Madrid, 1987. [ Links ]
[16] Brown, R.S. AND Christensen, L.R. Estimating Elasticities of Substitution in a Model of Partial Static Equilibrium: An application to U. S. Agriculture 1947 to 1974, Modeling and Measuring Natural Resource Substitution. Cambrige, Massachusetts: M.I.T. Press. E.R. Berndt and B. C. Fields [ed.] , 1981. [ Links ]
[17] Berndt, E. R. AND Hesse, D. Measuring and Assessing Capacity Utilization in the Manufacturing Sector of Nine OECD Countries, European Economic Review, 30 (5), 1986. [ Links ]
[18] Dobrinsky, R., Kórösi, G., Markov, N. AND Halpern, L. Price markups and returns to scale in imperfect markets: Bulgaria and Hungary, Journal of Comparative Economics, 34, 92-110, 2006. [ Links ]

