Servicios Personalizados
Revista
Articulo
Indicadores
-
 Citado por SciELO
 -
 Accesos
Links relacionados
-
 Citado por Google
 -
 Similares en
SciELO
 -
 Similares en Google
Compartir
DYNA
versión impresa ISSN 0012-7353versión On-line ISSN 2346-2183
Dyna rev.fac.nac.minas v.77 n.163 Medellín jul./sep. 2010
COMMODITIES DISTRIBUTION USING ALTERNATIVE TYPES OF TRANSPORT. A STUDY IN THE COLOMBIAN BREAD SME`S
DISTRIBUCIÓN DE COMMODITIES, USANDO MEDIOS ALTERNATIVOS DE TRANSPORTE. CASO COLOMBIA PYMES PANIFICADORAS
MARTÍN DARIO ARANGO SERNA
Escuela de Ingeniería de la Organización. Facultad de Minas. Universidad Nacional, mdarango@unalmed.edu.co
WILSON ADARME JAIMES
Facultad de Ingeniería, Universidad Nacional de Colombia, Sede Bogotá. wiadarme@unal.edu.co
JULIAN ANDRES ZAPATA CORTES
Facultad de Ingeniería, Universidad Nacional de Colombia, Sede Bogotá. wiadarme@unal.edu.co
Received for review February 1th, 2010, accepted May 13th, 2010, final version June, 12th, 2010
ABSTRACT: This paper describes an algorithm for solving the micro-routing problem when it is used modes like bicycle and motorcycle with different capacities and serving different routes which are associated to a set of customers and also considering time windows restrictions. From the research in the Palmira bread industry, in which the bakeries were geo-referenced and in which the warehouse and the transport of goods management systems were characterized, was possible to establish the set of parameters needed for the numerical routing algorithm that seeks serving the daily customer requirements. The numerical results show the importance and how incident can be this methodology for SME´s which do not have a formal structure, resources neither appropriated information systems to compete in the actual market.
KEYWORDS: Vehicle routing, bicycle, time windows restriction, perishable goods.
RESUMEN: Este artículo describe un algoritmo para resolver el problema de micro ruteo cuando se dispone de medios como la Bicicleta y la motocicleta, con diferentes capacidades que cubren distintas rutas asociadas al conjunto de clientes con restricciones de tiempo. A partir de la investigación en el sector panificador de Palmira, donde se geo-referenciaron las panaderías y se caracterizaron los sistemas de gestión de inventarios y transporte de insumos, se establecieron los parámetros necesarios para los ejemplos numéricos del algoritmo de ruteo que busca atender las necesidades diarias de los demandantes. Los resultados numéricos muestran la importancia e incidencia que tendría esta metodología en microempresas que no disponen de organización, recursos ni de sistemas de información apropiados para competir en los escenarios actuales.
PALABRAS CLAVE: Ruteo de vehículos, bicicletas, ventanas de tiempo, producto perecedero.
1. INTRODUCTION
The vehicle routing problem (VRP) has gained high attention both in academic research as in practice. VRP has been studied from several scopes and in this paper it is focused in the bicycles and motorcycles routing problem (BMRP) using daily planning for the bread industry in Palmira, Valle del Cauca, Colombia; integrated by costumers with higher demands than their stock capabilities as can be study in [1]. The results reported have considered a variation of the vehicle routing problem with time windows (VRPTM), where the same vehicle can serve several routs in an working day.[2] Besides, types of transportation as bicycle and motorcycle have not been deeply studied in applied works to delivered express of perishable goods. This problem will be really important in the near future due to the technology advance and the change in the customer customs.
There are different studies about VRP without time windows [3] using heuristics in their solution, as well as several with time windows using exact models as the solving tool [2], what illustrates the advance in this subject. Studies as the one presented in [4] show heuristics of insertion that can handle different types of restrictions, including time windows and multiple vehicles. In [5] the authors present delivered Express problem, which is really similar to the one faced in this work.. Others studies [6] consider logistics and socio-economical issues about several types of the delivery express problem.
The present article rooted by the studies made in [2], shows an exact algorithm for solving the VRP with different vehicle capacities, time windows and multiple routes. In the second part of the article it is presented the mathematical model formulation. In the third part it is shown the characterization and the parameterization of the bread sub-industry. Later it is presented the results of a numerical example using the Clarke and Wright heuristic dealing with the number of nodes that is included in the evaluation and finally it is presented the conclusions and further works in this field.
2. PROBLEM FORMULATION
Due to the difficulties presented on the bread industry, related to the quality level and to the asepsis of the raw material and finish goods, it have been detected through several studies, that the central main causes are related to the way of care, handle, storage and transport those elements. One of the biggest concerning about those problems is how to fulfill all the customers' requirements but following a continue supply politic, without affecting the quality and service, and taking into account ways of transport as bicycle, motorcycle and moto-trailer.
The problem description is:
There are a number of V vehicles V = {1, 2, ….l}, each of those have a deliver capacity from the depot to a set of customer equal to Ql, and the set of customers are N = {1, 2, ….n}. There have been geo-referenced all the n customers through GPS, which allows to determined the distance dij, for a set of arcs of motion called A. the mobility study allowed determining the speed and travel times tij associated to each arc (i,j) Є A. Every customer i Є N, has a daily demand qi, a service time si and a time windows [ai, bi], where the time to start operation in the customer location is denoted as ai and the ending time is bi. It is assumed that a vehicle is able to wait if this arrives to a customer facility i in a time earlier than ai. Every vehicle can make K daily routes, K= {1, 2, ….k}, where each route starts and ends on the depot. The depot is denoted as 0 or n +1 depending if this is the initial node or the ending ode of a arc with so = s n+ 1 = 0. qo = q n+ 1 = 0. ao = a n+ 1 = 0. bo = b n+ 1 = ∞.
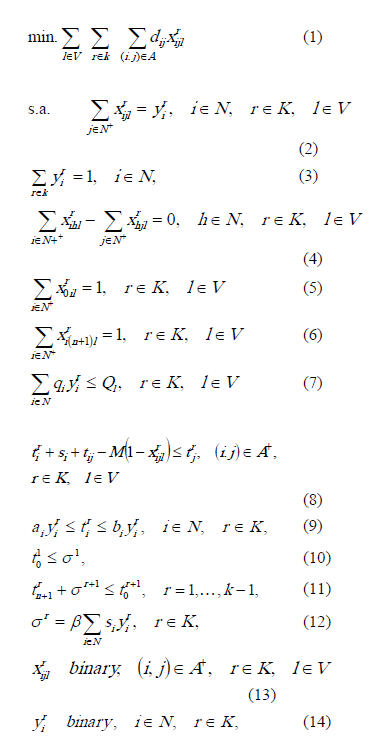
The symbol N+ is used to N Ụ {0, n+1} and A+ Ụ {0, n+1}, where {0, n+1} is a fictitious arc with a distance d0,n+1 = 0 and a travel time of t0,n+1 =0. The starting time σr for load a vehicle is associated which each route r Є K. The goal of the model is to minimize the total distance to serve all the customers, while satisfying the capacity, time windows and limited deliver constrains. The problem is formulated as following, using M as a big arbitrary constant.
Where:
- xrijl will be 1 if the arc (i, j) Є A+ i is on the route r with the vehicle l. Otherwise xrijl will be 0; Note that xr0,n+1 equals 1 if the route r is empty.
- yri will be 1 if the customer i is on the route r, otherwise it will be 0;
- tri is the service starting time related to the customer i in the route r;
- tr0 is the routing starting time for the route r;
- tr n+ 1 is the routing ending time for the route r.
In the same way, the model formulation can be explained as following:
- Equation (2) seeks that all customers are part of an arc.
- Equation (3) makes possible that each i can be visited only one time.
- Equations (4) - (6) are for the flow conservation.
- Equation (7) guaranties that demand in a route r will no exceed the capacity of vehicle I.
- Equations (8) -(11) assure the time programming feasibility.
- Equation (12) defines the load starting point of the vehicle I, as the sum of the service times to all the customers in the same route multiplied by a parameter b
- Equation (9) assures that tri equals 0 when the customer i is not in the route r.
3.CHARACTERIZATION PARAMETERIZATION OF THE BREAD SUB-INDUSTRY 3.1 Metodology
This research rooted in 2002 with a exploration of the SME's of the bread sub-industry in the urban area of the city of Palmira, which is city with more or les 294.000 citizens. Accordint to the 2006 report of the Camara de Comercio, in this city are 202 bakeries (but only 76 accepted cooperating with the research Taking into account the resources availability, logistics and convenience, there were characterized 35 bakeries as: 3 are considered big size companies, 12 medium and 20 are small size companies. See table 1.
Table 1. Palmira Bread sub-industry characterization, 2007

The study was developed through the cooperation of company businessman, workers and researches, using tools as meetings, surveys, semi-structured interviews and observations of the system participants. Characterization variables were order frequency, order size, working time, available slots and mode of transport used. The information was analyzed by the tool SPSS V. 10.0 and ExcelTM; the routing programming was made using Logware.
3.2 Characterization and parametersOperative/Productive Sub-system.
In small bakeries (SB) the most common area is 60-80 m2 (40%), in medium bakeries (MB) the most common area is 120-160 m2 (60%) and in the big bakeries the most common area is 150-200 m2 (60%). 40% of SB have areas until 120 m2, but still present problems related to the space for production, due to this space is common used for both living and operate the bakery.
Around the 80% of Palmira Bakeries are open from 5:00 a.m.to 12:00 pm. Salespeople work from 6:00 am to 10:00 pm divided in two shifts, the first one from 6:00 a.m. to 2:00 p.m and the second one from 2:00 p.m. to 10:00 p.m. Administrative people work from 8:00 a.m. to 12:00 pm and from 2:00 p.m. to 6:00. Those working times apply to big bakeries; in medium and small bakeries there is not a strong distinction between those roles and it is common that the manager is in charge of production, sales, cleaning, and this person works from the opening and the closing of the store, e.g. from 6:00 am to 10:00 pm.
Small Bakeries have between 11 to 15 machines, 80% of medium bakeries have between 16 to 20 machines and all the big bakeries have between 16 to 20 machines, which are flexible regarding to the volume and variability of products. Preventive Maintenance is used in big bakeries and reactive maintenance is used in Medium and small bakeries; the more common equipments are ovens, rotative oven, wetting machines, cylinders and mixers.
Supply goods demand
A research made for the 76 evaluated bakeries valued that in 2007 the consumption of flour is 1.490 tons, sugar 352 tons, cheese 293 tons salt 63 tons, yeast 196 tons and butter 401 tons. Annual aggregate consumption of the main goods (flour, sugar, cheese, salt, yeast and butter) differentiated by size of the bakery is: 102 tons/year for big bakeries, 40 tons/year for medium bakeries, 20 tons/year for small bakeries. The average labor resource occupancy for big, medium and small bakeries are 21, 6 and 3; the studied bakeries generated 496 directed jobs in 2007.
Routing design and tecnical characteristics of the transportations modes
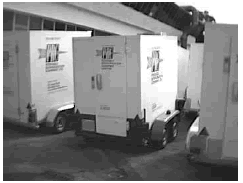
Moto-trailer Model Enduro TS 124; cubic Capacity: 125 C.C.; weight in empty: 85 Kg; performance: 85 km/gallon; fuel: normal gasoline. Cargo Capacity: 350 Kg. Figure i shows a view of this moto-trailer. This type of transport is accepted by law for the colombian goverment in the law number 769 of 2002 in the Código Nacional de Tránsito Terrestre, Chapter V, articles 94 y 96. This type of transportations is a good option when there are too much traffic, the investmen is low, technical specifications, easy of drive, fast, performance, capacity, industrial safety, road safety and also conservation and asepsis in transport of supply goods. In a technical evaluation of the volumetric capacity of the trailer (1.24m x 0.80m x 0.72m = 0,714m3); there was found that the constrains are related only to the weight and not to the volume due to the density of the goods (goods (flour, sugar, cheese, salt, yeast and butter)
An in situ evaluation was made in order to evaluate the traffic, vehicular and pedestrian flux, roads characterization and normal distances in routing and also there was found the average speed for this type of transport, which was determined in 7,336 km./hr (2,037 m/s) in downtown area and 27.692 km./hr. (7.692 m/s) in residential neighborhoods.
Non-motorized types of transportation
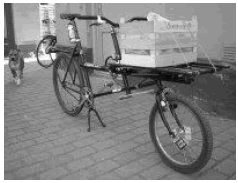
This tipe of transportation is allowed by the law number 769 of 2002 "Código Nacional de Tránsito Terrestre, Chapter V, article 94";. Distribution centers consider double-rack bicycle as the favorite type of trasport due to its low cost, capacity, fast operation (considering traffic jams), easy-driving, cheap mantenience and operation. Figure 2 shows this type of transport.
For the cheese industry moto-trailers are the preferred type of transportation since this devices allow moving up to 300 Kg. The research presents for reference, discussions and analysis the possibility of implementing the double-rack bicycle in this business but taking into account that the maximum load for this device is 100 Kg, which is 200 kg less than the original one in some cases. The limit time is 5 hour in every labor shift, and considering the flat topographic of Palmira, where a GPS study showed that the lower point in the city is at 993 meters above sea level (MASL) and the highest point is at 1047 MASL.
For those conditions it was made a field evaluation and was determine an average speed for bicycles of 6,746 km/hr. (1,874 m/s) in downtown and 8,235 km/hr (2,287 m/s) in residence areas.
Costs
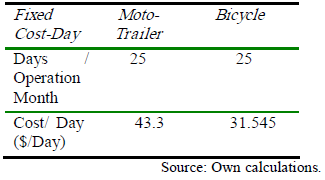
The transportation cost structure for the evaluated types of transport was determined as fixed costs and variable costs for both moto-trailer and bicycle. Daily Fixed cost are shown in Table 2, assuming 25 working days every month.
Unit variable cost (UVC) are those costs that vary depending on the operation conditions and are established in pesos/Kilometer (Pesos is the Colombian currency, COP).
This cost considers the fuel, tires, lubricants, filters, maintenance, repair, unforeseen events and others. Table 2 shows the variable cost per km of every type of transportation.
Table 3. Variable cost per kilometer

4. ROUTING ASSIGNMENT NUMERICAL ROUTING EXAMPLE
4.1 Routing design characterization
The reference point is the cheese company (supplier) and the customers are 35 bakeries (sellers) which were geo-reference through GPS. There were considered the consumption levels, frequency, aggregated demands for main goods( flour, salt, sugar, yeast, butter, cheese) which are consigned In table 4
Table 4. Aggregated Consumption

Based on this information was developed the programming and the vehicle routing design using moto-trailer and bicycle for a load capacity of lower than 100 kg/bicycle.
The programming and route design consider the following considerations:
- Each stop or bakery has a assigned load that must be delivered every day. This quantity is expressed in Kg. (Study results)
- It is possible to use several vehicles with different capacity limits. In this case the limit is the weight that can be carry in each vehicle.
- Bakeries accept deliveries at any time between 8:00 a.m. and 6:00 p.m.
- Although collects are not allowed, in some cases it is possible but only after of the deliveries.
- It is allow a rest time equivalent of an hour after 240 minutes of work.
The model have been run using the Clarke and Wright method with the aim of minimizing the total travel distance fot all the vehicles needed to serve all the stops. Recently this routing programming is made with a frequency of two times per week, what is really different to the six times proposed before this study which were using a FIFO systems (first in, First out) without product consolidation. This method was made using Excel™ for the data analysis and Logware 5.0, ROUTER module for the routing design.
4.2. Results of the Clarke and Wright method application
With the aim of fully apply the Clarke and Wright method, the bakeries and the distribution centers were Geo-reference through GPS seeking to find the geographical and Cartesian (IGAC) coordinates. This information is an input for the software Logware. There were taken 142 points (Cheese company and bakeries), finally in the de-codification and processing activity there were selected 124 points including the cheese company and the 35 bakeries.
The demand level of the time windows in each bakery was determined. This demand levels were acquired by analyzing 76 small Family-companies, 35 of those were selected due that those are cheese company suppliers.
The evaluation has been made by using the types of transport totally independent and through the combinations of these. Results are expressed in the standard software units (Miles as a length measure, to meters). The correction factor used in Logware for the distances was obtained through a field evaluation of the real distances, and it is equal to 1.26, 1.27, 1.29 and 1.3 for some routes, due to the short distances evaluated in this work, and because that the going and returning trip is made through different roads and streets. In the evaluation the correction factor was 1.3. The speed used for the moto-Trailer was established in 8859 meters/hour (weighted average between jammed urban zone 78% and non-jammed area 22%) and for the bicycle it was used a speed of 6745 meters/hour (speed achieved in the jammed urban zone)
5. ROUTING WITH DOUBLE-RACK BICYCLE
Results indicates that there must be 39 routes for all the bakeries that have a daily demand higher that the vehicle (bicycle) capacity which is 100kg, the amount should be divided considering an utilization of 100% of the vehicle capacity and the remaining amount should be used for a new route. For example, the bakery number 30 has a daily demand of 549, so it is equal to 4 demands of 100 kg plus one of 49 Kg, seeking optimizing the vehicle use. This was made with all the bakeries that have a daily demand higher than 100 kg, which causes that of the 35 bakeries the model has 54 stops with a lower demand than 100Kg/day.
Figure 3 shows how the bicycle routing should be to serve all the stops. It is important to notice that some points could not appear due to some points superimpose others as happens in bakeries 22 and 30 in which it is necessary make several trips to the same point. Table 7 is a summary of the main indicators of the process.
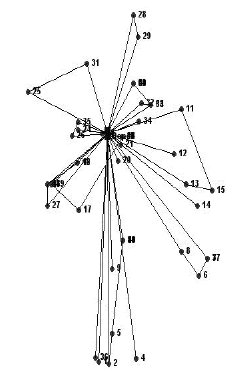
Figure 3: Clarke and Wright method - double-rack Bicycle
The total time of 26.6 hour allows programming the routing with 4 bicycles (8 hours daily) but considering that this is not a motorized transportation type it was made a programming using an average working time of 5 hours daily and with the constrain that each bicycle should not travel more than 10 km (1000m). It means that it is necessary programming 6 double-rack Bicycle, with a initial investment of 4.5 millions of pesos. (6 x 750.000).
With those six bicycles it is necessary 39 routes (Logware Results) which have an average time of 23 minutes an occupancy level of 93.7% of the vehicle capacity.
6. ROUTING WITH MOTO-TRAILER
The result given for the software shows that it should be used 13 routes, this is because it was divided the delivered quantity for bakeries in which the demand is higher tan 300 km, (Bakery 30, 549 kg/day, Bakery 10, 457 kg/day, Bakery 22, 411 kg/day). It was made a run dividing into two equal parts and the results regarding to cost was higher if it is compared to the next method: A big portion of the cargo is shipped in a trailer with a capacity of 300 kg and the remaining quantity is sent in another trailer. This method was use for the design and programming of the route.
Figure 4 shows the Moto-trailer routing for serving the total 35 points. As happened above some points could not appear in the figure due to some points superimpose others as for example bakery 30 and 10 both of them needs two travels to the same point.
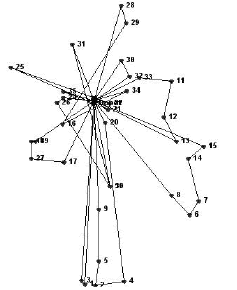
Figure 4 : Clarke and Wright method - Moto trailer
Table 6 presents a summary of the main indicators for the moto-trailer routing system.
Table 6. Moto-trailer routing indicators
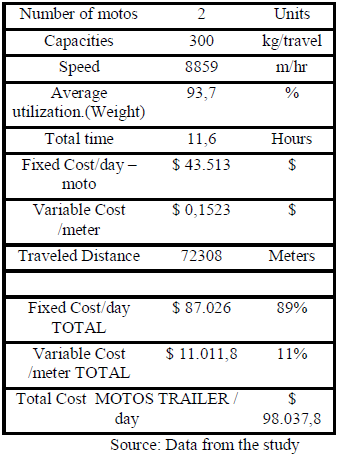
The total time is 11.6 hour, what allows programming the routing with two moto-trailer. each one has a daily operation time of $98.037. Using these two mototrailer can be serve 13 routes (Logware) with an average time of 5 hour and 46 minutes and the average occupation level of the moto-trailers is 93%. The cost structure is compose for a 89% of fixed costs, what makes necessary having a right use of this machines. A daily occupancy in time around 72%. The cost of both moto-trailer is 17.5 million pesos (2*8.250.000).
7. ROUTING USING A COMBINATION WITHIN MOTO-TRAILER AND BICYCLE
Logware results show that because the capacity of the moto-tráiler (300kg) and the bicycle (100kg) and for the cost associated a both alternatives, it was analyzed the option of using both types but limiting the number of moto-trailers to one (due that the lattest analysis showed that the system only needs two moto-trailers). This process was run in Logware.
Figure 5 shows the routing using both moto-trailer and bicycles.
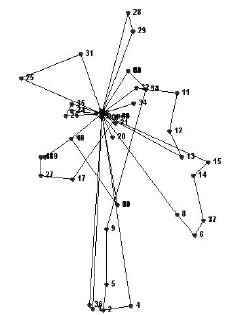
Figure 5. Clarke and Wright method. Combined Moto-trailer and Bicycle
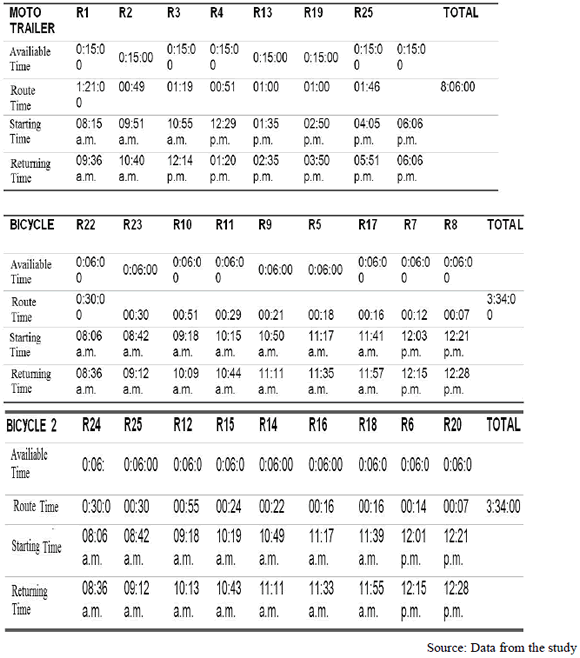
Tables 7 and 8 show the most important about the combination of both types of transportation and show that is possible to achieve a lower cost compared with the cost associated to operate only with bicycles, but compared with the cost of working only with motorcycles is more expensive. The average occupancy level using the combined system is 95.3% to motorcycles and 91.6% to bicycles.
Table 7. Combined moto-trailer and bicycle routing indicators
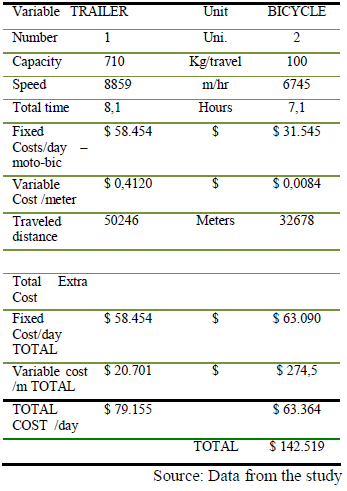
Table 8 : Routes programing for the combined system
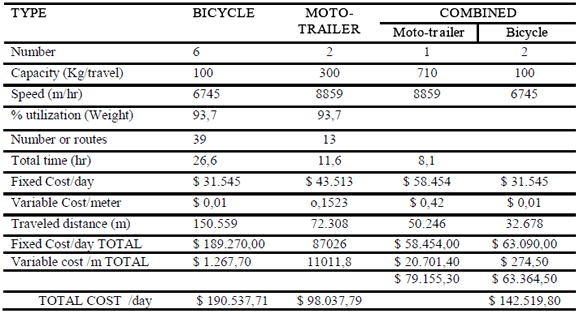
The consolidated result for the different systems (scenario) is posted in table 9. In this table it is possible to observe that the more economical system is the one using only moto-tráiler. Considering that with this of transportation the occupancy level is 93% and the utilization is 72% this method should be used if the demand increases. The previous analysis indicates that the moto-traier has a high potentiality due to the lower operation costs. In the other hand, this type of transpot has a social impact since that this system requires two people what means generating a new job in the region. Also, through this it is possible to achieve the requirements of the Instituto Nacional de Vigilancia de Medicamentos y Alimentos (INVIMA) for the handling and transportation of edible goods).
Table 9. Comparison between the three systems
In order to compare the actual situation and because cheese companies do not use information system, so the information about transportation cost is uncompleted and no precise, the transport cost were stimated using data from the CDA under the assumption that there are two people working in every moto-trailer and three people in every bicycle. Those person are dedicated exclusively to the supply goods transport. Table 10 show such costs.
Table 10 : Estimated transport cost. Cheese company
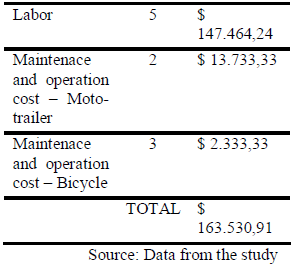
Just for comparing effects, it is assumed a conservative scenario about the labor force, assuming that they only dedicate 75% of the time in the goods distribution what means a daily cost of $122.648/day, what is a significant saving.
Comparing this result with the more economical situation using the saving method integrated to VMI practices or continue supply and with a daily deliver, the cost for the distribution is $24.610/day. For 330 days of annual labor, the saving is around 8 million pesos.
8. CONCLUSIONS
The most important aspect of this work have been to determine the basic information that will be useful for the future works that these companies should implement in order to increase their competitiveness and sustainability in the market. This way it is shown the advantages of applying accepted tools for the supply chain management and start eliminating the empirical methods that these companies still use, which are really insufficient in the recent competence environment
There was applied a technological tool to evaluate the use of an heuristics as the Clarke and Wright method to determine how the routes should be in this city. Results show that comparing the results with this new tool comparing with the empirical one used in this sub-sector the savings are great. This new system allows bakeries to have a continuous supply which helps to eliminate high inventory levels and in this way, reducing the problems associated to not to have the right facilities to stoking such goods, what is a common aspect in this sub-industry as noted in the characterization study.
REFERENCES
[1] HEMMELMAYR, V.; DOERNER, K., RICHARD F. HARTL. A variable neighborhood search heuristic for periodic routing problems. European Journal of Operational Research 195 (2009) 791-802. [ Links ]
[2] NABILA AZI, MICHEL GENDREAU, JEAN-YVES POTVIN. An exact algorithm for a single-vehicle routing problem with time windows and multiple routes. European Journal of Operational Research 178 (2007) 755-766. [ Links ]
[3] TAILLARD, G. LAPORTE, M. GENDREAU. Vehicle routing with multiple use of vehicles, Journal of the Operational Research Society 47 (1996) 1065-1070. [ Links ]
[4] CAMPBELL, M. SAVELSBERGH. Efficient insertion heuristics for vehicle routing and scheduling problems, Transportation Science 38 (2004) 369-378. [ Links ]
[5] CAMPBELL, M. SAVELSBERGH. Decision support for consumer direct grocery initiatives, Transportation Science 39 (2005) 313-327. [ Links ]
[6] SOLOMON, M. Algorithms for the vehicle routing and scheduling problem with time window constraints, Operations Research 35 (1987) 254-265. [ Links ]


