Services on Demand
Journal
Article
Indicators
-
 Cited by SciELO
 -
 Access statistics
Related links
-
 Cited by Google
 -
 Similars in
SciELO
 -
 Similars in Google
Share
DYNA
Print version ISSN 0012-7353On-line version ISSN 2346-2183
Dyna rev.fac.nac.minas vol.78 no.166 Medellín Apr./June 2011
THREE-FIBER OPTICAL PROBE FOR STUDYING FLUIDIZED GAS-SOLID BEDS IN BUBBLING REGIME
SONDA DE TRES FIBRAS ÓPTICAS PARA EL ESTUDIO DE LECHOS GAS-SÓLIDO FLUIDIZADOS EN RÉGIMEN BURBUJEANTE
ERICK REYES-VERA
Grupo de Fotónica & Opto-electrónica, Universidad Nacional de Colombia sede Medellín, eereyes@unal.edu.co
D. M. DOMINGUEZ-GOMEZ
Grupo de Fotónica & Opto-electrónica, Universidad Nacional de Colombia sede Medellín, dmdoming@unal.edu.co
JESÚS D. CAUSADO-BUELVAS
Grupo de Fotónica & Opto-electrónica, Universidad Nacional de Colombia sede Medellín, jdcausad@unal.edu.co
PEDRO TORRES
Grupo de Fotónica & Opto-electrónica, Universidad Nacional de Colombia sede Medellín, pitorres@unal.edu.co
YOLICE MORENO
Escuela de Procesos y Energía, Universidad Nacional de Colombia sede Medellín, ypmoreno@unal.edu.co
CARLOS LONDOÑO
Escuela de Procesos y Energía, Universidad Nacional de Colombia sede Medellín, clondono@unal.edu.co
ALEJANDRO MOLINA
Escuela de Procesos y Energía, Universidad Nacional de Colombia sede Medellín, amolinao@bt.unal.edu.co
Received for review December 17th, 2009, accepted Octuber 22th, 2010, final version November, 4th, 2010
ABSTRACT: This work shows the development of a three-optical fiber probe to study the behavior of the bubble in bubbling fluidized gas-solid beds. Its compact design allows minimizing disturbance to the flow field, resulting in more accurate results than other probes. Bubbling fluidized beds are widely used in petrochemical processes, metallurgical, and thermoelectric plants. The behavior of the bubble is one of the most important parameters for the simulation and design of thermoelectric reactors, as it relates to the jumping phase, the interaction between solid and gaseous phases of the bed, and the behavior of mass transfer. Knowing both the speed and the size of the bubble helps to characterize these systems, bringing about a better design of large-scale reactors.
KEYWORDS: Fluidized bed, bubble properties, fiber optic probe.
RESUMEN: En este trabajo se muestra el desarrollo de una sonda con tres fibras ópticas para estudiar el comportamiento de la burbuja en lechos gas-sólido fluidizados burbujeantes. Su estructura compacta permite minimizar las perturbaciones inducidas al campo del flujo, lográndose resultados más exactos frentes a otros tipos de sonda. Los lechos fluidizados burbujeantes son ampliamente usados en procesos petroquímicos, metalúrgicos y en termoeléctricas. El comportamiento de la burbuja es uno de los parámetros más importantes para la simulación y diseño de reactores termoeléctricos, dado que se relaciona con los saltos de fase, la interacción entre las fases sólida y gaseosa del lecho y el comportamiento de la transferencia de masa. Conocer tanto la velocidad como el tamaño de burbuja, ayudan a caracterizar estos sistemas, llevando un mejor diseño de reactores a gran escala.
PALABRAS CLAVE: Lecho fluidizado, propiedades de la burbuja, sonda de fibra óptica.
1. INTRODUCTION
Fluidized gas-solid beds are of great interest in industrial applications. These applications can be classified as physical and mechanical processes, chemical reactions, and catalysis [1]. Physical processes which use fluidized beds include drying, mixing, granulation, coating, heating, and cooling. All these processes take advantage of the excellent mixing capabilities of fluidized beds. Good mixing of solids gives rise to good heat transfer, temperature uniformity, and ease of process control.
The fluidized bed is also a good medium in which to carry out a chemical reaction involving a gas and a solid. The main reason for choosing the fluidized bed in preference to a fixed bed for synthesis reactions is the demand for a strict temperature control of the reaction zone, and the conditions in fluidized bed reactors are nearly isothermal. Practically all cracking and reforming of hydrocarbon processes are done in systems employing one or more fluidized beds. Commercial fluidized bed boilers are operating around the world for burning not only coal but also biomass and waste-derived fuels [2].
Fluidization is a simple procedure in which a gas or liquid is forced to flow upwards through a solid-particle bed supported on a porous or perforated plate in a vertical column. This flow causes a pressure drop across the bed, enough to support the weight of the particles. In gas-solid systems, an increase in gas flow rate results in the formation of bubbles. In this regime, referred to as bubbling fluidization, there is a fairly clearly defined upper surface. The bubbles have a considerable importance in the fluidized-bed reactor design because of their influence on phenomena such as gas interchange rates between phases, particle circulation rates, heat transfer, and elutriation [3].
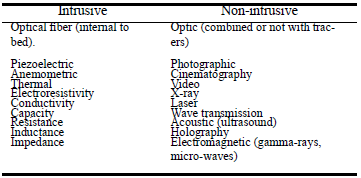
Many techniques based on a variety of principles have been developed to measure the bubble parameters, which were classified into two categories as summarized in Table 1 [4]. In general, the non-intrusive techniques based on image analysis (photographic, cinematography, holography) provide great precision, but are limited to 2D beds. X-ray photography and gamma-ray transmission are expensive and limited to low bubble-concentration regimes. Intrusive probes based on capacitance and electrical properties must be calibrated for every fluidized medium and operating condition. The differential pressure signal of piezoelectric transducers has been widely accepted as a useful method for studying bubble properties in fluidized beds, but care must be taken to keep the same dead volume in the pressure lines [5], otherwise signals are generally spurious and as dependent on global fluctuations in the bed as on local differential pressures. The application of fiber optic probes is based on the principle that the particles in the bed produce the scattering of incident light. This kind of fiber optic probe is simple in structure, easy to operate, high in sensitivity, and relatively low cost.
Table 1. Measure methods of bubble properties
There are two different arrangements of optical probes. The transmission-type probe is the one in which light input and light output are coaxial. In this way the output signals of the probe may be attenuated due to the forward scattering of particles against the incident light. It is especially important that the structure of the transmission probe should ensure that the light input and output is exactly coaxial, since any vibration of the device may produce a variation in the optical signal.
The reflection-type probe has only one tip in which the output signals are produced by the backscattering of incident light by using a different optical fiber configuration, with both light emitting fibers and light receiving fibers mixed or in rows [6].
This work is focused in both size and rise velocity measurements of the bubbles in a fluidized bed in a bubbling regime using a reflection-type probe with three telecom optical fibers. These results can be used for evaluating other important parameters such as the distribution of bubble diameter and bubble velocity [1].
2. SENSOR PROBE DESCRIPTION AND EXPERIMENTAL SETUP
The optical probe consists of a 3-mm diameter titanium-coated metal rod and three glass optical fibers of a 125 m cladding diameter and a core diameter of 62.5 m. The probe was designed in such a way that it was as small as possible, in order to minimize interference with the flow. The three fibers are aligned in the probe tip as shown in Fig. 1(a), where the central fiber was connected to a diode laser (λ = 1320 nm) to illuminate the measuring area, while the other two fibers were located above and below the central fiber—thus being separated by a known distance lg = 250 μm—and connected to separate IR photodetectors.
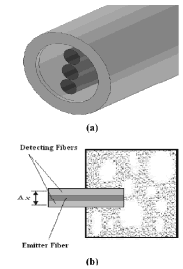
Figure 1. (a) Schematic of the three-fiber optical probe. (b) Operating principle of the probe
The probe was inserted into the fluidized bed, perpendicular to the flow as shown in Fig. 1(b). When the particles in the emulsion phase pass in front of the probe, a high percentage of the emitted light is reflected, and the photodetector responds with a high voltage signal. In contrast, when a bubble passes in front of it, relatively little light is reflected back to the probe and the photodetector responds by giving a low voltage signal.
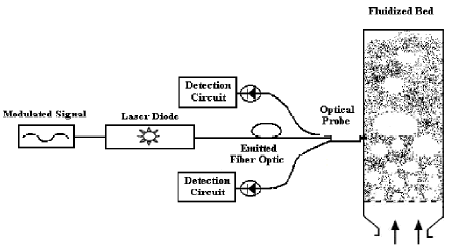
The developed experimental setup is shown schematically in Fig. 2. The fluidized bed used for the gas-solid study has an internal diameter of 0.08 m and 1.20 m in height. The gas (air at ambient conditions) was distributed with a perforated plate. The column was filled with quartz sand particles of a mean diameter of 417 ?m (with a density of 2733 kg/m3). The air relative humidity was maintained at 61% to limit electrostatic effects leading to particle deposition on the probe surface. The probe tip was located at ¼ of the diameter of the fluidized bed container, firstly, to avoid that the surplus would fall over the edges of the container, affecting the measurement and, secondly, to avoid high velocities of the particles in the middle of the fluid. To improve the signal/noise, the diode laser was modulated in amplitude at a frequency of 850 Hz, while the detector circuit has an electronic band-pass filter to the same frequency. The signal detected on each fiber was recorded with a digital oscilloscope (Tektronix, TDS1000B).
In order to distinguish the local bubble flow structure from the signals, signal processing is required. The first step is to determine when the probe is in contact with the dense phase or with bubbles. This can be achieved by plotting signal histograms. As shown in Fig. 3, histograms exhibit a peak corresponding to a dense-phase response, thus the receiving fiber is collecting the particles’ reflected light. To assess whether the fiber is in contact with bubbles or with the dense phase, a threshold voltage (Vth value), delimiting the bubble and dense phase of the histogram, can be defined with the assumption that the dense-phase peak is symmetric around the maximum voltage [7].
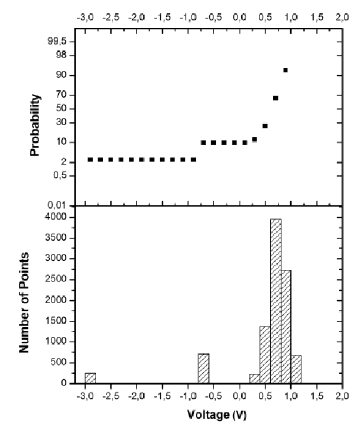
Figure 3. Typical voltage histogram
Since the probe used in the fluidized bed is equipped with two light-receiving fibers, it permits the possibility of evaluating bubble velocities. Consider a bubble passing in front of two parallel detecting fibers separated by the geometrical distance lg. If the moving path of the bubble is parallel to the end face of the fibers, the in-line component of its velocity can be determined from
 , (1)
, (1)
where leff and are the effective distance and the time lag of the signals, respectively, between the bottom and top detecting fiber. The effective distance between the light-receiving fibers is slightly different from lg, as the peak signal from particles passing in front of the probe tip is not given to each receiving fibers right when the particles are aligned with each fiber axis [8].
In order to obtain the effective inter-fiber separation distance for the probe, a calibration procedure was established with the aid of a thin rotating disk, a variable speed motor, an optical tachometer, and a probe holder. Bed particles were scattered and glued onto the disk surface, taking care to leave some small voids. The disk was driven by the motor at different rotational speeds, measured by the tachometer, to generate known void velocities. The fiber optical probe was held in position by the probe holder with the fibers in the probe perpendicular to the disk radius to minimize error. The measured void velocity data were compared with the actual velocities determined from the angular velocity and radius. Based upon the calibration data, the effective inter-fiber separation distance can be calculated.
3. EXPERIMENTAL RESULTS
In order to verify the validity and the flexibility of the three-fiber probe, experiments were performed in the developed experimental setup. Partial observations confirmed that the bubble properties are quite dispersed due to the nature of fluidization [9]. The bubble hold-up increases with increasing superficial gas velocities. The bubbles tend to flow more in the central part of the bed than along the walls.
With the probe tip located at ¼ of the diameter of the fluidized bed, typical signal samples that were recorded are shown in Fig. 4. Here we can see that when a bubble passes by, relatively little light is reflected, giving a low voltage signal.
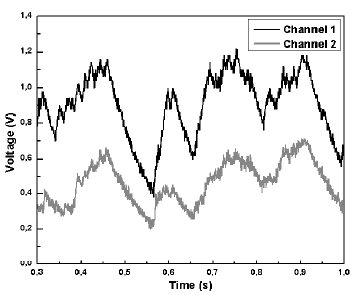
Figure 4. Typical signal samples detected on each fiber. Channel 1: Bottom receiving fiber signal; Channel 2: Top receiving fiber signal
Analyzing the attenuation peaks as shown in Fig. 5 for both signals, we can determine the time lag between the signals by using a polynomial fit (red on-line) to determine the minimum voltage point; thus, the bubble velocity can be estimated from (1). A long measurement period is required to get reproducible average bubble properties. With this procedure, we obtain the results that are listed in Table 2. Bubble velocities ranging from 59 mm/s to 90 mm/s on average were measured.
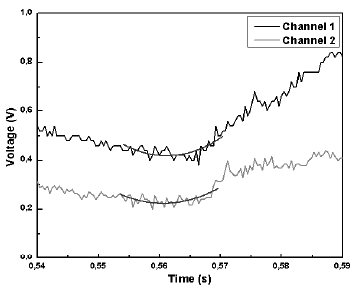
Figure 5. (Color on-line) Enlarged central region of detected signal on each fiber from the passage of a bubble
Table 2. Representative set of measured time lag and bubble velocities
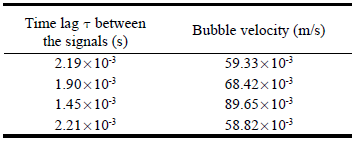
As discussed earlier, when the signal level in a measured time series is lower than a certain value (the threshold voltage), a bubble is identified. Taking the average value of the bubble velocity and the contact time of the bubble with any of the receiving fibers, the bubble length lb can also be obtained. The size of bubbles is determined from measured bubble length db = 1.43lb [10]. The data listed in Table 3 were obtained by following this procedure.
Table 3. Representative set of measured bubble size
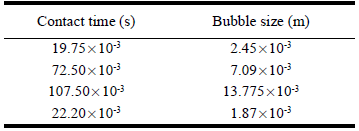
The relatively small size of the bubbles at the point where the probe tip was located is consistent with the relatively low velocity values in Table 2, since small bubbles tend to rise slowly in the fluidized bed by carrying a small amount of gas [7].
4. CONCLUSION
A compact three-fiber optical probe has been developed for studying fluidized gas-solid beds in a bubbling regime. Bubble flow structure can be determined directly from the signals. Despite the intrusive nature of the measurement, consistent results were found. Experimental results show that the probe is not only reliable, but can also generate additional useful data, such as the distribution of the bubble size and bubble velocity along the bed cross section in various operating conditions. Further research is required to evaluate the probe at different scales.
REFERENCES
[1] SOBRINO FERNÁNDEZ CELIA., Experimental study of a bubbling fluidized bed with a rotating distributor [PhD Thesis]. Madrid, España: Universidad Carlos III de Madrid, 2008. [ Links ]
[2] JOHNSSON, F., Fluidized bed combustion for clean energy, In: Fluidization XII, RP4, 47-62, 2007. [ Links ]
[3] VÁZQUEZ, C. NOMBELA, J. L. SOBRINO, C. DE VEGA, M. ZUBÍA, J. MONTERO, D. S. M., Plastic fiber-optic probes for characterizing fluidized beds in bubbling regime. In: 16th International Conference on Plastic Optical Fiber (POF), 2007. [ Links ]
[4] RAMOS CAICEDO, G. PRIETO MÁRQUEZ, J. J. GARCÍA RUÍZ, M. GUARDIOLA SOLER, J. A., study on the behavior of bubble of a 2D gas-solid fluidized bed using digital image analysis, Chemical Engineering and Processing, 42, 9-14, 2003. [ Links ]
[5] ATKINSON, C. M. CLARK, N. N., Gas sampling from fluidized beds. A novel probe system, Powder Technology, 54, 59-70, 1988. [ Links ]
[6] SOO, S.I., Instrumentation for fluid-particle flow, Norwich: William Andrew, 1999. [ Links ]
[7] SCHWEITZER, J.M. BAYLE, J. GAUTHIER, T., Local gas hold-up measurements in fluidized bed and slurry bubble column, Chemical Engineering Science, 56, 1103-1110, 2001. [ Links ]
[8] PATROSE, B. CARAM, H.S., Optical fiber probe transit anemometer for particle velocity measurements in fluidized beds, A.I.Ch.E.J., 28, 604-609, 1982. [ Links ]
[9] TAXIL, I. GUIGON, P. ARCHIMBAULT, F. GAUTHIER, T.A., Fluidization IX, New York: Engineering Foundation, 1998. [ Links ]
[10] CHAN I.E. SISAHTLA, C. KNOWLTON, T.M., Effect of pressure on bubble parameters in gas-fluidized beds. Powder Technology, 53, 217- 245, 1987. [ Links ]


