Serviços Personalizados
Journal
Artigo
Indicadores
-
 Citado por SciELO
 -
 Acessos
Links relacionados
-
 Citado por Google
 -
 Similares em
SciELO
 -
 Similares em Google
Compartilhar
DYNA
versão impressa ISSN 0012-7353versão On-line ISSN 2346-2183
Dyna rev.fac.nac.minas v.78 n.166 Medellín abr./jun. 2011
A CONCEPTUAL TRAJECTORY MULTIDIMENSIONAL MODEL: AN APPLICATION TO PUBLIC TRANSPORTATION
UN MODELO CONCEPTUAL MULTIDIMENSIONAL PARA TRAYECTORIAS: UNA APLICACIÓN EN EL TRANSPORTE PÚBLICO
FRANCISCO MORENO
Escuela de Sistemas e Informática, Universidad Nacional de Colombia, Sede Medellín, fjmoreno@unal.edu.co
FERNANDO ARANGO
Escuela de Sistemas e Informática, Universidad Nacional de Colombia, Sede Medellín, farango@unalmed.edu.co
Received for review April 9th, 2010, accepted August 5th, 2010, final version August, 18th, 2010
ABSTRACT: Currently, thanks to global positioning systems technologies and mobile devices equipped with sensors, a lot of data about moving objects can be collected, e.g., data related with the trajectories which are followed by these devices. On the other hand, Data Warehouses (DWs), usually modeled by using a multidimensional view of data, are specialized databases used to support decision-making processes. Unfortunately, conventional DWs offer little support for managing trajectories. Although there are some proposals that deal with trajectory DWs, none of them are devoted to conceptual multidimensional modeling. In this paper, we extend a conceptual spatial multidimensional model by incorporating a trajectory as a first-class concept. In order to show the expediency of our proposal, we illustrate it with an example related to public transportation.
KEYWORDS: Data Warehouses, multidimensional models, conceptual modeling, moving objects, trajectories.
RESUMEN: Actualmente, gracias a tecnologías como los sistemas de posicionamiento global y dispositivos móviles provistos de sensores, se puede recopilar una gran cantidad de datos sobre objetos móviles, e.g., datos relacionados con la trayectoria seguida por estos objetos. Por otra parte, las Bodegas de Datos (BDs), usualmente modeladas mediante una vista multidimensional de los datos, son bases de datos especializadas para ayudar en la toma de decisiones. Desafortunadamente, las BDs convencionales ofrecen poco soporte para la gestión de trayectorias. Aunque existen algunas propuestas que tratan con BDs de trayectorias, ninguna de ellas se enfoca en su modelamiento conceptual multidimensional. En este artículo se extiende un modelo conceptual multidimensional espacial donde se incorporan las trayectorias como conceptos de primera clase. Con el fin de mostrar la conveniencia de la propuesta, se presenta un ejemplo relacionado con transporte público.
PALABRAS CLAVE: Bodegas de datos, modelos multidimensionales, modelamiento conceptual, objetos móviles, trayectorias.
1. INTRODUCTION
In the last decade, Data Warehouses (DWs) [1], [2] have proven their usefulness as systems for integrating information and supporting the decision-making process. DWs are usually modeled using a multidimensional view of data [3], [4], [5]. A dimension represents a business perspective useful for analyzing factual data. For example, in a taxi company, dimensions such as Time and Taxi can be used to analyze taxi journeys. A dimension is organized in a hierarchy of levels to enable the data analysis at various levels of detail [6], [7], e.g., in our Time dimension, there exists a hierarchical relationship among days, months, and years; and in our Taxi dimension, taxis and fuel types also exhibit a hierarchical relationship, see Figure 1.
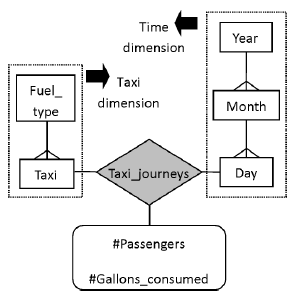
Figure 1. A conventional multidimensional model for analyzing taxi journeys
Conventional DWs mainly manage alphanumeric data; however, in recent years DWs have been enriched, e.g., with spatial data that can be useful to discover patterns that otherwise would be difficult to recognize [8], [9], [10], [11], [12], [13]. Support for temporal data has also been incorporated in DWs, for a recent survey see [14] (although DWs include a Time dimension, this dimension is not oriented to keep track of changes in other dimensions [13]; therefore, additional temporal support is required).
On the other hand, with the advance of technologies such as sensors and global positioning systems, other types of data are becoming available in huge quantities, e.g., trajectory data about the movements of people, animals, vehicles, ships, and airplanes. "The concept of trajectory is rooted in the evolving position of some object travelling in some space during a given time interval" [15]. This definition entails the spatiotemporal nature of a trajectory. We believe that the incorporation of this new type of data into a DW can help decision makers to discover interesting spatiotemporal behaviors.
In this paper, we extend a conceptual spatial multidimensional model by incorporating a trajectory as a first-class concept. To the best of our knowledge, our proposal is the first one devoted to this issue. Although there are specialized works related with trajectory DWs [16], [17], [18], [19] none of them is devoted to conceptual modeling. They focus on operators for analyzing trajectory data. Some of them [16], [17], [19] also address ETL (Extract, Transform, and Load) issues.
On the other hand, there are a few proposals [15], [20] that address conceptual modeling of trajectories but in a non-multidimensional context. In [15], two non-multidimensional conceptual modeling approaches for trajectories of moving points are proposed. The first one uses a design pattern, i.e., a predefined schema that can be adjusted to meet specific trajectory requirements. The second one uses dedicated trajectory data types equipped with a set of methods to manipulate trajectories. Methods can be added to the data types to meet specific trajectory requirements. In [20], the authors present a specialized non-multidimensional model for a traffic management system, focusing on trajectories, vehicles, and roads.
The paper is organized as follows: In Section 2, we present a motivating example. In Section 3, we discuss trajectories and their components, and introduce our multidimensional trajectory modeling approaches. Finally, in Section 4, we conclude the paper and outline future research.
2. MOTIVATING EXAMPLE
Consider a taxi company that needs to analyze its daily taxi journeys. Taxis are classified according to fuel type, e.g., gasoline, compressed natural gas (known as CNG), or E85 (85% bioethanol and 15% petrol). Data about the total number of passengers, the total number of gallons of fuel consumed, and the total fares collected by a taxi during a working day, are recorded. A multidimensional model to represent this scenario is shown in Figure 1. To represent our multidimensional models, we use basic notations from [13] based on the entity-relationship graphical notations. Note that, since the cardinality of every level (rectangles) participating in a fact relationship (grey diamond) is zero-to-many (crowfoot connector), such cardinalities are omitted [13]. A sample data of Taxi_journeys fact relationship is shown in Table 1.
Table 1. Sample data of Taxi_journeys fact relationship
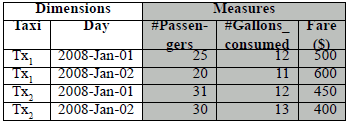
The Taxi_journeys fact relationship facilitates data analysis. For example, analysts can formulate queries such as: What is the total number of gallons consumed monthly by fuel type? What are the days of the week, when, on average, more passengers were transported in 2008? What are the top three most profitable taxis in each month, where could profitability be computed based on fuel consumption and taxi fares? These queries can be solved using current OLAP tools.
However, suppose that the taxi company also records information about the routes followed by the taxis during a day, i.e., their trajectories.
In order to track a taxi’s trajectory, a sensor sends several data packages. Each data package contains information about the position of the taxi at a specific moment, along with other information, e.g., weather conditions, the speed and fuel level (if the taxi is moving), the number of gallons of fuel purchased (if the taxi stopped to fill up), the fare (if the taxi completed a ride).
This information enables trajectory data analysis. For example, given a set of taxi trajectories, analysts could formulate the following queries:
- Find the common points of the taxi trajectories that occurred in the previous month. For that purpose, spatial and temporal thresholds could be considered: two taxi trajectories could have points separated just for one or two blocks and their trajectories could be separated in time for at most two hours. In practice, such points could be considered common, see Figure 2,
- Give a quantitative indicator of similarity [21] of the taxi trajectories that occurred on business days and that use gasoline, e.g., how similar in shape is a set of trajectories, see Figure 3, direction, average speed, or profit (where the trajectories’ profits could be calculated based on gallons of gasoline purchased and taxi fares),
- Compose a larger trajectory, see Figure 4. For example, we could put together all of the trajectories of a taxi during January 2008 and generate a single trajectory for this same month, and
- Find the number of taxi trajectories that intersect a given region, e.g., the downtown area, during the day. This number is called presence [16], [17], see Figure 5.
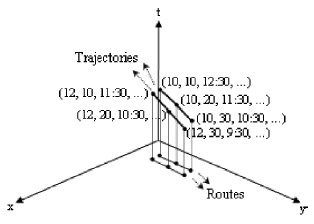
Figure 2. Two trajectories considered common within specific temporal and spatial thresholds
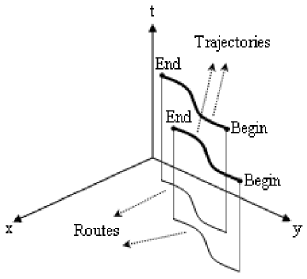
Figure 3. Two trajectories similar in shape
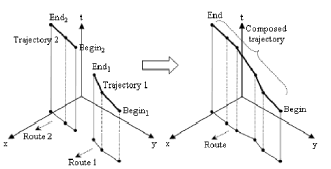
Figure 4. Assembling two trajectories. We assume that the object moves along a straight line from End1 to Begin2 at a constant speed
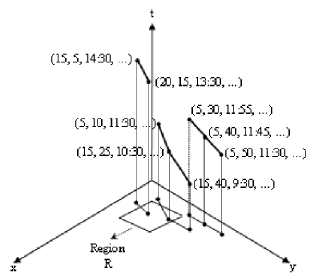
Figure 5. Three trajectories, two of them passed through region R during the same day
The answer to these questions could help to identify, e.g., profitable routes, regions of intense traffic, points to place speed controls and taxi stations.
3. TRAJECTORIES
A trajectory is the record of the evolution of the location of an object that is moving in space during a specific interval [t1, tn] [15]. This interval can be defined by the user or be application-dependent, e.g., we could consider daily or weekly trajectories for a taxi. The definition of trajectory allows for an object to make several trajectories during its lifespan, each with its specific interval. The trajectories of an object are disjoint and are not necessarily consecutive in time.
We represent a trajectory T as a sequence of observations (generated by a sensor), i.e., time-stamped locations that can include complementary semantic data about the trajectory. T = <o1, o2, …, on> where each oi = (li, ti, si), i.e., the travelling object is at location li at time ti (ti < ti+1) and semantic data si can be associated with each observation.
Note that for a moving region, the projection on the plane of its trajectory locations gives us its traversed area [22]. On the other hand, for a moving point, the projection on the plane of its trajectory locations gives us its route [23], [24]. For simplicity, we restrict the discussion hereafter on moving points. Unless more information becomes available, the object is assumed to move along a straight line from location (xi, yi) to location (xi+1, yi+1) [22]. Figure 6 shows the trajectory of a moving point with four observations and its corresponding route.
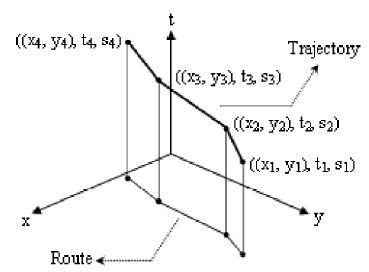
Figure 6. Trajectory of a moving point
Note that we attach semantic information to trajectories, which is of fundamental importance for their analysis [25], [26]. However, not necessarily the same type of semantic data is included in all of the observations. For example, let us consider a taxi trajectory: when the taxi stops to fill up, we could collect data about the number of gallons of fuel purchased, when the taxi stops to pick up passengers we could collect data about the fare, and when the taxi is moving we could collect data about its speed and fuel level. Therefore, depending on the requirements of a particular application, trajectory observations can be classified into types. In the previous example, we could define three types of observation: fill-ups, pick-ups, and moves. There could be some semantic data common to all or just some of the types of observation defined. For example, data about weather conditions could be included in the three types of observation previously defined.
To represent a trajectory in our multidimensional model, we propose the icons of Figure 7. Figure 7 (a) represents the trajectory of a moving generic geometry Geo. A Geo can be replaced by a simple or a complex geometry, see Figure 8. For example, Figure 7 (b) represents the trajectory of a moving point (e.g., a taxi); Figure 7 (c), the trajectory of a moving line (e.g., a train); Figure 7 (d), the trajectory of a moving region (e.g., a hurricane, an oil spill); and Figure 7 (e), the trajectory of a moving group of regions (e.g., a group of clouds).

Figure 7. Notations for a trajectory of a moving: a) generic geometry, b) point, c) line, d) region, and e) group of regions
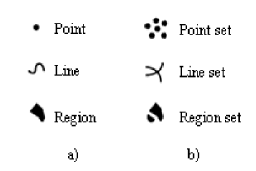
Figure 8. Notations for: a) simple geometries and b) complex geometries. Source: [13], [27]
In order to specify types of observation and their corresponding semantic fields, we propose the notation shown in Figure 9. Note that each observation type implicitly includes the object’s location (in accordance with the geometry associated with the trajectory) and its corresponding timestamp. For example, consider the icon of Figure 7 (b), an instance of an observation type of this trajectory is represented as ((x, y), t, semantic fields). Now consider Figure 7 (c), an instance of an observation type of this trajectory is represented as ((p1, p2), semantic fields) where p1 and p2 are points that define, e.g., a straight line.
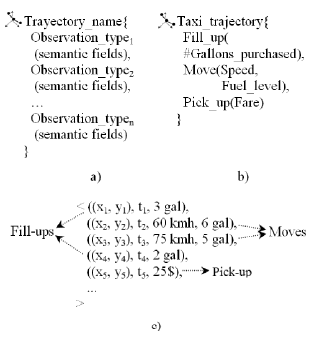
Figure 9. Representation of types of observation: a) a trajectory of a moving point with n types of observation, b) a taxi trajectory with three types of observation, and c) instances of types of observation of b)
In the following section, we incorporate a trajectory into a multidimensional model. To facilitate this task, we propose two modeling approaches: composed multivalued timestamped measures, and composition of facts.
3.1 Composed multivalued timestamped measures
Continuing with the example of taxi trajectories, we classify taxi observations into three types: fill-ups, pick-ups, and moves. The following semantic data is associated with them: stopping time and number of gallons of fuel purchased with fill-ups, stopping time and fare with pick-ups, and fuel level and speed with moves. Note that we consider observations to be sensor snapshots. In this example, we assume a minute to be the temporal granularity of an observation.
We define a Taxi_journeys fact relationship, see Figure 10. Observations are represented by three composed multivalued time-stamped measures: Fill_up, Pick_up, and Move. Table 2 shows sample data of the Taxi_journeys fact relationship.
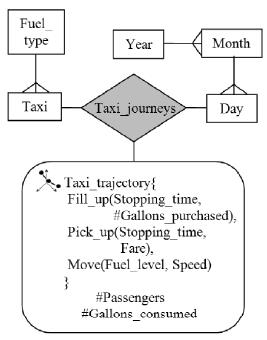
Figure 10. A multidimensional model for analyzing taxi trajectories using composed multivalued timestamped measures
Table 2. Sample data of Taxi_journeys fact re
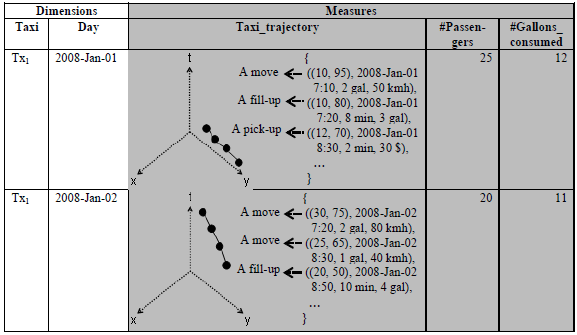
Although this solution is natural and compact, it has some drawbacks: i) the aggregate functions must deal with multivalued measures which could prevent their use in current OLAP systems, ii) the handling of the relationship between the observations’ timestamps and the time dimension is required in order to enable time hierarchy navigation, because these implicit timestamps are not connected to a time level, e.g., minute (dimension levels can be connected to fact relationships, but not to measures), and iii) time consistency checks are required, e.g., the observations’ timestamps must "rollup" to the same day associated with their taxi journey, and the timestamp of an observation cannot intersect the interval made up by the timestamp of any fill-up (or pick-up) observation plus its stopping time. In order to overcome some of these difficulties, we propose an alternative modeling approach in the following subsection.
3.2 Composition of facts
We define four fact relationships: Taxi_journeys, Fill_ups, Pick_ups, and Moves; see Figure 11. In this approach, the Taxi_trajectory measure is derived from the fact relationships Fill_ups, Pick_ups, and Moves, that represent the trajectory observations. A derived measure is generated from other measures and is indicated by preceding its name with a slash (/).
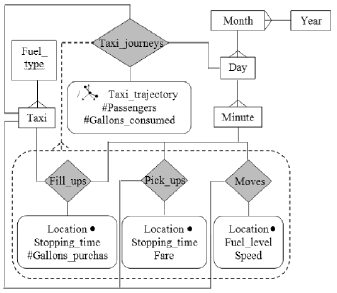
Figure 11. A multidimensional model for analyzing taxi trajectories using the composition of facts
Each taxi journey includes a set of observations; to represent such a composition we propose a dotted relationship, see Figure 11. A composition such as this implies that if a taxi makes a journey on a day (e.g., 2008-Jan-01), there must be a non-empty set of observations associated with this journey. In addition, the minute values of those observations must rollup to the same day (2008-Jan-01).
This approach, unlike the previous one, does not require the handling of multivalued measures, and the observations’ timestamps are explicitly connected to a time level, enabling time hierarchy navigation.
However, this solution also has some drawbacks: i) an operation that relates fact relationships is required in order to combine a taxi journey with its observations, i.e., a type of drill-across operation [28], and ii) the handling of several fact relationships can become complex, e.g., for the formulation of queries. Because a fact relationship is created for each observation type, if the number of types of observation is high, we would have to deal with a proliferation of fact relationships. In Table 3, we compare our trajectory modeling approaches.
Table 3. Comparison of our trajectory modeling approaches

4. CONCLUSIONS AND FUTURE WORK
We proposed a notation for representing trajectories as a first-class concept in a conceptual spatial multidimensional model. We stressed the semantic nature of a trajectory by classifying its observations in accordance with their semantic data. Two modeling approaches were presented. The first one is based on composed multivalued measures. The second one is based on the composition of facts relationships.
A preliminary judgment suggests that the first approach could be more suitable than the second one when the number of types of observation is high. However, other criteria, such as the handling of aggregation, implementation issues, performance, and storage, among others, must be considered in order to evaluate both approaches.
For future work, we plan on transforming our conceptual model into a logical one. From a physical point-of-view, a related issue is how to store and efficiently retrieve a trajectory in a multidimensional context. Data structures and indexing schemes must be designed for this purpose. We also plan to develop a query language in order to express analytical trajectory queries, such as the ones of Section 2. Operators related to trajectory aggregation should also be addressed. The works of [16], [17], [18], [19] are starting points for these issues.
REFERENCES
[1] INMON, W. H. Building the Data Warehouse, John Wiley & Sons, New York, 2005. [ Links ]
[2] KIMBALL, R., ROSS, M., THORNTHWAITE, W., MUNDY, J. AND BECKER, B. The Data Warehouse Lifecycle Toolkit, John Wiley & Sons, New York, 2008. [ Links ]
[3] AGRAWAL, R., GUPTA, A. AND SARAWAGI, S. Modeling multidimensional databases, 13th ICDE, Birmingham, U.K, 301-311,1997. [ Links ]
[4] GYSSENS, M. AND LAKSHMANAN, L. A foundation for multi-dimensional databases, 23rd VLDB, Athens, Greece,106-115,1997. [ Links ]
[5] VASSILIADIS, P. Modeling multidimensional databases, cubes and cube operations, 10th SSDBM, Capri, Italy, 53-62, 1998. [ Links ]
[6] TORLONE, R. Conceptual multidimensional models, In: Multidimensional Databases: Problems and Solutions (Ed. M. Rafanelli), Idea Pub., 69-90, 2003. [ Links ]
[7] KUMAR, N., GANGOPADHYAY, A., BAPNA, S., KARABATIS, G. AND CHEN, Z. Measuring interestingness of discovered skewed patterns in data cubes, Decision Support Systems, 46(1), 429-439, 2008. [ Links ]
[8] HAN, J., STEFANOVIC, N. AND KOPERSKI, K. Selective materialization: an efficient method for spatial data cube construction, 2nd PAKDD'98, Melbourne, Australia, 114-158, 1998. [ Links ]
[9] BÉDARD, Y., MERRETT, T. AND HAN, J. Fundaments of spatial data warehousing for geographic knowledge discovery, In: Geographic Data Mining and Knowledge Discovery (Ed. H. Miller), Taylor & Francis, 53-73, 2001. [ Links ]
[10] JENSEN, C. S., KLIGYS, A., PEDERSEN, T. B. AND TIMKO, I. Multidimensional data modeling for location-based services, VLDB Journal, 13(1), 1-21, 2004. [ Links ]
[11] BIMONTE, S., TCHOUNIKINE, A. AND MIQUEL, M. Towards a spatial multidimensional model, 8th DOLAP, Bremen, Germany, 39-46, 2005. [ Links ]
[12] DAMIANI, M. L. AND SPACCAPIETRA, S. Spatial data warehouse modeling, In: Processing and Managing Complex Data for Decision Support (Ed. J. Darmont), Idea Pub., 1-27, 2006. [ Links ]
[13] MALINOWSKI, E. AND ZIMÁNYI, E. Advanced Data Warehouse Design: from Conventional to Spatial and Temporal Applications, Springer, New York, 2008. [ Links ]
[14] GOLFARELLI, M. AND RIZZI, S. A survey on temporal data warehousing, Int. Journal of Data Warehousing and Mining, 5(1), 1-17, 2009. [ Links ]
[15] SPACCAPIETRA, S., PARENT, C., DAMIANI, M. L., FERNANDES DE MACÊDO, J. A., PORTO, F. AND VANGENOT, C. A conceptual view on trajectories, Data & Knowledge Engineering, 65(1), 126-146, 2008. [ Links ]
[16] BRAZ, F. J. Trajectory data warehouses: proposal of design and application to exploit data, 9th GeoInfo, Campos do Jordão, Brazil, 61-72, 2007. [ Links ]
[17] ORLANDO, S., ORSINI, R., RAFFAETÀ, A. AND RONCATO, A. Trajectory data warehouses: design and implementation issues, Computing Science and Engineering, 1(2), 211-23, 2007. [ Links ]
[18] ORLANDO, S., ORSINI, R., RAFFAETÀ, A., RONCATO, A. AND SILVESTRI, C. Spatio-temporal aggregations in trajectory data warehouses, 9th DaWaK, Regensburg, Germany, 66-77, 2007. [ Links ]
[19] MARKETOS, G., FRENTZOS, E., NTOUTSI, I., PELEKIS, N., RAFFAETÀ, A. AND THEODORIDIS, Y. Building real world trajectory warehouses, 7th MobiDE'08, Vancouver, Canada, 1-8, 2008. [ Links ]
[20] BRAKATSOULAS, S., PFOSER, D. AND TRYFONA, N. Modeling, storing, and mining moving object databases, 8th IDEAS, Coimbra, Portugal, 68-77, 2004. [ Links ]
[21] PELEKIS, N., KOPANAKIS, I., NTOUTSI, I., MARKETOS, G. AND THEODORIDIS, Y. Mining trajectory databases via a suite of distance operators. 23rd ICDE, Istanbul, Turkey, 575-584, 2007. [ Links ]
[22] GÜTING, R. H AND SCHNEIDER, M. Moving Objects Databases, Morgan Kaufmann, San Francisco, 2005. [ Links ]
[23] VAZIRGIANNIS, M. AND WOLFSON, O. A spatiotemporal model and language for moving objects on road networks, 7th SSTD, Redondo Beach, USA, 20-35, 2001. [ Links ]
[24] FRENTZOS, E., GRATSIAS, K., PELEKIS, N. AND THEODORIDIS, Y. Nearest neighbor search on moving object trajectories, 9th SSTD, Angra dos Reis, Brazil, 328-345, 2005. [ Links ]
[25] ALVARES, L. O., BOGORNY, V., KUIJPERS, B., FERNANDES DE MACÊDO, J. A., MOELANS, B. AND VAISMAN, A. A. A model for enriching trajectories with semantic geographical information, 15th ACM-GIS, Seattle (Washington), USA, 162-169, 2007. [ Links ]
[26] GUC, B., MAY, M., SAYGIN, Y. AND KÖRNER, C. Semantic annotation of GPS trajectories, 11th AGILE, Girona, Spain, 1-9, 2008. [ Links ]
[27] PARENT, C., SPACCAPIETRA, S. AND ZIMÁNYI, E. Spatio-Temporal conceptual models: data structures + space + time, 7th ACM-GIS, Kansas, USA, 26-33, 1999. [ Links ]
[28] GOLFARELLI, M., MAIO, D. AND RIZZI, S. The dimensional fact model: a conceptual model for data warehouses, Int. Journal of Cooperative Information Systems, [ Links ]


