Services on Demand
Journal
Article
Indicators
-
 Cited by SciELO
 -
 Access statistics
Related links
-
 Cited by Google
 -
 Similars in
SciELO
 -
 Similars in Google
Share
DYNA
Print version ISSN 0012-7353On-line version ISSN 2346-2183
Dyna rev.fac.nac.minas vol.78 no.170 Medellín Dec. 2011
HYBRID APPROACH FOR AN OPTIMAL ADJUSTEMENT OF A KNOWLEDGE-BASED REGRESSION TECHNIQUE FOR LOCATING FAULTS IN POWER DISTRIBUTION SYSTEMS
ESTRATEGIA HÍBRIDA PARA CALIBRACIÓN ÓPTIMA DE UNA TÉCNICA DE REGRESIÓN BASADA EN EL CONOCIMIENTO PARA LOCALIZACIÓN DE FALLAS EN SISTEMAS DE DISTRIBUCIÓN DE ENERGÍA ELÉCTRICA
EVER CORREA-TAPASCO
Ingeniero Electricista, M.Sc., Universidad Tecnológica de Pereira, Auxiliar de investigación, everjulian1@gmail.com
JUAN MORA-FLÓREZ
Ingeniero Electricista Ph.D., Universidad Tecnológica de Pereira, Docente, jjmora@utp.edu.co, jjmora001@hotmail.com
SANDRA PÉREZ-LONDOÑO
Ingeniero Electricista M.Sc., Universidad Tecnológica de Pereira, Docente, saperez@utp.edu.co
Received for review: August 31st, 2009; accepted: May 3th, 2011; final version: Sept. 16th, 2011
ABSTRACT: This paper is focused in the development of a hybrid approach based on support vector machines (SVMs) which are used as a regression technique and also in the Chu-Beasley genetic algorithm (CBGA) which is used as an optimization technique to solve the problem of fault location. The proposed strategy consists of using the CBGA to adequately select the best configuration parameters of an SVM. As a result of the application of this strategy, a well-suited tool is obtained to relate a set of inputs to a single output in a classical regression task, which is next used to determine the fault distance in power distribution systems, using single end measurements of voltage and current. The proposed approach is initially tested in a simplified regression task using two functions in Â1 and Â2, where the results obtained are highly satisfactory. Next, the selection of the adequate calibration parameters is performed in order to adjust the SVM using a cross validation strategy, where an average error of 5.75 % is obtained. These results show the adequate performance of the proposed methodology which merges SVM and CBGA into one powerful fault locator for application in power distribution systems.
KEY WORDS: fault location, genetic algorithms, power distribution systems, regression, support vector machines
RESUMEN: Este artículo está orientado al desarrollo de un método híbrido que combina una técnica de regresión como las máquinas de soporte vectorial y una técnica de optimización como el algoritmo genético de Chu-Beasley, para resolver el problema de localización de fallas. La estrategia propuesta consiste en la utilización del algoritmo genético para la selección adecuada de los mejores parámetros de configuración de la máquina de soporte vectorial. Como resultado de la aplicación de esta estrategia se obtiene una herramienta adecuada para relacionar un conjunto de entradas con una única salida en una tarea clásica de regresión, la cual es utilizada para determinar la distancia a la falla en sistemas de distribución, a partir de las medidas de tensión y de corriente en un terminal de la línea. La estrategia propuesta se prueba preliminarmente utilizando dos funciones sencillas en Â1 y Â2, donde los resultados son altamente satisfactorios. Luego, se realiza la selección de los parámetros adecuados de calibración de la SVM y como resultados para cuatro diferentes localizadores propuestos, se obtiene un error promedio en validación cruzada de 5,75 %. Estos resultados muestran el desempeño adecuado de la metodología propuesta, la cual combina las máquinas de soporte vectorial con el algoritmo genético, en un potente localizador de fallas aplicado a los sistemas de distribución de energía eléctrica.
PALABRAS CLAVE: algoritmos genéticos, localización de fallas, máquinas de soporte vectorial, regresión, sistemas de distribución de energía eléctrica
1. INTRODUCTION
One aspect of power quality is associated with service continuity, normally described by indexes such as the system average interruption frequency index (SAIFI) and the system average interruption duration index (SAIDI) [1,2].
Faults cause supply interruptions, responsible for unacceptable continuity indexes. Fault locators help to reduce the effect of faults on continuity indexes in three ways: First, location helps to speed up the restoration process; second, by locating the fault, it is possible to perform switching operations to reduce the faulted area; and finally, by locating non-permanent faults, it is possible to perform maintenance tasks in order to avoid future faults [3].
Several approaches have been proposed for locating faults in transmission systems, providing high accuracy estimations [4-7]. However, these algorithms are not useful in distribution systems due to some of their characteristics, such as: (a) voltage and current are typically measured at the distribution substation; (b) the presence of single and double phase laterals; (c) variable tapped loads; and (d) lines with heterogeneous sections (different conductor gauges, overhead lines, and underground cables, among others).
The common approaches used for locating faults are mainly oriented in two ways, those which use the fault impedance as seen from the power substation as is presented in [8-11], and those which use soft computing techniques to extract information related to the fault location as is proposed in [3,12-15].
On the other hand, several methods have been proposed for locating faults in distribution systems. These estimate the distance based on the impedance calculation during the fault as seen from the substation. The pre-fault and fault effective values of the fundamental currents and voltages at the substation are used as the inputs for those methods [8-11,16]. The common drawback of such methods is the high model dependency.
Additionally, many researchers have addressed the fault problem using knowledge-discovering techniques, exploiting the previous experiences and contextual information. An approach which uses two end-line measurements to locate faults in transmission systems is given in [13] showing how learning techniques such as neural networks could be used. Some approaches which deal with classification problems applied to fault location are presented in [3,12,15]. One regression application which uses a constrained and straightforward technique known as the k nearest neighbors is presented in [17]. This approach is adjusted based on an extensive test of the possible values of the configuration parameters, and consequently it has a high computational cost.
In this paper, a support vector machines (SVMs) based strategy, which uses the information from single-end measurements of the 60 Hz component of current and voltage (fundamental component), is proposed for determining the fault distance. This approach uses the information of fault databases which are currently found in distribution utilities. In addition, this paper presents a methodology for adjusting the parameters of the SVM based regressor (SVM-r), using genetic algorithms (GAs), as an optimization technique.
The paper is presented in five sections. In Section 2, the basis of the theoretical background of the support vector machines and the genetic algorithms is presented. Next, in Section 3, the methodological approach used to develop the fault locators is described in detail. Section 4 exemplifies the application of the proposed regression strategy in the IEEE 34-bus test feeder. Finally, Section 5 is devoted to concluding and summarizing the main contributions of the proposed approach.
2. FUNDAMENTAL ASPECTS RELATED TO THE PROPOSED APPROACH
One learning algorithm used in data analysis is the SVM, which is based on quadratic programming and kernel transformations. The setting of the SVM could be based on the programmer's criteria, but normally it is not an optimal adjustment, and it is the main reason why the GAs are also used here.
This section is devoted to present the basis of these techniques. However, several references such as [18-21] are given here, considering that a detailed explanation of such techniques is out of the scope of this paper.
2.1 Support vector machines used for regression (SVM-r)
SVM-r is a technique used to relate the inputs (a set of descriptors obtained from the fault database) to a single output (fault distance), reducing the estimation error. The SVM as a regression tool is a relatively new technique, with a well-defined mathematical description, and successful applications in much engineering research [22-24]. The SVM regression function is defined as presented in (1).

where áw, xñ indicates the inner product of the weight vector w and the training data matrix x, and b is a bias term. The aim is to obtain a minimum w which represents a minimum slope and, consequently, the function tends to be flat, obtaining the best regression function.
The minimum value of w, represented by the Euclidean norm, is obtained as described in (2).

where ε is the index used to measure the precision degree of the function f, considering all of the pairs (x,y), as is shown in Fig. 1. The objective is to obtain a function f with a maximum deviation given by ε (error function or tube radius) obtained from the input training data and the corresponding images (y). Simultaneously, the function f should be as flat as possible (small value of w).
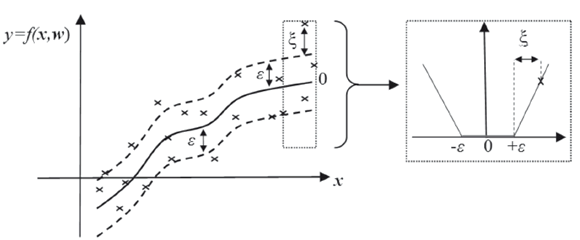
Figure 1. Soft margin in a classical regression problem
To consider possible errors (data outside the boundaries defined by ε), the optimization problem is redefined as is given in (3). This formulation considers the ε-intensive loss function defined by the parameter |ξ|. This definition of the optimization problem is known as soft margin SVM-r [19]. The penalization constant C determines the compensation between the flatness of f and the tolerated deviations ε.

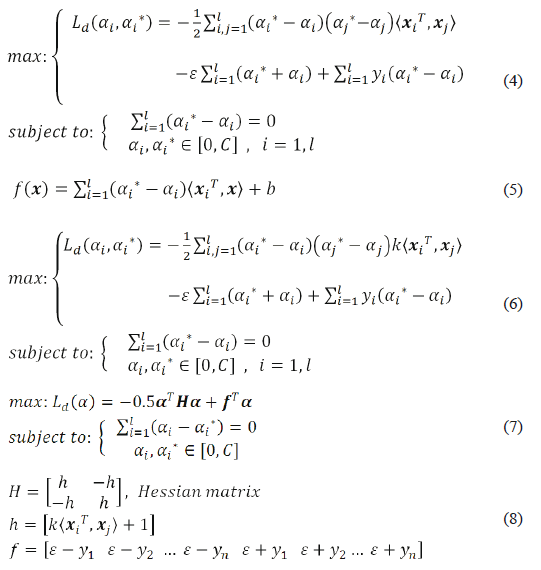
The problem defined in (3) is solved from the dual formulation using the Lagrange multipliers, to satisfy the Karush Kuhn Tucker conditions (KKT). Variable l corresponds to the number of data cases. This reformulated dual problem is presented in (4) and function f is given in (5), where a is the vector of Lagrange multipliers.
2.1.1 Non linear regression
The non linear regression function is defined as a dual optimization problem as is presented in (6). This is similar to the linear regression problem explained above and the only difference is related to the kernel function denoted as k áxiT, xñ. The problem proposed in (6) could be solved by using a quadratic programming optimizer. The equation (7) presents the classical quadratic problem, where, in the case of regression, H and f are defined as presented in (8)
Having solved the optimization problem, by the determination of all of the values of a and a*, the weight vector w0 for the regression hyperfunction is obtained as is presented in (9).

The value of bias b0 is obtained as given in (10).

where ti is the i component of vector t=h.w0, and h is the corresponding kernel matrix defined in (9). The best regression hyperfunction is then obtained as is presented in (11).

Additionally, h0 is a vector obtained by applying the kernel transformation to the data vectors used for training and testing the SVM-based regression algorithm.
2.1.2 Some commonly used kernel functions
The basic principle of the non linear SVM-r is to establish a relation between the inputs (descriptors), converted into a representation space given in Ân and the output given in Â1 (fault location). The original inputs given in an input space Âm (m < n) are transformed into the representation space by using a kernel function denoted as k áxiT, xñ. Some of the most used kernels are the linear, the polynomial, and the Gaussian or radial basis kernel (12), which is the one used in this paper, due to the good results normally obtained in the other applications [18]. Variable s2 represents the population variance.

2.2 Genetic algorithms (GAs)
The GAs are a well known search technique used to find adequate solutions in optimization problems. These algorithms are categorized as global search hyper-heuristics and are a particular class of evolutionary algorithms (also known collectively as evolutionary computation), which use concepts inspired by biology such as inheritance, mutation, selection, and crossover (also called recombination) [20]. The GAs are implemented as a computer evolutionary simulation where a population of abstract representations of solution candidates (individuals) of an optimization problem evolves toward better solutions.
2.2.1 Chu-Beasley genetic algorithm (CBGA)
The CBGA is a modified version of the basic algorithm, aimed to maintain the diversity among the individuals. It is an elitist algorithm considering that a parent is replaced by a descendent, if and only if, the last one has a better objective function. Each one of the individuals have to be different from the other individuals (diversity), avoiding the premature convergences to local suboptimal solutions. A diversity criterion has to be chosen to maintain a predefined difference degree among individuals. Figure 2 shows a basic representation of the CBGA functioning [21].
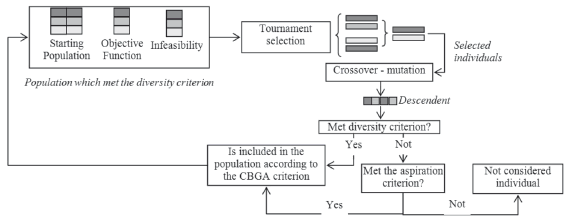
Figure 2. Chu-Beasley algorithm basic functioning scheme
Additionally, an aspiration criterion is used in CBGA, to consider the inclusion of an individual which does not met the diversity, if and only if, this objective function is better than the best objective function in the population. In this case, all of the individuals who do not satisfy the diversity criterion (taking into account the new member included by considering the aspiration criterion), have to be removed from the population. All of the removed members have to be replaced in the next generation, in order to maintain the population size. The Chu-Beasley algorithm only changes a single individual in each generation, while the basic approach normally modifies the entire population.
3. PROPOSED HYBRID FAULT LOCATION APPROACH
Most of the power distribution utilities have installed event recorders, but do not have enough automatic strategies to manipulate the data obtained, in order to obtain an effective model for supporting the decision-making process. As a consequence, most of the information stored is not used and the improvement process in the power utility is not effective. This is a direct consequence of the high economical cost of the available commercial alternatives to increase the power system continuity, and the reduced analysis of the information obtained from fault registers and protective relays [25-27].
This research is oriented to use most of the information stored in fault databases, which contain fault registers of currents and voltages, measured at the power substation. By using the information contained in such fault registers, it is possible to determine the fault location as is proposed and demonstrated in this paper. Specifically, this research has been carried out by considering the use of a hybrid alternative which combines a knowledge-based method such as the SVM-r, and a search technique such as the CBGA, to give a practical solution to the fault location problem in power distribution systems. The basic structure of the proposed approach is presented in Fig. 3, where the core of the fault locator is the SVM-r, the inputs are the so called descriptors and correspond to the information obtained from the currents and voltages stored in the fault database; and finally, the best configuration parameters are selected by using a search technique such as the CBGA.
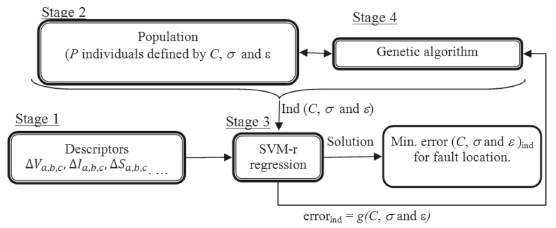
Figure 3. General methodology proposed to develop the hybrid fault locator
3.1 Methodology to develop the proposed fault locator
The proposed methodology is based on four fundamental stages: The first one is oriented to obtain the proposed descriptors from the stored registers of voltage and current, and associated to the fault location; the second one is oriented to randomly generate a population of the possible configurations of the SVM-r; the third stage is oriented to test all of the proposed individuals of the population and to estimate the error in each one of the cases; the fourth stage is devoted to update the population according to the evolutionary behavior of the CBGA. The fault location is an iterative process that stops when one of the following two criteria is reached: (a) the maximum number of generations, or (b) an estimated error lower than a predefined threshold. This process is repeated for the 15 combinations of the set of inputs, as it is described later. Figure 3 presents the general structure proposed for the fault locator.
3.3.1 First stage: Definition of the descriptors
The inputs to the fault locator (SVM-r) are characteristics (descriptors) obtained from the voltages and currents stored in the fault database.
These descriptors are related to the fault location and are based on the variations of the 60 Hz component of currents and voltages. The variations of the fundamental component of phase current (DI), phase voltage (DV), phase reactance (DX), and apparent power (DS) are proposed as descriptors. These are defined as the subtraction of rms values during the fault and pre-fault steady states [28]. Three phase descriptors are used to consider the mutual coupling and the fault resistance influences. Finally, the input descriptors are normalized from 0 to 1 interval values.
3.1.2 Second stage: Randomly generation of the starting population
This stage is devoted to generate an initial population of P individuals which contains the possible configurations of the SVM-r. These individuals have to meet the diversity criterion. The individuals are defined by the SVM-r configuration parameters as: a) penalization constant (C), b) the kernel parameter (s), and c) the error function parameter or tube radius (e). Each parameter is described as a phenotype and as a consequence. The proposed individual has three phenotypes.
3.1.3 Third stage: Testing the proposed individuals
This stage is the central part of the proposed methodology and consists of training and testing the fault locator based on SVM-r, using each one of the proposed configuration parameters, given by the individuals of the population previously defined by the CBGA.
Using the SVM-r at this stage, given several descriptors such as inputs and the obtained configuration parameters (C, s, and e), the regression function f is estimated. The function f is used next to estimate the distance to the fault.
Considering that there is not any information beforehand about which SVM-r parameters are the best, model selection (parameter evaluation) has to be done using cross-validation. In v-fold cross-validation, first a subdivision of the training set into v subsets is performed. Sequentially, one subset is tested using the SVM-r trained on the remaining v-1 subsets. Thus, each instance of the whole training set is predicted once, so the absolute error for each cross-validation subset is estimated as is presented in (13). Variable N is the number of fault registers in each subset and (v-fold) × N gives the total training faults used.

where Lest correspond to the distance estimated using the SVM-r, and Lreal is the real distance where the fault is located, Ltotal is the total feeder length, and j identifies the corresponding cross validation process. The objective error function g which has to be minimized is defined as it is presented in (14). This error is the one obtained in the v-fold validation process, given a set of descriptors as input and a single individual (ind), which defines the SVM-r configuration parameters.

Finally, function g also represents the cross validation training error of each individual (ind), and it is used to establish the adaptation capability and the evolution probability of the population.
3.1.4 Fourth stage: Updating the population
The updating process is considered by following the basic theoretical aspects of the CBGA, such as controlled diversity and the aspiration criteria as it is presented in Section 2. Having defined the adaptation capability as the estimation error, the complete process using CBGA is oriented to obtain the minimum value of the function g.
All of the stages are continuously repeated until the value of the error function g reaches a value which has to be lower than a predefined threshold. Other stopping criterion is reached when the algorithm performs a predetermined number of iterations. The value of the obtained optimal configuration parameters (C, s, and e), are used in each one of the cases proposed for testing in the following section.
4. TEST AND RESULT ANALYSIS
4.1 Preliminary tests using simulated data
The strategy which combines the SVM and the CBGA here proposed is initially tested in a simple regression task, using two functions f(x) in Â1 and Â2, and following a 4-fold cross validation strategy. The parameters of CBGA used in these tests include a maximum number of 1000 generations, 150 repetitions of the best result obtained as additional stopping criterion, a population of 50 individuals, mutation rate, a crossover rate of 100 %, and tournament selection of two individuals. The first function in Â1 used is the presented in (15).

In this case, 101 samples were used as a training set and the obtained absolute cross validation error is 1.62 %. The calibration parameters C, s, and e, obtained using the CBGA-based optimization strategy are 369737595, 1.216, and 0.001, respectively. In Fig. 4a, the real (continuous line) and the estimated (dots) functions are presented. The testing set contains 98 samples.
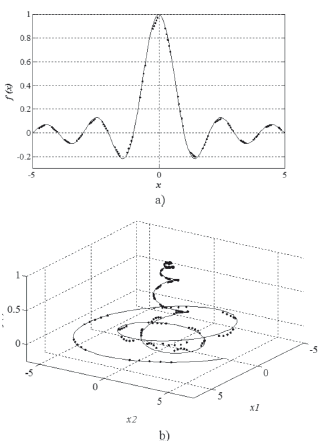
Figure 4. Real function (continuous line) and the estimated function (dots) using the hybrid approach based on SVM-r and CBGA, a) Â1 b) Â2
Next, a Â2 preliminary test function, as the one presented in (16), is also analyzed.

In this case, 201 samples are used as a training set and the obtained relative cross validation error is 1.79 %. The calibration parameters C, s, and e, obtained using the CBGA based optimization strategy are 947,988,396; 14.554; and 0.001; respectively. In Fig. 4b, the real (continuous line) and the estimated (dots) functions are presented. The testing set contains 191 samples.
Those two preliminary examples show the capability and functionality of the proposed strategy, which is next applied for locating faults in power distribution systems.
4.2 Description of tests in a power distribution system
The 24.9 kV IEEE 34-bus test feeder in Fig. 5 is used to test the fault location approach [29]. A complete dataset is obtained from fault simulation in each node of the test feeder, by considering all of the shunt fault types and 21 fault resistances from 0.05 to 40 ohms [30]. A set of 2730 faults obtained from the power distribution system at nominal conditions (300 short circuit MVA and nominal load), were simulated using an integrated environment linking ATP and Matlab [31].

Figure 5. IEEE 34-bus test feeder
The test performed to evaluate the performance of the proposed fault locator considers faults along the power system main feeder presented in Fig. 5 (from node 802 to node 840). A fault database of 500 faults is used in the training stage, to determine the absolute 4-fold cross validation error defined in (14).
The fault data corresponds to measurements during single phase, phase to phase, double phase to ground and three phase faults, considering fault resistances of 0.1 W, 5 W, 18 W, 20 W, and 40 W. The parameters of the CBGA are the same used in preliminary tests, except the number of individuals of the population which in this case is 20.
4.3 Test results, analysis and discussion
Results for the best configuration parameters for each one of the set of descriptors used as inputs of the SVM-r based fault locator are presented in Table 1. This table also considers four different fault locators, according to the fault type.
Table 1. Best configuration parameters as a function of the set of descriptors used as inputs for the SVM-r, for all of the four different fault locators
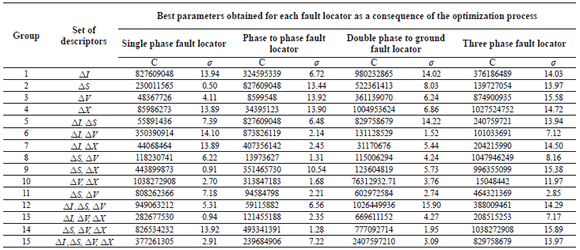
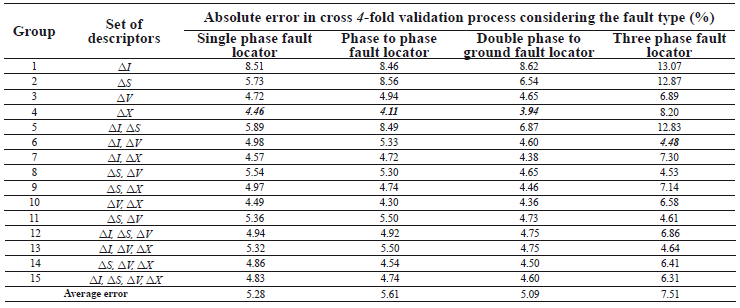
The value of e in all of the cases corresponds to the minimum possible value of 0.001. Having adjusted the SVM-r, using the parameters obtained for each fault locator, and considering each one of the sets of descriptors, the results of the absolute error in the distance estimation form the measurement node to the fault location. These are presented in Table 2.
Table 2. Errors in the distance estimation having configured the SVM-r using the parameters presented in Table 1
As presented in Table 1, the values obtained for the penalization constant C are considerably high. All of them are higher than 44 million in the case of the single phase fault locator; higher than 8 million in the case of the phase to phase fault locator; higher than 31 million in the case of double phase to ground fault locators, and finally, higher than 15 million in the case of the three phase fault locator. Considering the possible variations of C from 26 to 232, it can be noticed that the fault location is a complex problem, and consequently it is here strongly constrained and penalized.
In addition, the values obtained for the s parameter cover the entire interval of the possible variations (from 2-6 to 26). This shows that there are several kernel transformations which are useful to perform the regression in the fault location problem considered, and such a transformation parameter is strongly dependent on the set of descriptors used as inputs.
The last parameter included in the optimization procedure is related to the error function or tube radius. It always reaches the lower value of the interval of possible values of e (from 0.001 to 0.5). It is a logical consequence of the cross validation error defined as presented in (14). The definition of the error forces the optimization process to reduce the tube radius e to its minimal value, in order to obtain the maximum approximation in the regression function.
Additionally, the average value of the absolute error obtained in a 4-fold cross validation in the fault location process is 5.87 %. The minimal value of this error in the case of single phase fault location is 4.46 %, which is obtained by having the descriptor related to the variation of the reactance (DX) as inputs. The minimal value of the absolute 4-fold cross validation error in the case of the phase to phase and double phase to ground fault locators, is also obtained when the input is DX (4.11 % and 3.94 %, respectively). Finally, the minimal error in the case of the three phase fault locator is 4.84 % and it is obtained if a set of descriptors given by the variations of current DI and voltage DV are used.
5. CONCLUSIONS
According to the above results, the proposed hybrid approach, which combines a well-defined regression technique and an optimization technique, is useful to give a satisfactory solution to the fault location problem. Additionally, and considering that the absolute cross validation errors are related to the expected results, obtained with faults not used in the training of the fault locator, the performance presented here for the proposed fault locator is highly satisfactory.
Finally, the proposed fault locator helps to maintain the continuity indexes in power distribution systems, where the problem of fault location is not an easy task. These types of approaches are useful to help the power utilities to maintain high power quality standards.
ACKNOWLEDGMENTS
The authors would like to thank M. Álvarez-López and H. Salazar-Isaza from UTP, for their reviews of this paper.
REFERENCES
[1] IEEE Std 37.114. "IEEE Guide for Determining Fault Location on AC Transmission and Distribution Lines", Power System Relaying Committee 2004. [ Links ]
[2] Philipson L., Lee H. Understanding Electric Utilities and De-Regulations. CRC. 2 Edition. 520 pps. 2005. [ Links ]
[3] Mora-Flórez J., Morales G., Pérez-Londoño S. Learning-based strategy for reducing the multiple estimation problem of fault zone location in radial power Systems. IET Generation, Transmission & Distribution. Vol. 3, Issue 4, pp. 346-356. 2009. [ Links ]
[4] Ying-Hong L., Chih-Wen L. A new PMU-based fault detection/location technique for transmission lines with consideration of arcing fault discrimination. IEEE Transactions on Power Delivery, Vol. 19, Issue 4, pp:1594 - 1601. 2004 [ Links ]
[5] Lee J. Park B. Radojevie Z. A new two-terminal numerical algorithm for fault location, distance protection and arcing fault recognition. IEEE Transactions on Power Systems, Vol. 21, N. 3, 2006 pp:1460-1462. [ Links ]
[6] Silveira E., Pereira, C. Transmission Line Fault Location Using Two-Terminal Data Without Time Synchronization. IEEE Transactions on Power Systems, Vol. 22, Issue 1, 2007 pp:498 - 499 . [ Links ]
[7] Brahma S. Fault location scheme for a multi-terminal transmission line using synchronized voltage measurements; IEEE Transactions on Power Delivery, Vol. 20, Issue 2, 2005 pp:1325 - 1331. [ Links ]
[8] Mora-Florez J., Carrillo G., Meléndez J. Comparison of impedance based fault location methods for power distribution systems. Electric Power Systems Research. Vol. 28. 2008. pp. 657-666. [ Links ]
[9] Girgis A., Lubkeman D. "A fault location technique for rural distribution feeders," IEEE Transactions on Industry and Applications, vol. 26, no. 6, pp. 1170-1175, 1993. [ Links ]
[10] Aggarwal R., Aslan Y. "New concept in fault location for overhead distribution systems using superimposed components," IEE Proceedings. Gen., Trans. and Distrib., vol. 144, no. 3, pp. 309-316, 1997. [ Links ]
[11] Novosel D., Hart D., Myllymaki J., "System for locating faults and estimating fault resistance in distribution networks with tapped loads", 1998, no. US Patent 5,839,093. [ Links ]
[12] G. Morales, G. Carrillo, And J. Mora, "Selección de descriptores de tensión para localización de fallas en redes de distribución de energía," Revista Ingeniería, vol. 11, pp. 43-50, 2006. [ Links ]
[13] Purushothama G., Narendranath A. Ann applications in fault locators. International Journal of Electrical Power and Energy Systems. pp. 491-506. 2001 [ Links ]
[14] Mescal A., Al-Shaher A. Fault location in multi-ring distribution network using artificial neural network. Electric Power Systems Research, pp: 87-92. 2003 [ Links ]
[15] Mora-Flórez J., Carrillo G., Barrera B. Fault Location in Power Distribution Systems Using a Learning Algorithm for Multivariable Data Analysis. IEEE Transaction on Power Delivery, vol. 22, no. 3, 2007. [ Links ]
[16] Morales G.; Mora-Florez J.; Vargas H.; Elimination of Multiple Estimation for Fault Location in Radial Power Systems by Using Fundamental Single-End Measurements. IEEE Transactions on Power Delivery, Vol. 24, Issue 3, 2009. pp 1382 - 1389. [ Links ]
[17] Morales G., Mora-Florez J. Vargas H. k-NN based regression strategy used to estimate the fault distance in radial power systems. Revista Ingeniería UDEA, no.45, pp.100-108. 2008. [ Links ]
[18] Burges C. A tutorial on Support Vector Machines for Pattern Recognition. http://www.kernel-machines.org/. pp. 25-58. [ Links ]
[19] Bernhard S., Smola A. Learning with Kernels Support Vector Machines. The MIT Press, Cambridge. 2002. pp. 24-69. [ Links ]
[20] Eiben A., Smith J.. "Introduction to Evolutionary Computing (Natural Computing Series)". Springer Verlag Berlin Heidelberg, 2003, pp 37-69. [ Links ]
[21] Sivanandam S., Deepa S. Introduction to Genetic Algorithms. Springer Verlag Berlin Heidelberg, 2003. pp. 19-78. [ Links ]
[22] Habib T.; Inglada, J.; Mercier, G. Support Vector Reduction in SVM Algorithm for Abrupt Change Detection in Remote Sensing. IEEE Geoscience and Remote Sensing Letters. Vol. 6, Issue 3, 2009 pp: 606 - 610 [ Links ]
[23] Ribeiro B. Support vector machines for quality monitoring in a plastic injection molding process. IEEE Transactions on Systems, Man, and Cybernetics. Vol. 35, Issue 3, 2005. pp:401 - 410 [ Links ]
[24] Moser, G.; Serpico, S. Modeling the Error Statistics in Support Vector Regression of Surface Temperature From Infrared Data.; IEEE Geoscience and Remote Sensing Letters, Vol. 6, Issue 3, 2009. pp:448 - 452 [ Links ]
[25] Burt G.; Mcdonald J. King A. Intelligent on-line decision support for distribution system control and operation. IEEE Transactions on Power Systems, Vol. 10, Issue 4, 1995. pp:1820 - 1827 [ Links ]
[26] Ching-Lai H.; Crossley, P.; Watson, S. Building Knowledge for Substation-Based Decision Support Using Rough Sets. IEEE Transactions on Power Delivery, Vol. 22, Issue 3, 2007 pp:1372 - 1379. [ Links ]
[27] Azevedo F. Vale Z.; Oliveira P. A Decision-Support System Based on Particle Swarm Optimization for Multiperiod Hedging in Electricity Markets. IEEE Trans. on Power Systems, Vol. 22, N. 3, 2007 pp:995-1003 [ Links ]
[28] Mora-Florez J., Localización de Fallas en Sistemas de Distribución de Energía Eléctrica usando Métodos Basados en el Modelo y Métodos Basados en el Conocimiento, Tesis Doctoral. University of Girona, España. 2006 [ Links ]
[29] IEEE Distribution System Analysis Subcommittee. Radial Test Feeders. Standards Board. 1993. http://www.ewh.ieee.org/soc/pes/dsacom/testfeeders.html [ Links ]
[30] Dagenhart J. The 40- Ground-Fault Phenomenon. IEEE Transactions on Industry Applications, vol. 36, no. 1, pp 30-32, 2000. [ Links ]
[31] Mora-Florez J., Bedoya J., Melendez J., Extensive Events Database Development using ATP and Matlab to Fault Location in Power Distribution Systems. Transmission & Distribution Conference and Exposition: LA, 2006. [ Links ]


