Servicios Personalizados
Revista
Articulo
Indicadores
-
 Citado por SciELO
 -
 Accesos
Links relacionados
-
 Citado por Google
 -
 Similares en
SciELO
 -
 Similares en Google
Compartir
DYNA
versión impresa ISSN 0012-7353versión On-line ISSN 2346-2183
Dyna rev.fac.nac.minas v.78 n.170 Medellín dic. 2011
MODELING AND EXPERIMENTAL VALIDATION TO ESTIMATE THE ENERGY BALANCE FOR A POULTRY HOUSE WITH MISTING COOLING
MODELAMIENTO Y VALIDACIÓN EXPERIMENTAL PARA DETERMINAR UN BALANCE DE ENERGIA EN UN GALPON AVICOLA CON NEBULIZACIÓN INTERNA
JAIRO ALEXANDER OSORIO SARAZ
PhD. Profesor Facultad de Ciencias Agropecuarias, Universidad Nacional de Colombia, Sede Medellín aosorio@unal.edu.co
ILDA DE FÁTIMA FERREIRA TINÔCO
PhD. Profesora Departamento de Ingeniería Agrícola, Universidade Federal de Viçosa, Brazil, iftinoco@ufv.br
KELLER SULLIVAN OLIVEIRA ROCHA
Msc Ing. Agrícola, Departamento de Ingeniería Agrícola, Universidade Federal de Viçosa, Brazil keller.rocha@ufv.br
MARCIO ARÊDES MARTINS
PhD. Profesor Departamento de Ingeniería Agrícola, Universidade Federal de Viçosa, Brazil, aredes@ufv.br
MARCOS OLIVEIRA DE PAULA
PhD. Profesor Departamento de Ingeniería Rural, Universidad de Espírito Santo, Brazil, modep@cca.ufes.br
Received for review Febrero 24th, 2009, accepted March 1th, 2011, final version March, 7th, 2011
ABSTRACT: The aim of this study was to develop and validate a simplified steady state mathematical model to predict temperature distribution in a commercial poultry house equipped with a negative pressure ventilation system and internal misting. The model was validated with data obtained experimentally during the summer. For external temperature conditions of 26, 27, and 29 °C, the best combinations of energy generated by misting (qmisting), ventilation rate (V), global heat loss coefficient for the roof (Ut), and global heat loss coefficient for the wall (Upar) were encountered to maintain the majority of the installation with temperatures within the optimal thermal comfort range for the birds (24 to 29 °C).
KEYWORDS: evaporative cooling, thermal modeling, tunnel ventilation broiler house
RESUMEN: Este trabajo tuvo como objetivo desarrollar y validar un modelo matemático simplificado en estado permanente, para predecir la distribución de temperatura en un galpón avícola comercial, equipado con sistemas de ventilación de presión negativa y nebulización interna. El modelo fue validado a partir de datos experimentales obtenidos en condiciones de verano. Se encontró para condiciones con temperatura externas de 26, 27, e 29°C, las mejores combinaciones que debe tener el galpón, entre la energía generada por efecto de la nebulización (qmisting) y por la rata de ventilación (V), el coeficiente global de perdida de calor del techo (Ut) y el coeficiente global de perdida de calor de las paredes (Upar), que permitan mantener la mayor parte del galpón con temperaturas que se encuentren dentro de la faja de conforto térmico para las aves de que para temperaturas externas (24 a 29 °C).
PALABRAS CLAVE: resfriamiento evaporativo, modelo térmico, instalaciones avícolas modo túnel
1. INTRODUCTION
The importance of broiler chicken production in Brazil is growing both on a national and international scale, requiring more efficient and intensive production systems in terms of greater yields. Therefore, negative pressure tunnel ventilation buildings are becoming more utilized in tropical countries with the intent of achieving greater productivities.
One of the greatest concerns in poultry production is maintaining temperatures at permitted levels which do not surpass the upper limit of the thermal comfort range which should not exceed 29 °C, where the optimal temperature is 25 °C [1,2]. Therefore, some studies have been performed with the objective of producing models which predict chicken behavior in function of variables including temperature, humidity, and gas concentrations such as ammonia [3,4,5].
When ventilation fans in the poultry buildings are insufficient for diminishing internal temperatures below 29 °C, secondary or artificial modification are used, such as changing the thermal properties of the roofing material [6,7] or incorporating evaporative cooling systems by installation porous plates or cooling pads, or by misting [8,9].
Due to the importance of understanding distribution parameters such as temperature inside poultry buildings, some simple models have been proposed which provide the average temperature inside the installation, but not distribution throughout the building [10,11,12]. Other more complex methods have also been used based on computational fluid dynamics (CFD), which is capable of generating temperature distribution, velocity, humidity, and gas concentrations in a steady state and transient regimes at any point within the installation [2,13,14].
Therefore, the objective of this study was to develop a simplified mathematical model in steady state which allows for calculating the average temperature distribution along the length of a tunnel ventilation building with an adiabatic evaporative cooling system by misting.
2. MATERIAL AND METHODS
2.1 Operating conditions and experimental measurements
The modeled and simulated poultry house is located in the region of Rio Verde, Goiás, Brazil and is part of an integrated system of Perdigão Agroindústrias S/A, with a total of 22,700 male Cobb chickens per building, and a housing density of 14 birds per m2, being part of the experimental work performed by the reference [15]. The installation measures 126 m in length, 12.8 m in width, 3 m in height, a 0.5 m overhang, and a roof with a 25 % inclination. The installation presents two lateral air entrances (Fig. 1).
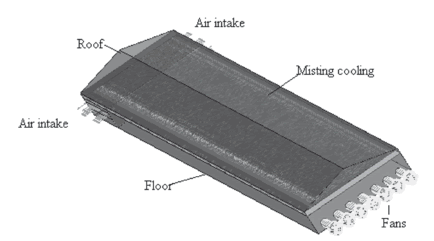
Figure 1. Diagram of the modeled and simulated poultry house
2.2. Thermal analysis
An energy balance was performed considering the following characteristics and adapting the methodology utilized by the references [16,17].
- negative pressure tunnel ventilation building with seven exhaust fans
- zinc roof
- homogeneous sprinkling at the roof height
- lateral air entrance has the same area as the exhaust area
- polyethylene lining
- permanent conditions
2.3 Validation of the model
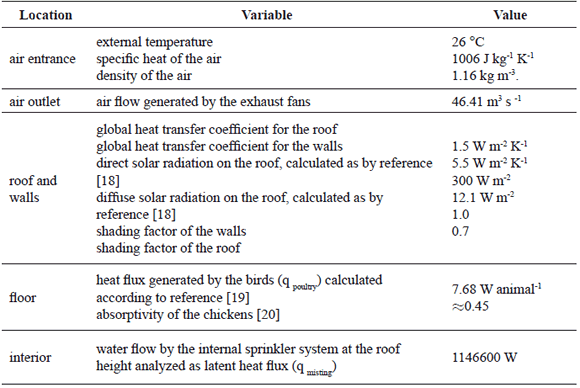
The variables measured in the experimental part were used to validate the data obtained by the mathematical method (Table 1). Values were registered with a HOBO HO8 datalogger with resolution of 0.5 °C and +/- 1 %, measured in 15 min intervals. Temperatures of the roof were measured with an ICEL model TD 95 infrared thermometer with a resolution of 1 °C and +/- 2 %. The data of the external environment (temperature, velocity, and wind direction) were obtained with a datalogger installed in a meteorological shelter 1.5 m from the ground. Solar radiation data was obtained from a regional meteorological station.
Table 1. Experimental variables utilized to validate the model
2.3.1 Statistical analysis
Results obtained by the mathematical model were verified and compared with the corresponding data obtained experimentally in the field for the negative pressure tunnel ventilation building. Concordance between the measured values and those reported by the model were evaluated, calculating the normalized mean square error (NMSE) according to ASTM (2002) [21,22]. A sample of 25 experimental measurements of all data collected at 10, 50, and 87 m from the air entrance was used. The normalized mean square error (NMSE) values less than 0.25 are accepted as good indicators of concordance.

where:

2.4 Computational model
A computational routine in Scilab 5.1.1 was developed to simulate the performance of the building based on variation of the parameters q Misting (500,000 to 1,400,000 W), UT (1 to 10 W m-2 K-1), UPar (0.5 to 5.0 W m-2 K-1), and V (10 to 100 m3 s -1), in function of the external temperature (26, 27, and 29 °C). The objective was to encounter an optimized method to calculate temperature distribution along the length of the installation (Fig. 2).
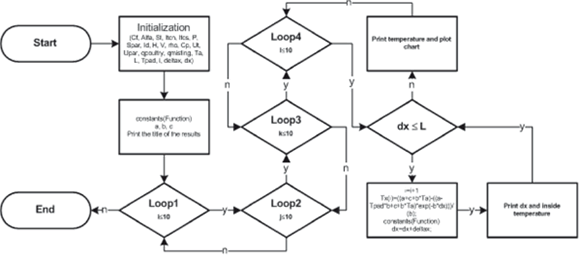
Figure 2. Flowchart representing a computational process for interior temperature distribution
3. RESULTS AND DISCUSSION
The thermal balance was developed considering that temperature inside the installation at a distance X from the lateral entrances is Tx. The temperature can be determined by estimating a differential element at the equilibrium dx (Fig. 3).

Figure 3. Differential element to function as a control volume
Considering the roof as symmetrical, total heat on the roof for a longitudinal element dx, without shade, is given by:

Considering shade, the total heat within a poultry house for a longitudinal element dx is given by:

where ST and SPar are shading factors (1.0 for no shading, and 0.0 for total shading). A part of the heat load within the element is absorbed by the birds and the rest is added to the sensitive heat flow of the element as:
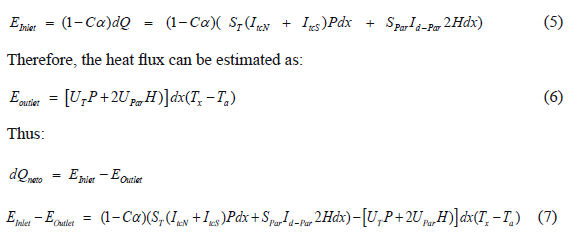
The heat flux is absorbed by the ventilation air and therefore the difference in temperature by the element is given by the relationship:
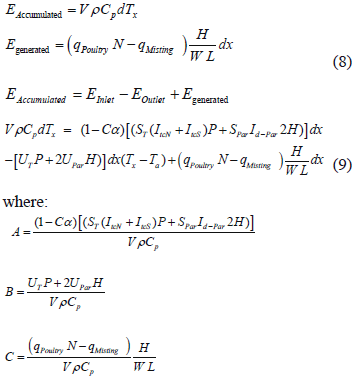
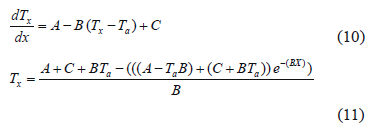
Therefore, from Eq. 9, a first order differential equation (Eq. 10) is derived and is solved to arrive at Eq. 11, which is used to determine the average temperature of the installation at any point X.
A comparison among the data shows that the average dry temperature (tbs) values do not significantly differ between those reported by the model and those collected experimentally. They present normalized mean square errors of 0.0011, 0.0018, and 0.0035 for the distances of 10, 50, and 87 meters, respectively; indicating a good correlation between the results (Table 2). It was therefore concluded that the proposed model can be used to predict temperature distribution behavior inside a poultry installation.
Table 2. Comparison of experimental data with temperature and efficiency data from the model

Figures 4, 5, and 6 present the best combinations of the variables qMisting, UT, UPar, and V for external temperatures of 26, 27, and 29 °C, respectively, within the thermal comfort range of 24 and 29 °C, at 25, 50, 75, and 100 % of the installation length (31, 63, 94, and 126 m). It can be observed for the lengths of 126 m (typical dimensions for commercial installations) that there is a wide range of the different variables which directly influence the internal temperature of the poultry building; this makes the best combination depending on other technical and economic variables, but the final decision can be supported by tools such as the proposed model. Among these technical factors, qmisting is very important since it can cause significant reductions in the internal temperatures; however, it may also cause greater humidities inside the installations which are not beneficial for the health and development of the birds.
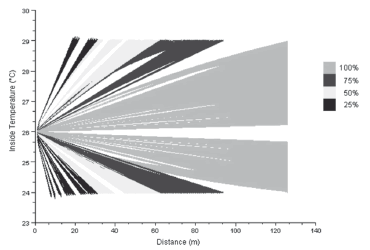
Figure 4. Distribution of internal temperature on installation behavior in function of combinations of qMisting, UT, UPar and V for an external temperature of 26°C
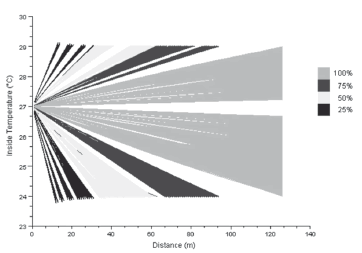
Figure 5. Distribution of internal temperature on installation behavior in function of combinations of qMisting, UT, UPar and V for an external temperature of 27°C
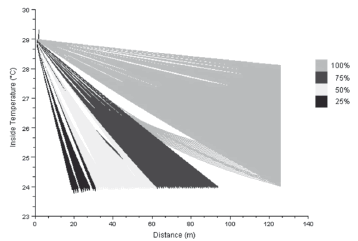
Figure 6. Distribution of internal temperature on installation behavior in function of combinations of qMisting, UT, UPar and V for an external temperature of 29°C
Given the ample range of combinations that can be presented to maintain the internal temperatures between 24 and 29 °C as presented in Figs. 4, 5, and 6, the amplitude of these ranges can be filtered by seeking the most desired internal temperatures.
Table 3 presents the best heat combinations generated by misting (qmisting), and ventilation rate (V), where the encountered internal temperatures were 24 and 26 °C (these temperatures being ideal for broiler chickens in the final week before slaughter) [7] for buildings measuring between 63-94 m and 94-126 m with the UT and Upar fixed at 1.0 W m-2 K-1 and 5.0 W m-2 K-1. In the same way new combinations can be obtained depending on the desired temperature within the installation.
Table 3. Intervals between the variables to obtain internal thermal comfort temperatures for different external temperatures

4. CONCLUSIONS
The results obtained with the energy balance model presented a good relationship with experimental data which permits us to conclude that the model is appropriate to improve broiler poultry buildings operating with negative pressure ventilation and internal misting. The model is also adequate for alterations in variables such as external temperature and material properties when aiming to obtain internal temperatures within the thermal comfort range for the birds.
This model can be used to perform initial dimensioning of tunnel ventilation poultry buildings, encountering suitable relations between building length and width in function of combinations of variables such as internal misting, external temperature, ventilation rate of the exhaust fans, diffuse and direct thermal radiation, the heat generated by the birds, and material thermal properties.
ACKNOWLEDGEMENTS
The authors would like to thank the Brazilian Government Agency FAPEMIG and the National Counsel of Technological and Scientific Development (CNPq, Brazil) for their financial support, and the National University of Colombia.
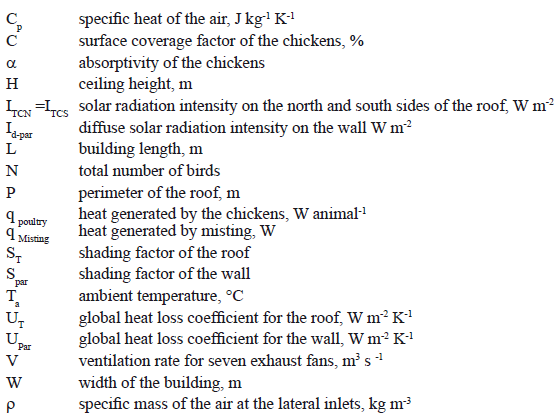
Nomenclature
REFERENCES
[1] Albright, L.D., Environment control for animals and plants. St. Joseph: ASAE, 1990. [ Links ]
[2] Osório J.A., Martins, M.A., Tinoco, I.F.F., Oliveira M., Zapata M O., Machado, N. S., Uso de modelos com CFD para simular a distribuição de temperaturas em aviários. In: X Congresso Argentino de Ingenieria Rural y II del MERCOSUR, 2009, Rosario Argentina. Anales del X Congresso Argentino de Ingenieria Rural y II del MERCOSUR. Rosario : Universidad del Rosario, 2009. [ Links ]
[3] Gates, R. S., Zhang, S. H., Colliver, D. G., Overthults, D. G. Regional Variation in temperature humidity index for poultry housing. Transactions of the ASAE, 38, pp. 197-205, 1995. [ Links ]
[4] Kristensen, H. H.; Burgess L, R.; Demmers, T. G.; Wathes, M. The preferences of laying hens for different concentrations of atmospheric ammonia. Applied Animal Behaviour Science, 68, 307-318, 2000. [ Links ]
[5] Severo, J. C. A., Yanagi Junior, T., Santos, S. N. M., Silva, J. P., Borges, G., Teixeira, V. H., Desenvolvimento de um software para predição do ambiente térmico no interior de galpões agropecuários. Revista Brasileira de Agroinformática, 5, pp. 59-72, 2003. [ Links ]
[6] Silva, I.J.O., Ghelfi, H., Consgliero, F.R. Materiais de cobertura para instalações animais. Engenharia Rural, Piracicaba, 1, pp. 51-60, 1990. [ Links ]
[7] Tinôco I.F.F., Avicultura industrial. Novos conceitos de materiais, concepções e técnicas construtivas disponíveis para galpões avícolas Brasileiros. Revista Brasilera de Ciência Avícola, 3, pp. 1-26, 2001. [ Links ]
[8] Sartor, V., Baêta, F. C., Luz, M. L., Orlando, R. C., Sistemas de resfriamento evaporativo e o desempenho de frangos de corte. Scientia Agricola, 58, pp.17-20, 2001. [ Links ]
[9] Welker, J.S., Rosa, A.P., Moura, D.J., Lizandra, M., Catelan, F., Uttpatel, R., Temperatura corporal de frangos de corte em diferentes sistemas de climatização. R. Bras. Zootec,.37, pp. 1463-1467, 2008. [ Links ]
[10] Timmons, M.B., Gates, R.S., Predictive model of laying hen performance to air temperature and evaporative cooling. Transactions of the ASAE, St. Joseph, 31, pp. 1503-1509, 1988. [ Links ]
[11] Olgun, M., Çelik M, Y., Polat, H. E., Determining of heat balance design criteria for laying hen houses under continental climate conditions. Building and Environment, 42, pp. 355-365, 2007. [ Links ]
[12] Silva, M. P., Baêta, F. C., Tinôco, I.F.F.; Zolnier, S., Ribeiro, E A., Evaluation of a simplified model for estimating energy balance in broilers production housing. Revista Brasileira de Engenharia Agrícola e Ambiental, 11, pp. 532-536, 2007. [ Links ]
[13] Norton, T., Sun, D.W. J., Grant, R., Fallon, E V. DODD., Applications of computational fluid dynamics (CFD) in the modelling and design of ventilation systems in the agricultural industry: A review. Bioresource Technology, 98, pp. 2386-2414, 2007. [ Links ]
[14] Blanes-Vidal, V., Guijarro, E., Balasche, S., Torres, A. G., Application of computational fluid dynamics to the prediction of airflow in a mechanically ventilated commercial poultry building. Biosystems Engineering, 100, pp.105-116, 2008. [ Links ]
[15] Machado Silva N.. Arrefecimento térmico de coberturas de aviários por aspersão, com vista ao uso de água chuva no centro oeste brasileiro.124 f. Tese (Doutorado em Engenharia Agrícola) Universidade Federal de Viçosa. 2007. [ Links ]
[16] Jain, D.E., Tiwari G.N., Modeling and optimal design of evaporative cooling system in controlled environment greenhouse. Energy Conversion and Management, 43, pp. 2235-2250, 2002. [ Links ]
[17] Ganguly, A., Ghosh, E S., Modeling and analysis of a fan-pad ventilated floricultural greenhouse. Energy and Buildings, 39, pp. 1092-1097, 2007. [ Links ]
[18] Cooper, K., Parsons, D. J., Demmers, T. A thermal balance model for livestock buildings for use in climate change studies. J. agric. Engng Res, 69, pp. 43-52, 1998. [ Links ]
[19] Pedersen, S., Thomsen M.G., Heat and moisture production of broilers kept on straw bedding. Journal of Agricultural Engineering Research, Silsoe, Bedford, 75, pp. 177- 187, 2000. [ Links ]
[20] Campbell, G., Norman, J., An introduction to environmental biophysics. Springer Verlag, New York, USA; 1998. [ Links ]
[21] ASTM. Guide for statistical evaluation of indoor air quality models (D5157-97). In ASTM Standards on Indoor Air quality, 2nd edition.. West Conshohocken, Pa.: American Society for Testing Materials; 68-71, 2002. [ Links ]
[22] Arêdes, M. M., Soares, O.L., Osorio S.J. Numerical study of apple cooling in tandem arrangement. Dyna, 78, pp. 188-196, 2011. [ Links ]


