


Services on Demand
Journal
Article
 English (pdf)
 Article in xml format
 Article references
 Send this article by e-mail
Indicators
-
 Cited by SciELO
 -
 Access statistics
Related links
-
 Cited by Google
 -
 Similars in
SciELO
Similars in
SciELO -
 Similars in Google
Share

 Permalink
DYNA
Print version ISSN 0012-7353On-line version ISSN 2346-2183
Dyna rev.fac.nac.minas vol.79 no.171 Medellín Jan./Feb. 2012
IDENTIFICATION OF FACTORS THAT AFFECT THE LOSS OF STUDENT STATUS USING A LOGIT SURVIVAL MODEL FOR DISCRETE TIME DATA
IDENTIFICACIÓN DE FACTORES QUE AFECTAN LA PÉRDIDA DE CALIDAD DE ESTUDIANTE USANDO UN MODELO DE SUPERVIVENCIA LOGIT PARA DATOS DE TIEMPO DISCRETOS
JUAN CARLOS SALAZAR URIBE
Ph.D., en Estadística, University of Kentucky, Escuela de Estadística, Universidad Nacional de Colombia, Medellín, cmlopera@unal.edu.co
CARLOS MARIO LOPERA GÓMEZ
M.Sc. en Estadística Escuela de Estadística, Universidad Nacional de Colombia, Medellín, cmlopera@unal.edu.co
MARIO CESAR JARAMILLO ELORZA
M.Sc. en Estadística, Escuela de Estadística, Universidad Nacional de Colombia, Medellín, mcjarami@unal.edu.co
Received for review November 12th, 2010, accepted March 23th, 2011, final version April, 4th, 2011
ABSTRACT: The phenomenon of loss of the student status due to low academic performance is a serious problem that affects the main universities of Colombia. Low performance is also related in a direct way to student dropout. This is why it is of fundamental importance to identify factors which can be associated with the student's loss of his/her status due to low academic performance. Based on information about academic performance collected at the National University of Colombia at Medellin, a survival analysis model for discrete time (based on the logit transformation in which the response variable under consideration was the probability for an individual of losing his/her student status for the first time in a determined time) was implemented. This model allowed us to identify and quantify the effect of socio-demographic variables related with the loss of the student status for the first time.
KEYWORDS: survival analysis, discrete-time model, odds ratio, academic performance
RESUMEN: El fenómeno de la pérdida de calidad de estudiante por bajo rendimiento académico es un problema serio que afecta las principales universidades del país. El bajo rendimiento académico también está relacionado de manera directa con la deserción estudiantil. Por lo tanto es de fundamental importancia identificar factores que pueden estar asociados con la pérdida de calidad de estudiante debida a bajo rendimiento académico. Con base en información sobre rendimiento académico recopilada en la Universidad Nacional de Colombia, Sede Medellín se implementó un modelo de análisis de supervivencia para tiempo discreto basado en la transformación logit donde la respuesta considerada fue la probabilidad que un individuo pierda la calidad de estudiante por primera vez en un tiempo determinado. Este modelo permitió identificar y cuantificar el efecto de variables de tipo socio-demográfico relacionadas con la pérdida de calidad de estudiante por primera vez.
PALABRAS CLAVE: análisis de supervivencia, modelo de tiempo discreto, razón de odds, rendimiento académico
1. INTRODUCTION
The models of survival analysis, for example, Cox's semiparametric model, are frequently used in many areas of research which include epidemiology, the medical, and the social sciences. These models have the advantage of considering the elapsed time until the occurrence of the event of interest, and furthermore, allowing one to incorporate information related with right censoring, which appears when the event does not occur during the time of observation [1-10].
In the literature, multiple studies have been reported in which factors associated with the time of the occurrence of an event of interest were identified. These models assume that the time elapsed until an event is a continuous-type random variable. However, to try to identify factors which possibly may be related to the probability of the occurrence of an event of interest at discrete time points (e.g., times of visits to the doctor, times of economic recession, academic periods in a university, etc.), this assumption of continuity may not fit into the reality. This is why models which take the time of occurrence of an event in discrete scale have been developed, for instance, the discrete-time survival models [11-13].
In the university environment, to carry out an analysis of the data about academic performance is common [14-16]. In these studies the main goal is to evaluate not only the performance in itself, but also to identify the causes or factors associated with it. In this problem, due to its characteristics, time can be treated in a discrete scale, since a student, during his/her time in the university, experiments breaks (mainly due to vacation times).
In the literature, other papers related with the implementation of models and statistical methods for analyzing academic performance can be found. For example, Correa and Lopera [17] discussed a technique based on life tables for modeling university student performance. Tovar and Salazar [18] illustrated a mixed linear model with a first order Markov structure using data on academic performance collected at the National University of Colombia at Medellin. On the other hand, Castaño et al. [19] applied duration models to analyze the factors associated with university student dropout and graduation.
In this paper, a logistic regression model for discrete time data [20] was fitted to identify some of the factors that affect the loss of the student status for the first time at the National University of Colombia at Medellin. The discrete model was used due to the way in which the academic periods in the university go by, and it is expected that this and future studies that could have the same direction might serve as a guide to both evaluate academic policies and to offer support for a better decision making process.
Section 2 briefly describes the dataset used for the application of the survival model for discrete data. The model used is detailed in Section 3. The findings are presented in Section 4. Finally, in Section 5, some conclusions are given.
2. DATA
A dataset collected at the National University of Colombia at Medellin during the years 2003 to 2008 is used, which contains information on socio-demographical and academic variables taken at the moment of a person's admission to the university, such as: gender, age, socio-economical strata, ranking in the admission exams, type of high school, type of admission, type of housing ownership, and the time from high school graduation to admission to the university. The dataset consisted of 12,546 students (Table 1).
Table 1. Socio-demographical and academic characteristics of the target population
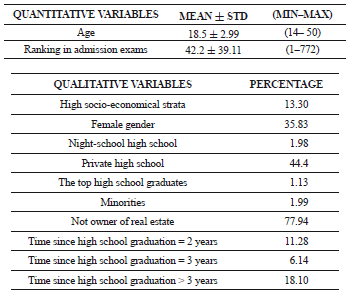
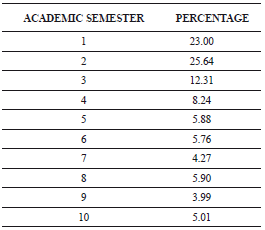
Table 2 shows the percentage distribution of students according to the number of completed semesters, until the cutoff in 2008.
Table 2. Percentage distribution of students by academic semester
Additionally, a semester-by-semester register of variables associated with academic performance is available, which allows us to establish the exact moment an individual looses student status for the first time.
The reasons for the loss of student status are mainly due to low academic performance, disciplinary measures, or for having successfully completed the cycle of studies of their respective degree programs. In this paper, attention is focused on the event of the loss of student status because of low academic performance, due to the fact that disciplinary measures are uncommon, and that, in the case of having completed the cycle of studies successfully, the event did not occur, and so this time is right censored (as defined in [2]).
3. MODEL
In the analysis of data about academic performance, it does not seem reasonable to assume that the time that passes until a person looses their student status for the first time would be continuous, since during the stay at the university there are interruptions which occur, for instance, during vacation times. This is why it is advisable to treat such a time on a discrete scale, where the semesters represent points in time, in which the event of interest occurs in a regular way.
This discrete time should not be modelled using the Cox model. Instead, it is better to use a logistic regression model which allows for one to estimate the conditional probability that a person, for example the i-th, may experience the event of interest at time t, given that the even has not occurred before t, where  (here, the
  s refer to the semesters a student has studied). This probability, usually denoted by
  , is related with the covariates by means of the following equation [20]:
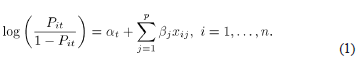
In this equation, the  intercept refers to the log-odds of the event at time t when all of the covariates are zero. An estimate of this intercept is obtained using the maximum likelihood method. It is important to notice that it is not possible to obtain an estimation of this time-dependent intercept by using Cox's partial likelihood.
Using a backward selection method, based on the maximum p-value, it is possible, from the set of available covariates, to identify those that are significantly associated with the log-odds of the event at time t.
This model permits one to quantify the size of the effect associated with each covariate by means of the following expression:
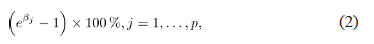
In this way, the size of the effect, depending on whether (2) it is positive or negative, indicates an increment or decrement, respectively, of the log-odds of the event at time t.
For the model adjusted with the significant covariates, the global goodness of fit test based on the likelihood ratio (LRT) is used, which is given by:
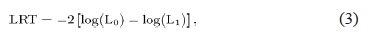
where L0 is the likelihood estimated under the model which only has an intercept and L1 is the likelihood estimated under the model which has not only the intercept but also all of the covariates.
The predictive power of the model is evaluated by means of the area under the receiver operating characteristic (ROC) curve, denoted by  , whose values vary between zero and one. High values of c correspond to strong associations among the observed and the predicted values [21].
4. RESULTS
Using some information collected from the Registrar and Admissions division of the National University of Colombia at Medellin, during the years 2003-2008, a statistical model was adjusted according with equation (1), in order to identify factors associated with the loss of student status for the first time.
Table 3 shows the significance of the effects of the covariates associated with the log-odds of losing student status for the first time in a determined semester, which were identified through the backward method based on the maximum p-value described in the previous section.
Table 3. Significance of the factors that affect the loss of student status
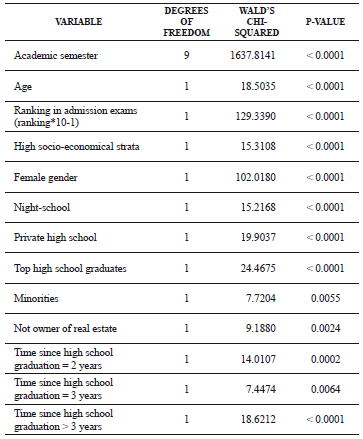
After implementing the model using the SAS LOGISTIC® procedure [22], the LRT goodness of fit test (3) and the area under the ROC curve were evaluated (LRT=3040.18 with an associated p-value < 0.0001 and a value for the area under the curve of e=0.729, respectively). These values indicate that the model presents both an adequate fit and good predictive power.
In relation to the fitted parameters, the academic semester variable is highly associated with the log-odds of losing the student status for the first time (p-value < 0,0001). According to this table, the covariates associated with the log-odds are age; ranking in the admission exams (where the value is divided by 10); gender (female or male), socio-economical strata (low, which includes strata 1, 2, and 3—and high, which includes strata 4, 5, and 6); type of high school (public, private, or night-school); type of admission (regular, top high school graduates, and minorities); type of property ownership (not owner of real estate, owner or paying rent); and time elapsed from high school graduation to admission to the university (less than 2 years, 2 years, 3 years, or more than 3 years).
The bold-written levels of the qualitative variables are the respective reference levels for those variables, so that the interpretations of the parameters associated with the other qualitative variable levels are always conducted in relation to the respective reference level. Table 4 shows the odds ratios and their respective 95 % confidence interval.
Table 4. Odds ratios for factors that affect the loss of student status
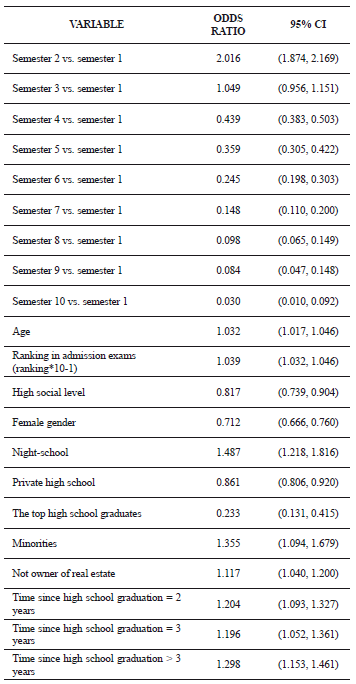
Observe that, for example using Eq. 2) to be in the 9th semester diminishes the odds of losing student status for the first time in 91.6 % ((0.084-1)x100%=-91.6%) when compared to the odds of losing student status for the first time in the first semester. A decreasing pattern of the odds of losing student status for the first time was observed from the second semester to the 10th semester (see Fig. 1).
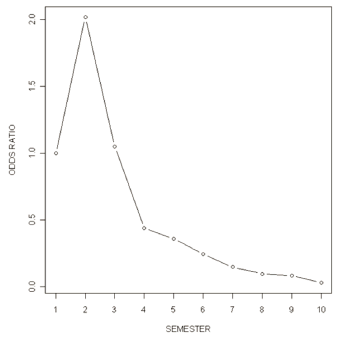
Figure 1. Odds ratio of losing the student status for the first time by semester
A similar analysis on the covariates, fixing an academic semester, indicates that (for example) to belong to a high socio-economical strata diminishes the odds of losing student status for the first time 18.3 %, compared to a low socio-economical strata student, keeping the values of the rest of the covariates fixed. This is interpreted as the partial effect of the socio-economical strata on the odds of losing student status for the first time.
Other important partial effects found with this model are:
- Being of female gender diminishes the odds 28.8 % in comparison to the male.
- Coming from a night-school increases the odds some 48.7 % in comparison to coming from a public school; while the odds diminish coming from a private school 13.9 %, in comparison to a public one.
- In terms of the type of admission, it is revealed that those who were admitted as the top high school graduates have 76.7 % smaller odds than in those who were admitted through regular admissions. On the other hand, those who were admitted through special programs for minorities have a 35.5 % increase on the odds when compared to regular admissions.
- Not having real estate increases the odds of losing the student status 11.7 % over students who either possess some property or pay rent.
- Letting 2 or 3 years pass before being admitted to the university, after graduating from high school, increases the odds approximately 20 %, and letting a greater time pass increases the odds up to 29.8 %. All of this is over those who are admitted before 2 years after graduating from high school.
5. CONCLUSIONS
As it may be observed in the results, there is a high degree of agreement between the odds ratios and what one would expect to happen according to the variables which ended up being significant. This is an argument in favor of using this kind of model, which are relatively easy to implement using standard statistical software, like SAS® or R. The model used has the advantage of allowing for one to quantify the size of the effect of the covariates by means of odds ratios.
Observed phenomena which were expected to occur were identified and quantified. For instance:
- The academic semester has a decreasing effect on the odds from the second semester. In other words, as a student advances to higher semesters (>2), the odds of losing student status decrease.
- Private high schools diminish the odds of losing student status, while those from night-school increase the odds, both of them in comparison to public schools. Perhaps this is mainly due to educational quality differences among these kinds of high schools.
- Special admission programs for minorities increase the odds of losing student status, over those who are admitted in a regular way. On the other hand, as it was supposed, the top high school graduates admission marks a clear difference in relation to those admitted in a regular way, substantially diminishing the odds of losing student status.
- The time elapsed from high school graduation to university admission has a growing effect on the odds. In other words, as an individual lets time pass by between high school graduation and enrollment into the university, the odds of losing student status for the first time increases when compared to those individuals who are admitted to the university within the first 2 years.
Other observed phenomena were the effect of gender, in which being a female diminishes the odds of losing student status for the first time (in comparison to males); and the effect of the type of housing ownership, in which there is an advantage with regard to losing student status when a person has his/her own housing, or is paying rent in comparison with those who do not live in such a situation.
As a future direction, we are planning to implement a similar analysis using data collected from the beginning of the Academic Reform stipulated in the 2007 Accord #033 of the High Council of the National University of Colombia. This will allow us to evaluate whether the conditions identified as causes of the loss of student status for the first time in this analysis still remain; or whether, on the contrary, new factors appear which influence the event.
ACKNOWLEDGEMENTS
The authors thank María Zuly Zuluaica of the Computing Center of the National University of Colombia at Medellin, who kindly provided the data to carry out this analysis. We also thank professor Juan Carlos Correa Morales of the School of Statistics of the National University of Colombia at Medellin, for his valuable comments which have enriched this manuscript. The project was sponsored with resources from DIME project #20101007954.
REFERENCES
[1] Cox, D. R., Regression Models and Life Tables (with Discussion), Journal of The Royal Statistical Society, Series B, 34, pp. 187-220, 1972. [ Links ]
[2] Woodward, M.W., Epidemiology: study design and data analysis. 2nd ed. Boca Raton (FL): Chapman and Hall/CRC Press, 2005. [ Links ]
[3] Hosmer jr, D.W. and Lemeshow S., Applied Survival Analysis: Regression Modeling of Time to Event Data, New York: John Wiley & Sons, 1999. [ Links ]
[4] Therneau, T.M. and Grambsch, P.M., Modeling survival data: extending the Cox model, New York: Springer-Verlag, 2000. [ Links ]
[5] Smith, T.C., Heller, J.M., Hooper, T.I., Gackstetter, G.D. and Gray, G.C., Are Gulf War veterans experiencing illness due to exposure to smoke from Kuwaiti oil well fires? Examination of Department of Defense hospitalization data, Amer J of Epidemiol, 155, pp. 908-17, 2002. [ Links ]
[6] Heckman, J.J. and Singer, B., Social Science Duration Analysis. In Longitudinal Studies of Labor Market Data, ed. J. J. Heckman and B. Singer, New York: Cambridge University Press, Chapter 2, 1985. [ Links ]
[7] Collett, D., Modelling Survival Data in Medical Research, London: Chapman & Hall, 1994. [ Links ]
[8] Prentice, R.L. and Gloeckler, L.A., Regression Analysis of Grouped Survival Data with Application to Breast Cancer Data, Biometrics, 34, pp. 57-67, 1978. [ Links ]
[9] Prentice, R.L. and Pike, R., Logistic Disease Incidence Models and Case-Control Studies, Biometrika, 66, pp. 403-411, 1979. [ Links ]
[10] Escobar, L.A., Villa, E.R., Yañez S., Confiabilidad: Historia del arte y desafios futuros, Revista Dyna, 70(140), pp. 5-21, 2003. [ Links ]
[11] Allison, P.D., Discrete-Time Methods for the Analysis of Event Histories, In Sociological Methodology 1982, ed. S. Leinhardt, San Francisco, CA: Jossey-Bass, 1982. [ Links ]
[12] Singer, J.D. and Willett, J.B., It's about time: Using discrete time survival analysis to study duration and the timing of events, Journal of Educational Statistics, 18, pp. 155-195, 1993. [ Links ]
[13] Teachman, J. Analyzing social processes: Life tables and proportional hazards models, Social Science Research, 12, pp. 263-301, 1983. [ Links ]
[14] Austin, J.T., Yaffee, R.A. and Hinkle, D.E., Logistic Regression for Research in Higher Education. In J. Smart (Ed). Higher Education: Handbook of Theory and Research VIII. New York, NY: Agathon Press, pp. 379-410, 1992. [ Links ]
[15] Willett, J.B. and Singer, J.D., How long did it take? Using survival analysis in educational and psychological research. In L. Collins & J. Horn (Eds.), Best methods for the analysis of change. Washington, DC: American Psychological Association, pp. 310-327 1991. [ Links ]
[16] Cossio, J., Tejada, D., Errores típicos en matemáticas de los estudiantes de primer semestre de universidad, Revista Dyna, 66(128), pp. 1-8, 1999. [ Links ]
[17] Correa, J.C. and Lopera, C.M., Uso de tablas de vida para la estimación de la mortalidad estudiantil. Caso Universidad Nacional de Colombia, Sede Medellín, Revista Universidad Eafit, 44(150), pp. 46-50, 2008. [ Links ]
[18] Tovar, R.J. and Salazar, J.C., Un modelo lineal mixto adaptado a una cadena de Markov con espacio de estados ordinal. Aplicación a datos sobre promedios académicos de estudiantes. Revista Colombiana de Estadística, 32(2), pp. 213-230, 2009. [ Links ]
[19] Castaño, E.A., Gallón, S., Gómez, K. and Vásquez, J., Análisis de los factores asociados a la deserción y graduación estudiantil universitaria, Lecturas de Economía, 65, pp. 9-36, 2006. [ Links ]
[20] Allison P.D., Survival analysis using the SAS system: a practical guide, Cary (NC): SAS Institute Inc., 1998. [ Links ]
[21] Hanley, J.A. and Mcneil, B.J., The Meaning and Use of the Area under a Receiver Operating Characteristic (ROC) Curve, Radiology, 143, pp. 29-36, 1982. [ Links ]
[22] SAS INSTITUTE, Inc. Logistic procedure. In Statistics user's guide (4th ed., Vol. 2, Ver. 6). Cary, NC: Author, 1990. [ Links ]

