Serviços Personalizados
Journal
Artigo
Indicadores
-
 Citado por SciELO
 -
 Acessos
Links relacionados
-
 Citado por Google
 -
 Similares em
SciELO
 -
 Similares em Google
Compartilhar
DYNA
versão impressa ISSN 0012-7353versão On-line ISSN 2346-2183
Dyna rev.fac.nac.minas v.79 n.171 Medellín jan./fev. 2012
WATER QUALITY INDEX BASED ON FUZZY LOGIC APPLIED TO THE ABURRA RIVER BASIN IN THE JURISDICTION OF THE METROPOLITAN AREA
UN ÍNDICE DE CALIDAD DE AGUA BASADO EN LÓGICA DIFUSA, APLICADO A LA CUENCA HIDROGRÁFICA DEL RÍO ABURRÁ, EN LA JURISDICCIÓN DEL ÁREA METROPOLITANA
JUAN D. GONZÁLEZ H
Ingeniero Civil, Universidad Nacional de Colombia, jdgonzalh@bt.unal.edu.co
LUIS F. CARVAJAL S
Magister en Recursos Hidráulicos, Profesor Asociado, Universidad Nacional de Colombia, Sede Medellín, lfcarvaj@bt.unal.edu.co
FRANCISCO M. TORO B
Ph.D., Profesor Titular, Universidad Nacional de Colombia, Sede Medellín, fmtoro@unal.edu.co
Received for review: November 17th, 2010; accepted: March 31st, 2011; final version: April 13th, 2011
ABSTRACT: The inherent uncertainties, subjectivity, and engineering challenges in environmental problems are increasingly being worked upon computing methods based on artificial intelligence (AI), including computerized tools that allow an analyst to use approximate reasoning with incomplete and inaccurate information and with the support of an expert in the field. In order to evaluate the applicability of this tool, this paper presents the development of a new water quality index based on fuzzy logic called the "fuzzy water quality index" (FWQI). This index is compared to the NSF water quality index (NSFWQI) and with the water quality index (ARWQI) obtained for the project "Red Río Fase I" for the Medellin metropolitan area environmental authority. The new FWQI provided reasonable correlations and results in comparison to the other two reference indexes. Finally, the FWQI could be used as a decision maker in the water management of Aburra River.
KEYWORDS: water quality indices (WQIs), fuzzy-logic, fuzzy inference system, bioindicators
RESUMEN: Las incertidumbres, las subjetividades y los grandes retos ingenieriles en los problemas ambientales se trabajan cada vez más con el uso de métodos de cálculo basados en la Inteligencia Artificial (IA), incluyendo herramientas computarizadas que permiten usar razonamientos aproximados con información incompleta e inexacta y con el apoyo de expertos. Con el fin de evaluar la aplicabilidad de esta herramienta, este estudio propone la aplicación de un Índice de Calidad del Agua, basado en la Lógica Difusa denominado "Índice de Calidad de Agua Difuso" (FQWI), en el río Aburrá. EL FQWI se comparó con el Índice de Calidad de Agua NSF (NSFWQI y con el Índice de Calidad de Agua elaborado para el proyecto "Red Río Fase I" (ARWQI) ) para la autoridad ambiental del Área Metropolitana de Medellín. Este nuevo índice (FQWI) presentó resultados y correlaciones razonables, con relación a los otros índices propuestos. Finalmente, se espera que este nuevo índice FQWI pueda ser utilizado para la toma de decisiones en la gestión hídrica del río Aburrá.
PALABRAS CLAVE: índices de calidad de agua, lógica difusa, sistema de inferencia difuso, bioindicadores
1. INTRODUCTION
The urban development of the Aburra River Valley has increased the levels of water pollution in the Aburra River in such a way that the use of water as a source for various human activities and as a recipient of waste water has promoted the study and development of water quality indicators. As a contribution to this development, the aim of this paper is to compare three different water quality indices (WQIs) and to analyze the spatial and temporal variability of Aburra River water quality in the jurisdiction of the Aburra River Metropolitan Area.
A water quality index allows the analyst to combine information from different water quality parameters into a single value for a better interpretation. The main objective of these indices is to evaluate the general state of water, depending on a range of a group of established water quality parameters. Additionally, the information that they provide can easily be interpreted from a list of numerical values and be useful in taking decisions for environmental analysis and for compliance with environmental regulations.
The limitations of WQIs demonstrate the need to develop techniques and more advanced assessment methods which enable the analyst to include and interpret qualitative and quantitative information. The methods based on Artificial Intelligence (AI) can combine the advantages of the traditional methods with the advantages provided by the AI.
In this paper, the FWQI [1,2,3] is estimated along the Aburra River for different sampling campaigns from 2004 to 2007. The results are compared with water quality indices of the U.S. National Sanitation Foundation (NSFWQI) and the water quality index estimated in the study of the Aburra River Phase I (ARWQI) [4].
2. STUDY ZONE
The Aburra River Valley area includes the following municipalities in the province of Antioquia, Colombia: Caldas, La Estrella, Sabaneta, Envigado, Itagüi, Medellin, Bello, Copacabana, Girardota, and Barbosa (Fig. 1). The Aburra Valley covers an area of 1,152 Km2, with an urban area of 176.1 Km2 with a population density of 14,214 inhabitants/Km2 and a rural area of 975.9 Km2 with a population density of 191 inhabitants/Km2. The Aburra River runs 105 Km along the valley, beginning in the Alto de San Miguel and flowing into the Nechi River.
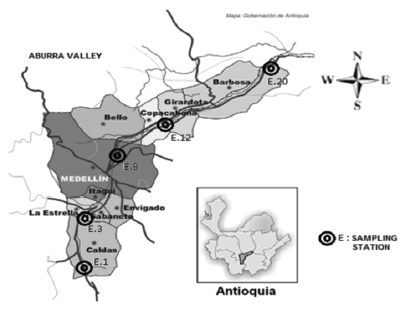
Figure 1. Location of Aburra River valley
Industry and services are the dominant economic activities in the urban area, whilst family agriculture is the main economic activity in the rural area.
The climate is a typical equatorial mountain system, with a mean annual temperature of 22 ºC, and a bimodal rainfall regime with an annual average of 1500 mm.
The water in the area is used primarily for domestic activities, followed by industrial activity. The pollution is mainly generated by the dumping of solid, sewage, industrial, and domestic wastes [5].
Information of water quality in five sampling stations along the main channel were used in this study (see Fig. 1 and Table 1) and were obtained from previous studies conducted between 2004 and 2007 [4].
Table 1. Location of monitoring stations

3. WATER QUALITY INDEXES
The problem of understanding WQIs lies primarily in the definition of the concept of water quality. Water quality can be understood as the intrinsic capacity of a water body to respond to the use external agents make of it so a balance with the ecosystem is obtained, satisfying some water quality standards. This definition helps analysts to have a clearer idea of a balanced ecosystem in which water carries out certain quality objectives and different indexes measuring them. The indexes have the advantage of being easy to use and provide a quick and intuitive idea of the water quality. The use of more than one index allows analysts to have a more comprehensive idea about water quality.
In the construction of an index it is required to define the variables and weights according to the parameters established by current regulations. In the Colombian case, the evaluation of watersheds for the protection of flora and fauna is ruled by Decree 1594/84 of the Ministry of Health. This decree regulates dumping in relation to the natural water potential uses [5,6].
3.1 The National Sanitation Foundation index (NSFWQI)
In the United States, the National Sanitation Foundation (NSF), developed the NSFWQI in 1970 through the use of the Delphi survey technique of the Rand Corporation. This index has the characteristic of being a multiparameter index based on three studies. The first study adopted 35 pollution variables and included the opinion of recognized experts in the field. The second study recognized nine variables identified as the most important ones like dissolved oxygen (DO), fecal coliform, pH, biochemical oxygen demand (BOD5), nitrate, phosphate, turbidity and total solids (TS). Finally, the third study [7] developed a series of rating curves for each variable under analysis.
To calculate this WQI, a weighted arithmetic average is used:

Where:
NSF WQI: NSF Water Quality Index
SIi: curve function value "q".
Wi: weighting factor for the subscript i
The result of the application of this index is a number between 0, poor water quality and, 100, excellent water quality [8].
3.2 The ARWQI index
ARWQI index [4] aims to estimate a value between 0 and 1 that defines the quality level of the water body, the value of one being an index of very good water quality (low pollution).
According to the results obtained in the different samples taken during the Aburra River Project Phase I [4], the selected parameters of water quality along the river were: DO, BOD5, TS, total fixed solid (TFS), total suspended solids (TSS), electrical conductivity (EC), total nitrogen (TN), total phosphorus (TP) and aquatic macro-invertebrates (MI). These variables were gathered in five groups, namely: group 1, DO and BOD5; Group 2 consists of TN and TP; Group 3 includes only EC; group 4 includes TS, TFS and TSS; and group 5 includes only MI.
The description of the MI parameter is defined by assigning a fixed value in each category as follows: to the first category, which includes the stations that presented the best water quality conditions a value of 1.0 was assigned; in the second category, stations with good water quality to moderately contaminated waters where grouped with a value of 0.7; the third category included stations with moderately polluted waters to heavily contaminated with a value of 0.45; and the fourth category represents highly polluted waters with a value of 0.15. In this study, this grading criterion is established according to the degree of water saprophyte and pollution [9]. Additionally, weighting factors were defined for every group under consideration, which assigned the highest value to the most influential variable along the river. The maximum sum of the weighting factors is 10 corresponding to the highest index and indicates the best water quality in the channel. In this way, five weighting factors are assigned and these are represented by the letters A, B, C, D, and E, which have values of 3.0, 2.0, 2.0, 1.5, and 1.5 respectively, in relation to the river water quality [4].
The ARWQI is the addition over all groups of the multiplication of the values of each group of variables and their respective weighting factor, as is shown in the following expression:

3.3 Fuzzy Logic water quality index (FWQI)
The fuzzy logic methodology allows an analyst to use a set of qualitative conditional expressions and to increase the initial awareness, through processes of inference or "learning". The integration of fuzzy logic and fuzzy inference systems [1-3,10-14] to the variables of environmental monitoring require a conceptual change. The fuzzy sets were defined in terms of a membership function that represents the shape of the fuzzy sets that divide the universe of each linguistic variable, which in turn is assigned a domain of interest for the interval [0,1], (m: X → [0,1]). Figure 2 shows the membership functions used in this study.
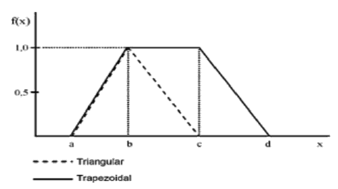
Figure 2. Membership function in trapezoidal and triangular shape
For this study the following linguistic variables and groups were defined: Group 1: Temperature (T) and pH; Group 2: DO and BOD5; Group 3: MI; Group 4: TN and TP; Group 5: TS and Turbidity. The linguistic values defined were: More than excellent (VE), Excellent (E), Very Good (VG), Good (G), Fair/Good (FG), Average (R), Average/Bad (RB), Poor (P) and Very Poor (VP).
Tables 3 and 4 shows the physicochemical and biological parameters taken into account in the study, with their input fuzzy sets, and following the membership functions or curves described above. Figure 3 shows the flow chart of the process, where individual quality variables are processed by inference systems producing several groups normalized between 0 and 100. The groups are then processed (step 2) using a new inference, the parameters are normalized and grouped by the fuzzy inference systems using the fuzzy sets in Fig. 4 and as a result the FWQI is obtained[1].
Table 3. Fuzzy sets and linguistic terms for input parameters. Groups 01, 02, and 03
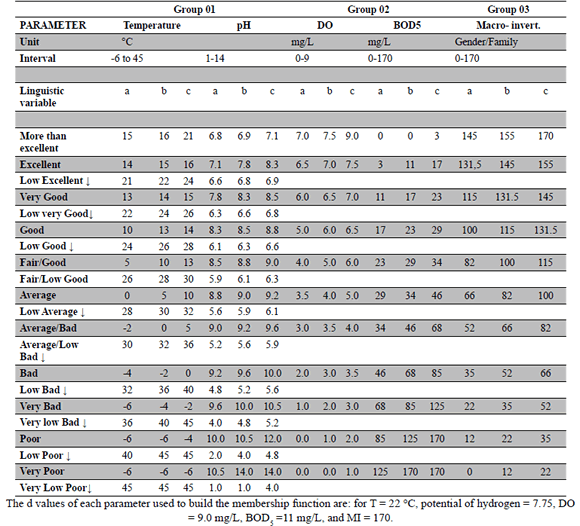
Table 4. Fuzzy sets and linguistic terms for input parameters. Groups 04 and 05 and output parameters for all groups.
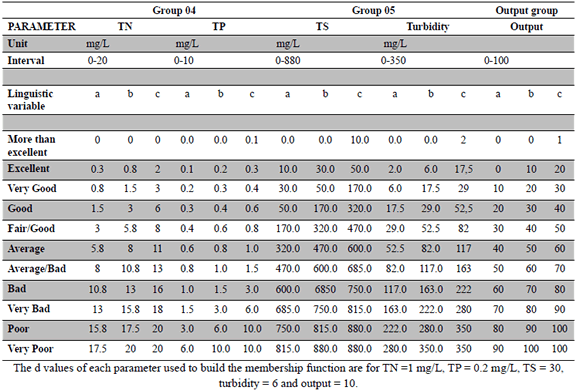
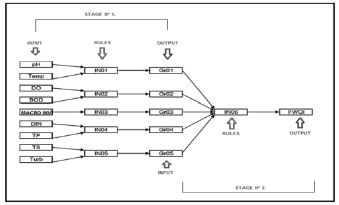
Figure 3. Graphic flow of process
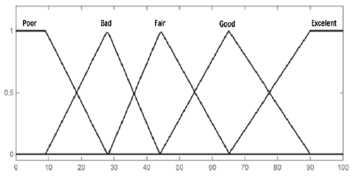
Figure 4. Graphs of the Fuzzy sets functions
A rule in the inference system is a mathematical formalism which expresses the opinion of experts in linguistic and therefore is an important factor in the subjective and qualitative inference block, for example: Rule 1: If fecal coliforms are high and the pH is excellent then the index is very poor, Rule 2: If fecal coliforms are very high and the pH is average then the index is poor. These rules are designed by an expert system and a subjective and qualitative weighting factor based on expert of the field's opinion is introduced in the process.
The rules for standardization and aggregation of the logic used in this work are described below (Step 1) and, therefore, always operate under requirement of a minimum operator: If the first parameter (FP) is More than excellent (VE) and the second parameter (SP) is More than Excellent (VE) then the output group (OG) is More than excellent (VE). There are 804 inference rules for this case.
The FWQI was developed from the fuzzy inference rules that were applied to groups 1 to 5 as input. The input sets or history (groups 01-05) and all consequential or output groups were created as trapezoidal functions for all excellent and as a triangular function for the other qualifications, as shown in Table 2.
Table 2. Output Fuzzy sets for step 2
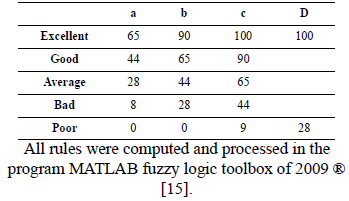
In this paper, 3125 fuzzy inference rules were developed for Step 2, and as an example we
present the following: Rule 1: If Gr01 to Gr05
are E, then FWQI is E; Rule 1250: if GR01 is G,
Gr02 is P, Gr03 is P, Gr04 is P and Gr05 is P,
then FWQI is B; Rule 2630: IfGr01 is P, Gr02 is G, Gr03 is E, Gr04 is E and Gr05 is P, then FWQI is R. Above, Gr0n refers to Group n.
All rules were computed and processed in the program MATLAB fuzzy logic toolbox of 2009 ® [15].
The d values of each parameter used to build the membership function are: for T = 22 °C, potential of hydrogen = 7.75, DO = 9.0 mg/L, BOD5 =11 mg/L, and MI = 170.
The d values of each parameter used to build the membership function are for TN =1 mg/L, TP = 0.2 mg/L, TS = 30, turbidity = 6 and output = 10.
4. RESULTS
This study used the results of physicochemical and biological parameters collected between 2004 and 2007 in five sampling stations [4]. Figure 5 shows the results obtained from the ARWQI, FWQI and NSFWQI indexes and their spatial and temporal variability in the different measuring campaigns conducted by the Medellin Metropolitan Area environmental authority in partnership with the universities of the city. Figures 6 and 7, present the relationship between FWQI and the other two indexes and Fig. 8 presents bar charts for the three indices calculated at 5 stations along the Aburra River.
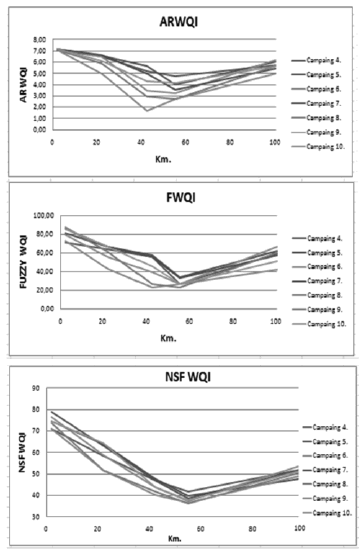
Figure 5. WQI's Spacial-temporal variability
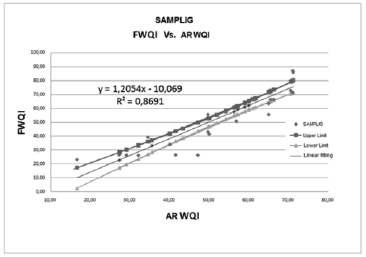
Figure 6. Linear relationship FWQI vs. ARWQI
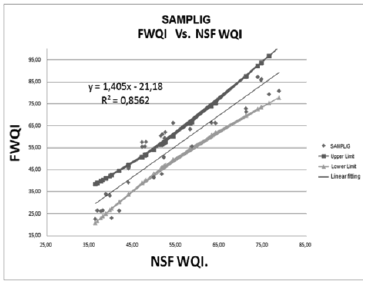
Figure 7. Linear relationship FWQI vs. NSFWQI
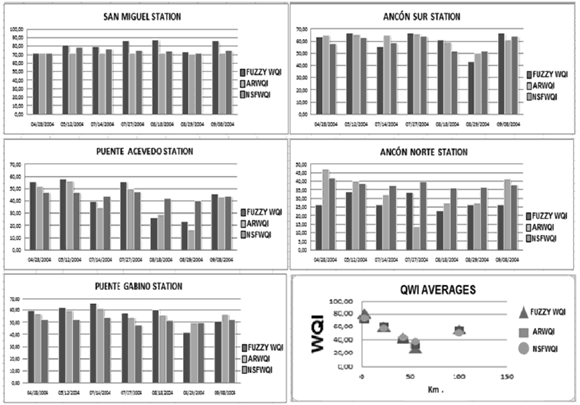
Figure 8. Bar diagrams of results and comparison among indices
5. ANALYSIS OF THE RESULTS
From Figure 5 it is clear that the three indexes show the same tendency (notice that the scale for the ARWQI index is 10 times smaller than that for the other two indexes). In San Miguel Station (Km 0) all indexes show good water quality with values between 70 and 90. Downstream and throughout the urban area, water quality decreases to a minimum at Ancon Norte Station, Km 55, with values from 20 to 50. Farther downstream, the river showed an improvement in the water quality due to the dilution effect of the water discharges from "La Tasajera" Hydroelectric power plant and the re-aeration of the river reaching values from 50 to 60 at Puente Gabino Station (Km 100). The results showed that the FWQI is stricter than the NSFWQI and ARWQI.
Figures 6 and 7 show the linear relationship between FWQI and the other two indexes. Both figures show a good linear relationship with coefficients of determination of 0.87 and 0.86, respectively, with most data falling inside the 95 % confidence interval. The FWQI can be calculated using this statistic relationship with the NSFWQI or the ARWQI as predictors.
Figure 8 shows the behavior of the three indexes at every station and for all measuring campaigns. A low variability of all three WQIs is noticeable in San Miguel Station and for all campaigns, showing values of good water quality with the FWQI index presenting the highest values. Except for the first campaign, the FWQI calculates higher values than the NSFWQI and ARWQI. In our case, FWQI includes macro-invertebrates, which improves the qualification meaning of this index.
Listen
Read phonetically
Figure 8 also shows that downstream San Miguel Station and from Ancon Sur station to Ancon Norte station , which is the river branch that covers the urban area, the indexes show a relatively high variability considering the sampling campaigns, variability associated with the rainy-dry seasons and sewerage discharges. In general, all indexes show a better behavior during the winter season (April to May and October to December), taking into account the annual hydrologic cycle. At Puente Gabino station, the station in the downstream end of the domain, the indexes show low variability and slight recovery from the Ancon Norte station, the last station of the urban area.
The average value of each index at all stations shows similar values. The Ancon Norte station shows the lowest value and clearly shows the influence of sanitary discharges and contaminated urban streams that go into to the Aburra River.
6. CONCLUSIONS
The FWQI Index combines individual physico-chemical and biological variables, with the help of expert knowledge and rules of inference, to provide information about the real status of river water quality. Additionally, this index can be implemented to monitor water bodies. Furthermore, the FWQI provides essential support to environmental authorities in order to implement corrective measures and adjustments to the river environmental assessments because this index is more demanding, which implies to be stricter. This is a valuable aspect when environmental authority wants to recover a water stream.
Specifically from this study, it was found that the river branch from Puente Acevedo station to Ancon Norte station presents the highest level of deterioration of water quality, a result which can be explained by a deficiency in the sanitary infrastructure of the zone, providing a corridor of high water pollution levels that affects the population settled on both sides of the river.
The average of the three WQIs in each sampling station show that the FWQI is the strictest, one followed by ARWQI and NSFWQI, being the last one the most tolerant. General results show similarity on the three indexes in the sampling stations Ancon Sur, Puente Acevedo and Puente Gabino; in stations as San Miguel and Ancon Norte the variability of the three indexes is very low.
Estimation of a WQI based on physical-chemical parameters and bioindicators depends on budget limitations and on the scope of the monitoring campaign. The FWQI requires more sampling and more calculations than the ARQWI and NSFWQI. If the FWQI is taken as reference index, then the objectives of a study should be more demanding, for example, not just to recover the water body, but also to recover the aquatic ecosystem.
ACKNOWLEDGEMENTS
The authors express their special thanks to Área Metropolitana del Valle de Aburrá for the support to carry out this investigation through a contract of agreement between Universidad de Antioquia, Universidad Nacional de Colombia, Universidad de Medellín and Universidad Pontificia Bolivariana.
REFERENCES
[1] Lermontov, A., Yokoyama, L., Lermotov, M. and Soares Machado, M., River quality analysis using fuzzy water quality index: Ribeira do Iguape river watershed Brazil. Ecological Indicators, 9, pp. 1188-1197, 2009. [ Links ]
[2] Yilmaz, I., Fuzzy evaluation of water quality clasification. Ecological Indicators, 7, pp. 710-718, 2007. [ Links ]
[3] Duque-Ocampo, W., Ferre-Huguet, N., Domingo, J. L. and Schuhmacher, M., Assessing water quality in rivers with fuzzy logic inference systems: A case study. Environmental International, 32, pp. 733-742, 2006. [ Links ]
[4] AMVA-UdeA, UNAL, UdeM, UPB. Diseño y Puesta en Marcha de la Red de Monitoreo Ambiental en la Cuenca Hidrográfica del Río Medellín en Jurisdicción del Área Metropolitana" Fase 1. Convenio 366/2003 Calidad de las aguas del río Medellín y sus principales afluentes. Medellín, Área Metropolitana, December de 2004. [ Links ]
[5] Valencia Monsalve, A., Evaluación del efecto ambiental del sistema de Alcantarillado en la calidad del río Medellín - Aburrá, en el tramo 2: Primavera - Puente Machado. Universidad Nacional de Colombia [Master thesis]. Medellín, Universidad Nacional de Colombia, 2009. [ Links ]
[6] MINISTERIO DE AGRICULTURA, REPÚBLICA DE COLOMBIA. Uso del Agua y residuos Líquidos. Decreto 1594 del 26 de junio 1984. [ Links ]
[7] CONESA FERNANDES, V. Guía Metodológica para la Evaluación del Impacto Ambiental. Anexo 3. Estudio de factores medioambientales, 3rd edition Ed. Mundi Prensa, Madrid España, 1997. [ Links ]
[8] Fernandez, N. Análisis comparativo de los índices de calidad de agua (ICA's) y de los índices de contaminación (ICO's) del agua - Chapters II and III". Universidad de Pamplona, Colombia, 2007. [ Links ]
[9] Alba-Tercedor, Javier., Macro invertebrados acuáticos y calidad de las aguas de los ríos. Departamento de Biología Animal y Ecología, Universidad de Granada, Almería 1996. [ Links ]
[10] Lion, Y. and Lo, S., A fuzzy index model for trophic status evaluation of reservoir waters. Water Research, 39, pp. 1415-1423, 2005. [ Links ]
[11] Silvert, W., Fuzzy indices of environmental conditions. Ecological modeling, 130, pp. 111-119, 2000. [ Links ]
[12] Lion, S.M., Lo, S.L. and Hu, C.Y. Application of two-stage Fuzzy set theory to river quality evaluation in Taiwan. Water Research, 37, 1406-1416, 2003. [ Links ]
[13] Galindo Gómez, J. Conjuntos y Sistemas Difusos (Lógica Difusa y Aplicaciones), Control Difuso, Metodología de Diseño, Estructura, Controladores Adaptativos (Ajuste) y ejemplos. Departamento de Lenguajes y Ciencias de la Computación Universidad de Málaga, 1999. [ Links ]
[14] Duque, M., Giraldo, E., Martínez, A., Gauthier, Alain., y Villa, J. L. El uso de la lógica difusa para la potabilización del agua. Universidad de Los Andes, Facultad de Ingeniería, 2000. [ Links ]
[15] Fuzzy Logic ToolboxT 2User's Guide-The MathWorks products are protected by one or more U.S. March 2009, Online only Revised for Version 2.2.9 (Release 2009a). [ Links ]


