Serviços Personalizados
Journal
Artigo
Indicadores
-
 Citado por SciELO
 -
 Acessos
Links relacionados
-
 Citado por Google
 -
 Similares em
SciELO
 -
 Similares em Google
Compartilhar
DYNA
versão impressa ISSN 0012-7353
Dyna rev.fac.nac.minas vol.79 no.174 Medellín jul./ago. 2012
DEFORMATION ANALYSIS OF CONCRETE WALLS UNDER SHAKING TABLE EXCITATIONS
ANÁLISIS DE DEFORMACIÓN DE MUROS DE CONCRETO BAJO EXCITACIONES DE MESA VIBRATORIA
JULIAN CARRILLO
Ph D. Research Professor, Department of Civil Engineering, Universidad Militar Nueva Granada, UMNG, Bogotá, Colombia, wjcarrillo@gmail.com
SERGIO M. ALCOCER
Ph D. Research Professor, Instituto de Ingeniería, Universidad Nacional Autónoma de México, UNAM, México, DF, salcocerm@i.unam.mx
GIOVANNI GONZÁLEZ
Esp. Research Professor, Department of Civil Engineering, Universidad Militar Nueva Granada, Bogotá, Colombia, gonzalez.giovanni@gmail.com
Received for review December 22th, 2011, accepted June 21th, 2012, final version June, 28th, 2012
ABSTRACT: Deformation analysis of structural elements is a valuable tool for researching the relationship of lateral force versus shear, sliding and flexural deformations, to assess the strength mechanism of failure mode, to assign suitable values of lateral stiffness, to estimate the contribution of steel reinforcement to strength and displacement capacities, to calibrate analytical models, and to propose appropriate parameters for performance-based seismic design. An experimental and analytical study was conducted to assess the components of deformation of low-rise reinforced concrete walls. The experimental program included shaking table tests of 6 low-rise concrete walls. The method and the instrumentation schemes to allow accurate assessment of the three components of deformations for squat walls and walls with openings are proposed. It was found that the proposed method produce consistent results for the tests evaluated.
KEYWORDS: shear, sliding, flexure, concrete walls, performance-based seismic design, shaking table tests
RESUMEN: El análisis de deformación de elementos estructurales es una herramienta indispensable para investigar la relación fuerza lateral versus deformaciones de cortante, deslizamiento y flexión; evaluar el mecanismo de resistencia del modo de falla, asignar valores adecuados de rigidez lateral, estimar la contribución del acero de refuerzo a las capacidades de resistencia y desplazamiento, calibrar modelos analíticos y, para proponer parámetros apropiados para diseño sísmico basado en desempeño. Para evaluar los componentes de deformación de muros de concreto de baja altura, se llevó a cabo un estudio experimental y analítico. El programa experimental incluyó el ensayo en mesa vibratoria de seis muros de concreto de baja altura. Se recomienda el método y los esquemas de instrumentación que permiten la evaluación adecuada de los tres componentes de deformación de muros cuadrados y con aberturas. Se encontró que el método propuesto produce resultados que son consistentes con los ensayos evaluados.
PALABRAS CLAVE: cortante, deslizamiento, flexión, muro de concreto, diseño sísmico basado en desempeño, ensayos en mesa vibratoria
1. INTRODUCTION
Reinforced concrete (RC) walls are commonly used to provide lateral strength in structures subjected to earthquake loads. Due to its in-plane lateral stiffness, RC walls are also used to maintain the lateral displacement within rational limits. Reinforced concrete walls are employed in several types of buildings and can be divided into three groups according to aspect ratio (hw/lw, height/length). When hw/lw is higher than 2, it is called a high-rise wall, which is dominated by flexure. When hw/lw is lower than 1, it is called a low-rise or squat wall, which is dominated by shear. When hw/lw varies between 1 and 2, it is called a mid-rise wall, which is governed by both flexure and shear [1]. Performance-based seismic design has basically been applied to systems failing under flexural mode; thus its implementation on systems whose behavior and failure are controlled by shear deformations is still limited.
Although several experimental studies on low-rise RC walls have been carried out, most of their load-displacement data have been presented in terms of total displacement. Due to the difficulty in separating total deformation into web shear, flexural, and sliding deformations, very few data refer to the three components of deformation. Deformation analysis of RC walls is a valuable tool to [2,3,4] (a) reproduce the true strength mechanism for assessing the failure mode, (b) investigate the hysteresis curves in terms of the three components of deformation, (c) assign appropriate stiffness values for linear and nonlinear modeling, (d) estimate the contribution of steel reinforcement to strength and displacement capacities of walls, (e) evaluate or calibrate analytical models of nonlinear response, (f) define both the parameters for performance-based seismic design and the requirements for damage control and, (g) carry out preferential design in favor of a more ductile mechanism over another.
Aimed at developing a method for estimating web shear, flexural, and sliding components of the deformation of low-rise RC walls under shaking table excitations, an experimental and analytical study was carried out. Instrumentation schemes for estimating the components of deformation of walls with and without openings are proposed. Verification of the proposed method is conducted by means of the analysis of response measured during shaking table tests of 6 RC squat walls and walls with door and window openings. Verification includes the discussion of failure modes, the analysis of the contribution of the components of deformation to total story drift, and the evaluation of the dominant deformation mode of each wall.
2. INSTRUMENTATION SCHEMES
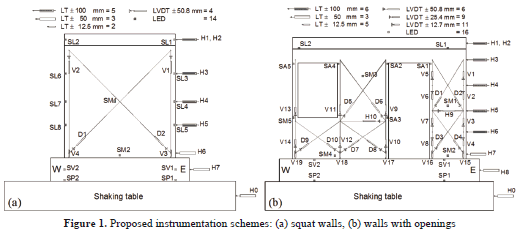
To measure a specimen's response, walls should be instrumented internally and externally. Internal instrumentation is designed to acquire data of the local response of reinforcement through strain-gages bonded to both the steel reinforcement and the concrete surfaces. External instrumentation is planned in such a way that we would be able to learn about the global response through displacement, acceleration, and load transducers, as well as through optical displacement measurement system (with light-emitting diodes, LEDs). To estimate the components of deformation of squat and walls with openings under in-plane seismic excitations reproduced by a shaking table, external instrumentation schemes shown in Fig. 1 are recommended. Proposed schemes were planed and calibrated to fulfill two objectives: (a) to obtain key information on wall behavior and (b) to maximize the data to be recorded and post-processed.
To measure the lateral wall displacements and then to estimate the displacement profile and the total story drift, it is recommended to use linear displacement transducers (LT). These should be placed along the wall height in one or in the two wall edges and in the longitudinal direction. Displacements should be recorded at least in 5 or 6 target points along the height of squat and wall with openings, respectively. To measure the potential sliding of the foundation beam of the specimen over a shaking table platform, an LT should be used. These sensors must be attached to a reference steel frame, which must be located off of the shaking table. The period of vibration of the steel frame, in the direction of the seismic excitations, must be equivalent to 50% or lower of the period of vibration of undamaged walls and of the predominant period of vibrations of earthquake records. To measure the vertical displacement at wall base and then to calculate base rotation, an LT attached to a wall surface should be used. Additionally, longitudinal displacements of the shaking table platform should be measured using LTs. In summary, it is recommended to use 10 LTs in squat walls and 14 LTs in walls with openings.
Shear deformations are conventionally estimated from changes in the length of two diagonals. To measure the changes in the length, a diagonal displacement device (DDD) should be used. A DDD is assembled by a linear variable displacement transducer (LVDT) and 2 aluminum pipes with free in-plane rotations at its ends. The purpose of the DDD is to record, in a roughly square area, the diagonal deformations taking place between 2 opposite corners of the wall. In slender wall segments of the wall with openings, displacements should be measured in both the upper and lower section of the wall segment. The DDD could be placed vertically to measure the displacement at wall edges and then to calculate flexural deformations at different wall sections. In summary, it is recommended to use 4 DDDs in squat walls and 26 DDDs in walls with openings.
To enhance or to replace the conventional instrumentation, an optical displacement measurement system with LEDs should be used. LEDs are connected to a camera system and are employed to record the 3-dimensional position of a target point placed on the specimen. The redundancy of sensors in some places of specimens is a valuable tool when: (a) one or various sensors are not able to record the displacement because of the operating errors of the equipment, (b) some sensors are unplugged or obstructed during the failure of specimens.
LED sensors offer two valuable advantages: (a) common problems associated with wiring are avoided because a mechanical connection between the LED and the target point is not required, (b) deterioration or damage of equipment during specimen collapse are avoided because the target points are the unique device on the specimen. The LED's optical ray must be as perpendicular as possible to the selected plane of movement, in this case, the surface of wall web. Camera system must be fixed outside the shaking table to prevent any seismic vibration. Using the optical measurement system, LEDs should be placed in the following target points: (a) two LEDs at each edge of wall base (one at the foundation beam and one at the shaking table platform) for calculating any rotation of the shaking table and for verifying that the walls are properly bolted to the shaking table platform, (b) one LED at the base of squat walls and two LEDs at the base of walls with openings for calculating the wall sliding displacement, (c) one LED at the center of the web of squat walls and two LEDs for walls with openings for calculating any out-plane displacements of walls, (d) 2 LEDs on top of the walls (one at each side of the top slab) for calculating both the average value of the story drift and the rotation of the top slab, and (e) 3 LEDs at the door and window openings for calculating the displacement profile of the 2 wall segments. Additionally, 6 LEDs (3 on each side) should be placed along the height of the squat walls for calculating both the displacement profile and the rotations at different wall sections. In summary, it is recommended to use 14 LEDs in squat walls and 16 LEDs in walls with openings.
3. CALCULATION OF COMPONENTS OF DEFORMATION
Similar to real structures subjected to seismic excitations, the total displacement of a RC wall under shaking table excitations, Dtot, is defined as:

where DT' is the relative wall displacement and DS is the shaking table displacement for a given time t. To simplify, the term t will no be included in the notation. The displacement DT' should be calculated as:

where DT is the relative displacement associated to the wall behavior itself and DOE is the relative displacement caused by the external effects that may be observed during the shaking-table testing. Based on proposed instrumentation schemes, DT can be calculated using the following procedures:
3.1 Using the equation of total displacement
Replacing Eq. (2 ) with Eq. (1 ), DT is obtained as:

This should be obtained from the displacements recoded by two types of sensors: (a) the average of displacement records of two LTs placed on top of a wall slab (H1 and H2) and, (b) the average of the horizontal displacement records of two LEDs placed at the same height as that of LT (SL1 and SL2).
3.1.2 Shaking table displacement, DS
It should also be obtained from displacements recoded by two types of sensors: (a) the displacement record of an LT placed on the shake-table platform (H0), and (b) the average of horizontal displacement records of two LEDs placed on the shaking table platform (SP1 and SP2).
3.1.3 Displacement caused by external effects, DOE
This should be calculated as:

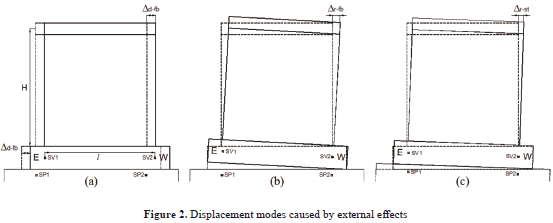
where Dd–fb and Dr–fb are the relative displacements caused by the reduction of tensioning force in prestressing bars used for bolting the foundation beam of specimens to the shaking table platform. Dd–fb is caused by the sliding of the foundation beam over the shaking table platform [Fig. 2 (a)], and Dr–fb is related to a rotation caused by the relative vertical displacement of the ends of the foundation beam [Fig. 2 (b)]. Additionally, any rotation of the foundation beam can cause horizontal displacement in specimens, labelled as Dr–st [Fig. 2 (c)]. Horizontal displacement caused by sliding of the foundation beam over the shaking table platform, Dd–fb, should be calculated as:

where Dbeam is the average of the horizontal displacement records of two LEDs placed at the foundation beam (SV1 and SV2), and DS is the average of the horizontal displacement records of two LEDs placed on the shaking table platform (SP1 and SP2). Both displacements Dr–fb and Dr–st can be calculated directly using Eq. (6) :

where ve and vw are the vertical displacements recorded by LEDs SV1 (East) and SV2 (West), respectively, l is the distance between those LEDs, and H is the height on top of the wall slab (Fig. 2 ).
3.2 Using the deformation modes
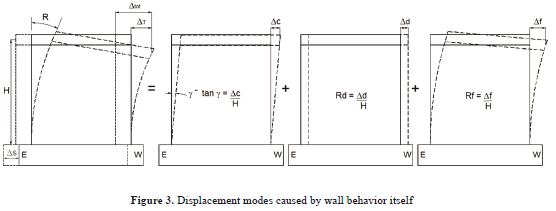
Relative displacement associated to RC wall behavior itself is related to web shear, sliding, and flexural effects (Fig. 3 ). Therefore, the relative displacement DT can be divided into three components:

where Dc, Dd, and Df are the lateral displacements related to web shear, sliding at the wall base and to the flexural behavior of the wall, respectively. For earthquake-resistant design, non-dimensional parameters are used to characterize the global behavior of elements or structural systems. One of these parameters is the drift ratio, which can be measured on a local or a global level. The drift ratio is commonly expressed as a percentage of the story height, and consequently it is called the story drift ratio. For one-story walls tested under shaking table excitations, the drift ratio is obtained by dividing the relative displacement measured at mid-thickness of the top slab by the height at which such displacement was measured (H). When dividing the displacements by the height H, Eq. (7 ) can be rewritten as:

where R is the total lateral drift and, g , Rd, and Rf are the contribution of web shear, sliding, and flexural deformations, respectively, to R.
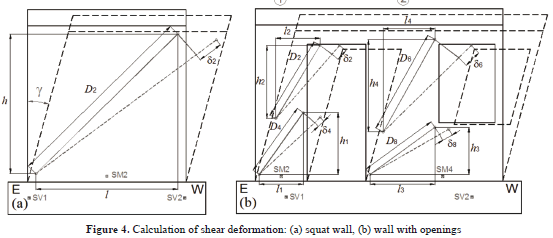
3.2.1 Contribution of shear deformations, DcThe diagonal deformations of each panel can be obtained from the principles of materials mechanics, that is, from changes in the length of two diagonals placed between two opposite corners of the wall. Equation (9 ) should be used for squat walls (hw/lw, = 1) [Fig. 4 (a)].

where g is the web shear deformation, d1 and d2 are the lengthening and contraction recorded by the DDDs 1 and 2, respectively; D1 and D2 are the initial length of diagonals (undamaged wall) 1 and 2, respectively; and l and h are the length and height of the undamaged panel, respectively.
For the wall segment located at the east side of the door opening (wall segment 1), Eqs. (10 ) and (11 ) should be used [Fig. 4 (b)].

For the wall segment located between the door and window openings (wall segment 2), Eqs. (12 ) and (13 ) should be used [Fig. 4 (b)].

DDD records linear displacements between two points located directly on the wall web; therefore, shear deformations are not affected by DOE.
3.2.2 Contribution of the sliding at the wall base, DdRelative displacement at the wall base should be calculated as:

where Dbase is the displacement recorded by the LED placed at the wall base (SM2 in the squat wall and SM2 and SM4 in wall segments 1 and 2, respectively, of walls with openings) and Dbeam is the average of the horizontal displacement records of two LEDs placed at the foundation beams (SV1 and SV2) (Fig. 4 ). To extract the displacements associated to the sliding of a foundation beam over the shaking table platform (Dd–fb) from Eq. (14 ), the records of LEDs placed at the foundation beam should be used instead of those placed at the shaking table platform.
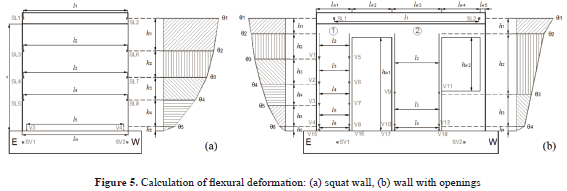
3.2.3 Contribution of flexural deformations, DfFlexural deformations on top of a wall should be calculated from area of the rotation diagram of the cantilever wall. The accuracy of calculating flexural deformations depends on the information available on the shape of the rotation diagram (Fig. 5 ). If the area of actual rotation diagram were known, flexural displacement will be accurately calculated. If only the rotation on top of the wall were available, flexural deformations would be overestimated.
If rotations are measured at least at three heights of the wall, flexural deformation is adequately estimated [2,4]. Based on a response measured during shaking table tests carried out in this study, it is recommended that one calculate the rotation at three sections of low-rise concrete walls. For squat walls, the rotation of sections should be measured using pairs of LEDs along the wall height and one pair of LTs placed at the wall base. Therefore, the contribution of the flexural deformations to the total displacement should be calculated using Eqs. (15 ) to (17) [Fig. 5 (a)].
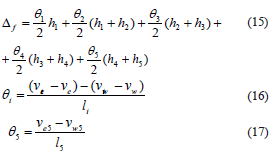
where vei and vwi are the vertical displacements recorded by LEDs placed at the east and west sides, respectively, at wall height hi, li is the distance between these sensors and ve and vw are the vertical displacements recorded by LEDs placed at east (SV1) and west (SV2) sides, respectively, at the foundation beam. In this case, rotations of both the foundation beam (Dr–fb) and the shaking table platform (Dr–st) are extracted from the calculation of Df. In Eq. (17) , ve5 and vw5 are the lengthening or contraction recorded by DDD placed vertically at the east (V3) and west (V4) wall sides, respectively., In Eqs. (15 ) and (17) , h5 and l5 are the height and the horizontal distances between these sensors. Rotations Dr–fb and Dr–st must not be extracted from these displacement records because DDD measures the linear displacement between two points located directly on the wall web.
For walls with openings, the rotations of wall sections should be measured using both a pair of LEDs placed on top of the wall and DDDs distributed vertically along the height of the wall segments. Equations (18 ) and (19) should be used for segments 1 and 2, respectively [Fig. 5 (b)].
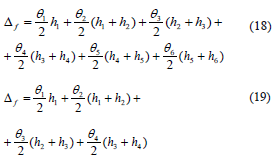
where q1 is calculated using Eq. (16) and q2 to q6 should be calculated in a way similar to that expressed in Eq. (17) .
4. EXPERIMENTAL PROGRAM
The prototype is a two-story house built with RC walls. Wall thickness and clear height are 100 mm and 2400 mm , respectively; and nominal concrete compressive strength is 15 MPa. To thoroughly study the experimental behavior of walls under seismic actions, shaking table testing was selected. Owing to limitations in the payload capacity of the shaking table equipment at UNAM, as well as for adequately extrapolating the specimen's response to the the prototype's response, models with a 1:1.25 geometry scale factor were designed and built for shaking table testing. Because lightly scaled models were used (80% of the prototype), the simple law of similitude was chosen [5].
4.1 Geometry and reinforcement layout
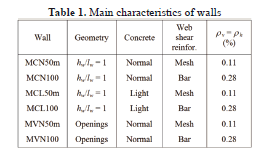
The experimental program included shaking table testing of 6 thin walls, with low web shear reinforcement (horizontal, rh; and vertical, rv), using deformed bars and welded-wire mesh, and using normal- and light-weight concrete. Squat walls (hw/lw = 1) and walls with door and window openings were studied. The main characteristics of the specimens are shown in Table 1 . The thickness (tw) and height (hw) of the wall models were 80 mm and 1920 mm , respectively. For squat walls, lw = 1920 mm. For walls with openings, lw1 = 640 mm , lw2 = 720 mm , lw3 = 896 mm, lw4 = 688 mm, lw5 = 96 mm , hw1 = 1680 mm, and hw2 = 960 mm (Fig. 5 ). The details of the geometry and reinforcement layout may be found elsewhere [6,7].
4.2 Instrumentation
To calculate the components of the deformation of the specimens, instrumentation schemes shown in Fig. 1 were used. Conventional transducers were connected to a data control and recording system. LEDs of the optical measurement system were connected to a camera system where data were recorded.
4.3 Earthquake records and test setup
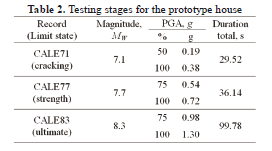
Aimed at studying wall performance under earthquake records associated with different limit states, from the onset of cracking to collapse, models were subjected to three earthquake hazard levels. The main earthquake characteristics and testing stages for the prototype house are shown in Table 2 . Specimens were tested under progressively more severe earthquake actions, scaled up by considering the value of peak ground acceleration (PGA) as the reference factor until the final damage stage was attained.
A mass-carrying load system for supporting the mass and transmitting the inertia forces was used for testing walls. The device was allowed to slide horizontally on a fixed supporting structure located off of the the shaking table [8].
5. RESULTS AND DISCUSSION
Failure modes and the contribution of the three deformation modes to total drift ratio are discussed in this section. Further information on the specimen's response may be found elsewhere [6,7].
5.1 Failure modes
Shear failure mode was observed in all walls. Walls reinforced in the web using welded-wire mesh exhibited diagonal tension failure. Failure was governed by web-inclined cracking at approximately a 45° angle, by plastic yielding of most of web shear reinforcement, and by the subsequent sudden fracture of wires. Walls reinforced using deformed bars exhibited a mixed failure mode, where diagonal tension and diagonal compression were observed. In these walls, the yielding of most web steel reinforcement and, simultaneously, noticeable web crushing of concrete were observed.
5.2 Displacements caused by external effects
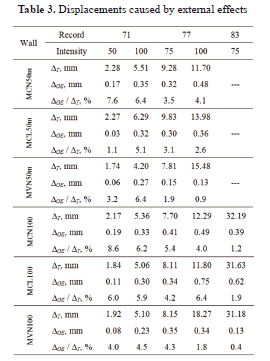
Relative displacements caused by effects that are independent of wall behavior are shown in Table 3 [DOE, Eq. (4) ]. These displacements are also expressed as a percentage of the total displacement (DT). Values are associated with the time when the maximum relative displacement of walls was attained during each earthquake record. Maximum values of DOE varied between 0.4% and 8.6%. The highest values were associated with the CALE71 earthquake records where DOE was very low (~0.30 mm). In all cases, DOE was included in the calculation of DT [Eq. (3) ].
5.3 Error estimation in displacement measuring
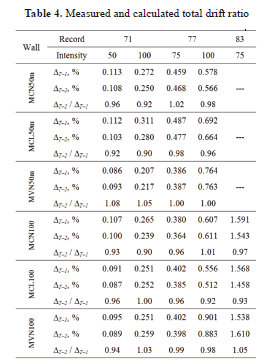
In most of the experimental studies done on concrete walls, the contribution of flexural deformations to total drift ratio is calculated using the measurement of 3 additional terms of Eq. (7) ; that is, using the measurement of the total, the web shear, and the sliding displacements. However, the instrumentation schemes proposed in this study allow for the measurement of the 4 terms of Eq. (7) . Since the problem is overdefined (more measured quantities than required), it was possible to estimate the total error in the estimation (discrepancy between measured and calculated total displacement). By means of the difference between results obtained using Eqs. (3) and (7) , the total error involved in the estimation of the contributions was evaluated, i.e., the total error was calculated as the ratio between the calculation (the sum of 3 measured contributions) and the measured total displacement. Measured [DT–1, Eq. (3) ] and calculated [DT–2, Eq. (7) ] relative displacements in terms of story drift are shown in Table 4 .
Values in Table 4 are associated to the time when maximum relative displacement of walls was attained during each earthquake record. The error never exceeded 10% and was distributed proportionally among the three deformation components (web shear, sliding and flexure).
5.4 Components of displacement
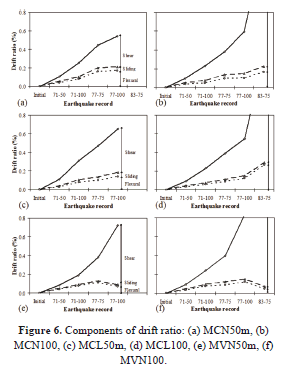
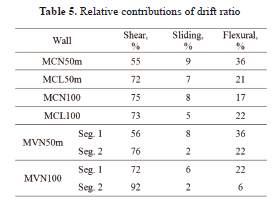
The contribution of deformation modes to the total drift ratio of walls is shown in Fig. 6 . Table 5 shows the relative contributions associated to the time when the maximum drift ratio of walls was attained during each earthquake record. Relative contributions are expressed as a percentage of the total drift ratio.
The behavior of squat walls (hw/lw=1) was always controlled by web shear deformations. For walls with web shear reinforcement made of welded-wire mesh (MCN50m and MCL50m), the relative contribution of each mode did not vary notably with drift ratio (Table 5 ). In contrast, for walls with web shear reinforcement made of deformed bars (MCN100 and MCL100), shear deformations increased significantly with drift ratio, but flexural and sliding contributions diminished (Table 5 ).
Response of walls with openings (MVN50m and MVN100) was not controlled exclusively by shear deformations. The wall segment located at the east side of the door opening (wall segment 1) exhibited a high contribution of flexural deformations, particularly for story drifts lower than 0.2%. The behavior of the wall segment located between door and window openings (wall segment 2) was similar to that of squat walls (hw/lw = 1), that is, shear was the major contributor to the total displacement. For all cases, relative contributions also revealed that wall sliding was minimal.
CONCLUSIONS
Aimed at evaluating the components of deformation of low-rise RC walls, results of an analytical and experimental study have been presented in this paper. Based on these results, the following conclusions were reached:
- Instrumentation schemes proposed herein for squat walls and walls with openings were planned and calibrated to maximize key information to be recorded and post-processed. The method and the instrumentations schemes are a valuable tool to evaluate both the effect of each deformation mode on total displacement of the wall and the prevailing inelastic deformation mode in each specimen.
- Modern design procedures give more emphasis to the deformation capacity of a structure. For example, performance-based seismic design (PBSD) requires the explicit consideration of lateral displacement as a performance indicator. One of the main obstacles hindering the implementation of PBSD in low-rise RC walls is the absence of suitable analytical models for predicting the load-displacement curve. Negligible measured sliding displacements during the tests demonstrated that a load-displacement curve can be based on a model in which the total displacement is calculated as the sum of contributions related to flexure and shear.
- Shear failure mode was observed in all walls and thus, the contribution of flexural deformation was always lower than 36%. This trend allows for one to conclude that a flexural failure mode may be observed in RC walls where the contribution of flexural deformation is higher than 40%. When predicting the governing failure mode, it will be possible to design RC walls in favor of a suitable strength mechanism.
REFERENCES
[1] Liao, W., Zhong, J., Mo, Y. and Loh, C., Shake table test of low-rise shear walls. Proceedings of 8th US National Conference of Earthquake Engineering. San Francisco, California, Paper 166, 2006. [ Links ]
[2] Massone, L. and Wallace, J., Load-deformation responses of slender reinforced concrete walls. ACI Structural Journal, 101(1), pp. 103-113, 2004. [ Links ]
[3] Salonikios, T., Kappos, A., Tegos, I. and Penelis, G., Cyclic load behavior of low-slenderness reinforced concrete walls: failure modes, strength and deformation analysis, and design implications. ACI Structural Journal, 97 (1), pp. 132-142, 2000. [ Links ]
[4] Pilakoutas, K. and Elnashai, A., Interpretation of testing results for reinforced concrete panels. ACI Structural Journal, 90 (6), pp. 642-645, 1993. [ Links ]
[5] Tomazevic, M. and Velechovsky, T., Some aspects of testing small-scale masonry building model on simple earthquake simulator. Journal of Earthquake Engineering and Structural Dynamics, 21 (11), pp. 945-963, 1992. [ Links ]
[6] Carrillo, J. and Alcocer, S., Degradation properties of reinforced concrete walls with openings. DYNA, 78 (170), pp. 106-115, 2011a. [ Links ]
[7] Carrillo, J. and Alcocer, S., Experimental evaluation of the strut-and-tie method applied to low-rise concrete walls. Journal of Ingeniería e Investigación, 30(1), pp. 11-16, (in Spanish). 2010. [ Links ]
[8] Carrillo, J. and Alcocer, S., Improved external device for a mass-carrying sliding system for shaking table testing. Journal of Earthquake Engineering and Structural Dynamics, 40 (4), pp. 393-411, 2011b. [ Links ]


