Serviços Personalizados
Journal
Artigo
Indicadores
-
 Citado por SciELO
 -
 Acessos
Links relacionados
-
 Citado por Google
 -
 Similares em
SciELO
 -
 Similares em Google
Compartilhar
DYNA
versão impressa ISSN 0012-7353
Dyna rev.fac.nac.minas vol.79 no.176 Medellín nov./dez. 2012
ULTRASONIC SENSOR FOR THE PRESENCE OF OILY CONTAMINANTS IN WATER
SENSOR ULTRASONICO PARA LA PRESENCIA DE CONTAMINANTES OLEOSOS EN AGUA
EDIGUER E. FRANCO
Ph.D. Departamento de Energética y Mecánica - Universidad Autónoma de Occidente, Cali, Colombia, eefranco@uao.edu.co
JULIO C. ADAMOWSKI
Ph.D. Departamento de Engenharia Mecatrônica e de Sistemas Mecânicos - Escola Politécnica da Universidade de São Paulo, São Paulo - SP, Brasil, jcadamow@usp.br
FLAVIO BUIOCHI
Ph.D. Departamento de Engenharia Mecatrônica e de Sistemas Mecânicos - Escola Politécnica da Universidade de São Paulo, São Paulo - SP, Brasil, fbuiochi@usp.br
Received for review July 5th, 2011, accepted April 26th, 2012, final version May, 15th, 2012
ABSTRACT: The determination of the complex reflection coefficient of ultrasonic shear-waves at the solid-liquid interface is a technique employed for the measurement of the viscoelastic properties of liquids. An interesting property of the measurement technique is the very small penetration depth of the shear-waves into the liquid sample, which permits measurements with liquid films of some micrometers thick. This property, along with the adhesion of oily substances to surfaces, can be used for the detection of oily contaminants in water. In this work, the employment of the ultrasonic shear-wave reflection technique to the detection of oily contaminants in water is proposed and the theoretical and experimental concepts involved are discussed. Preliminary experimental results show the measurement technique can detect SAE 40 automotive oil in water in volume proportions less than 0.5%.
KEYWORDS: Ultrasound, shear waves, water-oil emulsion, oily contaminant.
RESUMEN: La determinación del coeficiente de reflexión de ondas transversales ultrasónicas en la interfaz sólido-líquido es una técnica que ha sido usada para la medición de las propiedades viscoelásticas de líquidos. Una característica interesante de la técnica es la pequeña distancia recorrida por las ondas transversales dentro del fluido, antes de ser completamente atenuadas, permitiendo la medición con una película muy delgada de líquido, del orden de algunos micrómetros. Esta característica, además de la conocida tendencia de las sustancias oleosas a adherirse a superficies, puede ser usada para la detección de contaminantes oleosos en agua. Este trabajo propone el uso de la técnica de reflexión de ondas transversales en el rango ultrasónico para la detección de contaminantes oleosos en agua y discute las bases teóricas y experimentales relacionadas. Resultados experimentales preliminares muestran que es posible la detección de la presencia de aceite automotriz SAE 40 en agua en proporciones menores a 0,5% en volumen.
PALABRAS CLAVE: Ultrasonido, ondas transversales, emulsión agua-aceite, contaminante oleoso.
1. INTRODUCTION
A Newtonian liquid is a liquid whose shear stress versus shear strain rate curve is linear (passes through the origin) and the constant of proportionality is the viscosity. Many common liquids exhibit Newtonian behavior at the low frequencies used in the conventional viscometry. However, at ultrasonic frequencies, the liquid can exhibit simultaneously viscous and elastic, or viscoelastic, behavior [1]. The viscoelastic behavior opens the possibility of propagating shear-waves in liquids. These waves are strongly attenuated and can only propagate a very small distance, usually of some micrometers [2].
When a shear-wave propagating in a solid strikes the interface defined between the solid and a liquid, a small portion of the energy is transmitted and the greatest portion is reflected back. The ratio of the reflected to the incident tensions is the reflection coefficient, which is a complex-valued quantity. The magnitude and phase of the reflection coefficient are related, respectively, to the amplitude change and to the phase shift of the wave in the reflection process [3].
A change in the viscoelastic properties of the liquid cause variation in both magnitude and phase of the reflection coefficient. This phenomenon can be used for liquid characterization or monitoring. From the literature, it can be established that the technique has been used mainly for viscosity [4-5] and viscoelasticity [6-7] characterization of liquids. Nevertheless, some authors used it for the monitoring of industrial processes, such as the curing of polymeric resins [3][8] and Portland cement pastes [9], and measuring the viscosity at high temperatures [10].
In this work, the shear-wave reflection technique is proposed for the detection of oily contaminants in water. The idea arose from a published work where the potential of shear oscillations in the detection of water content in lubricant oil was analyzed [11]. The authors concluded that shear oscillations cannot be used to detect the presence of water in oil. The reason is that the small water droplets in the water-in-oil emulsion are rarely located in the thin oil layer in touch with the solid [12]. However, the very small penetration depth, besides the property of adhesion of oily substances to surfaces, could be used for the detection of oily contaminants in water or another light liquid.
This monitoring technique could be interesting in industrial applications where the quality of the water must be guaranteed. For example, in environmental science, the technique could have application in the monitoring of the wastewater discharged into rivers by some industries.
2. THEORETICAL BACKGROUND
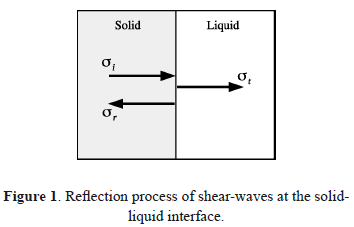
Figure 1 shows a solid medium in contact with a liquid, where a plane interface is defined. An incident shear wave, with mechanical tension  , strikes the interface. A small part of the wave is transmitted to the liquid (
 ) and the most part is reflected back (
 ). The ratio of the reflected to the incident tensions is the complex reflection coefficient:

where r and q are the magnitude and phase, respectively. The magnitude and phase are related with the amplitude change and the phase shift of the shear wave in the reflection process. The measurement of the magnitude is a relatively simple and precise process. In contrast, the phase is difficult to measure due to the strong temperature dependence of the velocity propagation of the acoustic waves.
From the acoustic theory,  is related to the acoustic impedance of the media by the following equation:

where  and
and  are the shear impedances of the liquid and solid, respectively. The shear impedance of the liquid is denoted complex-valued due to the high attenuation involved. On the other hand, the shear impedance of the solid is real-valued, because attenuation in the solid is very small compared with the liquid attenuation:

where  and
and  are the density and the shear-wave propagation velocity in the solid, respectively. In the case of a Newtonian liquid, the shear impedance is obtained by the following equation:

where  is the viscosity,
  is the angular frequency of the wave,
  is the liquid density and
  is the imaginary unit. Equations (2), (3) and (4) can be used to estimate the reflection coefficient value in terms of the physical properties of the solid and liquid [8].
The characteristic decay length of a shear wave in a liquid can be calculated by [11]:

where  represents the distance traveled for an amplitude drop of 1/e (0.37) times the initial amplitude. This equation provides an estimation of the penetration depth under Newtonian behavior.
3. EXPERIMENTAL
3.1 Experimental setup
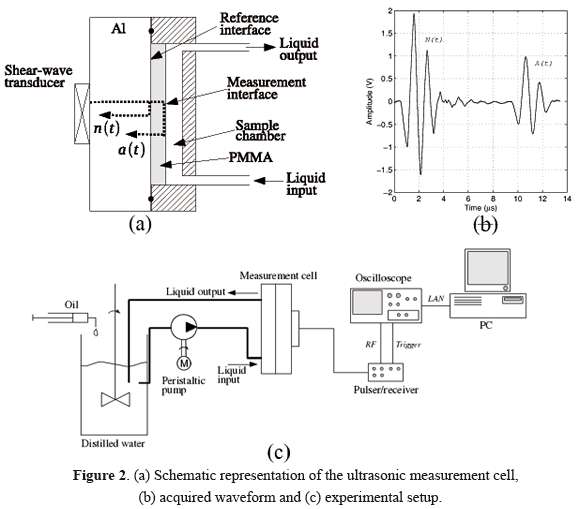
A schematic representation of the ultrasonic measurement cell employed in this work is shown in figure 2(a). It is composed by a 1-MHz shear-wave transducer (Krautkramer B1-Y, GE Sensing & Inspection Technologies, Fairfield - CT, USA), an aluminum delay line, an acrylic (PMMA) delay line and a sample chamber. The transducer operates in pulse/echo mode and two echoes were received,  from the aluminum-acrylic interface and
  from the acrylic-sample interface. Figure 2(b) shows the acquired signal as seen on the oscilloscope screen.
  works as a constant reference for the measurement, being important for error reduction and improvement of the measurement stability.
The shear-wave transducer was driven by a commercial pulser/receiver unit (Panametrics 5077PR, Olympus NDT, Kennewick - WA, USA). The acquisitions of the signals were made using the oscilloscope (Agilent DSO6052A, Agilent Technologies, Santa Clara - CA, USA) with sample rate of 500 MSa/s and each saved signal was the average of 32 individual signals. The acquisitions were transferred via LAN network to a personal computer for later processing with specially developed Matlab scripts.
Figure 2(c) shows a schematic representation of the entire experimental setup. It is composed by a beaker where 1000 ml of distilled water was stored, an agitator, a peristaltic pump of the type used in medical equipment that recirculates the water through the measurement cell and back to the beaker, the ultrasonic measurement cell, the pulser/receiver, the oscilloscope and a personal computer.
The temperature was measured at the beginning and at the end of the experiment with a thermometer with precision of 0.1°C. Every 30 minutes, 5 ml of the contaminant was added to the beaker using a syringe.
3.2. Material properties
The SAE 40 automotive oil and the acrylic used in the measurement cell were carefully characterized for a previous work [4]. The SAE 40 oil density is 857 kg/m3. In the temperature range from 22.6 to 23.5°C, the viscosity varies from 0.30 to 0.28 Pa·s. In the case of the acrylic, the density is 1179 kg/m3 and the shear wave velocity is 1315 m/s.
3.3. Experimental determination of the reflection coefficient
The magnitude and phase of the reflection coefficient were obtained by comparing, in the frequency domain, each acquired signal with the first signal registered in the beginning of the test. By supposing clean water in contact with the solid and a working frequency of 1 MHz, a complete reflection is obtained because the huge acoustic impedance mismatch. When an oily fluid contaminant is added, small droplets of oil travel in the water and gradually stick to the solid surface. From the theory, a very thin oil film must be sufficient to create a detectable change in magnitude and phase. By using equation (5) with the material properties reported before, the characteristic decay length obtained is d = 10.4 mm. This numerical results show how thin can be the oil layer in order to detect its presence by the shear waves.
If  and
and  are the Fourier transforms of the echoes
  and
and  , respectively, and using the frequency band method developed by the authors for the ultrasonic measurement of dynamic viscosity [4], the magnitude and phase of the reflection coefficient can be obtained by the following expressions:

where  and
and  .
.  and
and  define a frequency band centered in
  and
and  wide, where a = 0.55 in this work.
  is the center frequency of the first
  pulse and parameter
  (
( ) defines the bandwidth. Additional information about the frequency band method can be found in the work of Franco et al. [4].
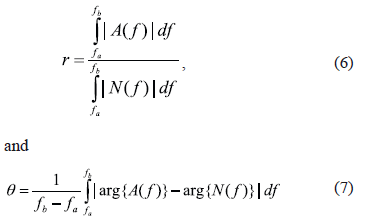
In equation (6), the numerator and denominator are the areas under the curve of the Fourier spectrum magnitude of signals  and
and  , respectively, in the frequency range from
  to
to  , and
, and  is the ratio of these two areas. Equation (7) is the mean value of all angle differences of the Fourier spectrum of signals
  and
and  in the frequency range from
 to
to  .
.
The signal processing was carried out using Matlab. The echoes  and
and  were isolated in temporal windows, each signal was centered and the Fourier spectrum was calculated using the Goertzel algorithm. The frequency range between fa and fb was represented by 1000 points.
4. RESULTS AND DISCUSSION
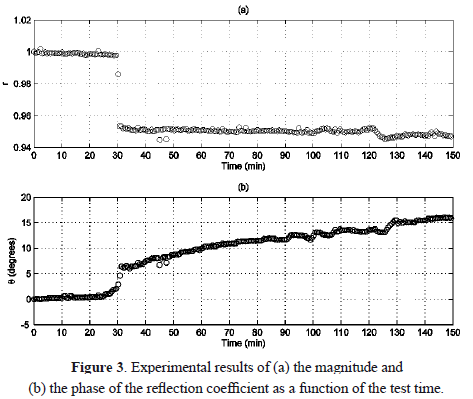
Figure 3 shows the experimental results for the magnitude 3(a) and phase 3(b) of the reflection coefficient as a function of the acquisition time (t). Results were normalized using the values measured in the first acquisition.
The magnitude results plotted in figure 3(a) show a sudden reduction at t = 30 min, when the first contaminant oil portion of 5 ml was added to the beaker. This reduction from r = 1.0 to r = 0.95 happens in a very small time, compared to the total acquisition time of 150 min. Thereafter, the magnitude value remains practically constant despite the subsequent contaminant portions added to the beaker (one every 30 minutes until the end of the test). Certainly, the technique can only detect whether there is a contamination or not, at least considering the time scale and contamination amount used in this experiment.
There is a stability of the magnitude over the test time. The magnitude value is practically constant, except for t = 30 min where a sudden change happens. This is an important result because stability is a desirable feature in all measurement processes, particularly when a long term measurement is required. This property is largely a consequence of the normalization process, when the echo returned from the aluminum-acrylic interface is used as a constant reference. The normalization technique was applied successfully in previous works [2][8], where additional information can be found.
The phase results plotted in figure 3(b) also show a sudden change at min. However, the phase is strongly time dependent and its value increases with the acquisition time in an apparently linear way. This results show the phase is not interesting for contamination monitoring, as suspected. Nevertheless, the phase can be useful for the temperature monitoring of the water.
Water temperature monitoring is possible by a simple calibration of the measurement cell. In the experiment, the temperature was measured at the beginning (22.6°C) and at the end (23.5°C). This temperature variation of 0.9°C was responsible for a phase variation of about 15°, suggesting an approximated sensitivity of 17° degrees per Celsius degree. In an interesting work [10], this approach was used for the simultaneous measurement of viscosity and temperature of melts.
The adherence of oily substances to surfaces is the mechanism that allows the measurement. Oil drops traveling in the water reach the solid surface forming a thin layer that can be detected. Although the level of contamination could not be estimated, the experimental results suggest the technique can at least detect the presence of contamination. The disadvantage of not being able to determine the contamination level could be overcome by using the oil accumulation rate. That is, the level of contamination could be related to the time required to reach a measurable change on the magnitude (r).
By using equations (1) to (4) and the material properties reported in section 3, the magnitude and phase of the reflection coefficient for the SAE 40 oil, assuming Newtonian behavior, can be obtained. For a temperature of 23.0°C and frequency of 1 MHz, the magnitude and phase expected values are  and respectively. From figure 3, the obtained magnitude is approximately . The phase shift at min is difficult to be exactly determined, but clearly this value is greater than 5°. In conclusion, the measurement cell finds the fluid to be more viscous than it actually is. This unexpected behavior improves the sensitivity and it is an interesting result that deserves a more detailed study.
5. CONCLUSIONS
The methodology proposed has potential for the detection of oily contaminants in water. Both quantities, the magnitude and phase of the reflection coefficient, showed the expected change when 5 ml of SAE 40 oil was incorporated into the water, namely, a contamination of 0.5% in volume of SAE 40 oil in water was detected successfully.
The magnitude showed a stable behavior during the test time (150 minutes). This suggests its suitability for longtime monitoring. Taking into account the variation of 0.9°C during the test, it can be concluded that the magnitude is further independent on temperature. In contrast, the phase exhibits an important variation during the test time due to the temperature variation. This behavior is expected due to the strong temperature dependence on the propagation velocity and, consequently, the phase is not useful for monitoring of contamination. Nonetheless, as the phase shift is proportional to temperature, it can be used for temperature monitoring of the water.
For a better understanding and for the evaluation of possible practical applications, additional experimental results are required. It is important to determine the minimum amount of oil that could be detected, the influence of the wave frequency and the stability in longer test times. Equally important is the evaluation of temperature monitoring using the phase of the reflection coefficient.
REFERENCES
[1] Mason, W. P., Baker, W. O., Mcskimin, J. M. and Heiss, J. H., Measurement of shear elasticity and viscosity of liquids at ultrasonic frequencies, Physical Review, 75 (6), pp. 936-946, 1949. [ Links ]
[2] Franco, E. E., Adamowski, J. C., Higuti, R. T. and Buiochi, F., Viscosity measurement of newtonian liquids using the complex reflection coefficient, IEEE Transaction on Ultrasonics, Ferroelectrics and Frequency Control 55 (10), pp. 2247-2253, 2008. [ Links ]
[3] Dixon, S. and Lanyon, B., Phase change measurement of ultrasonic shear waves on reflection from a curing epoxy system, Journal of Physics D: Applied Physics, 38 (22), pp. 4115-4125, 2005. [ Links ]
[4] Franco, E. E., Adamowski, J. C. and Buiochi, F., Ultrasonic viscosity measurement using the shear-wave reflection coefficient with a novel signal processing technique, IEEE Transaction on Ultrasonics, Ferroelectrics and Frequency Control, 57 (5), pp. 1133-1139, 2010. [ Links ]
[5] Saggin, R. and Coupland, J. N., Oil viscosity measurement by ultrasonic reflectance, Journal of the American Oil Chemists' Society, 78 (5), pp. 509-511, 2001. [ Links ]
[6] Rommetveit, T., Johansen, T. F. and Jhonsen, R., Using a multi-layered transducer model to estimate the properties of paraffin wax deposited on steel, Ultrasonics, 51 (1), pp. 85-93, 2011. [ Links ]
[7] Gasparoux, J, Laux, D., Ferrandis, J. Y., Attal, J. and Tordjeman, P., Large frequency bands viscoelastic properties of honey, Journal of Non-Newtonian Fluid Mechanics, 153 (1), pp. 46-52, 2008. [ Links ]
[8] Cohen-Tenoudji, F., Pardee, W. J., Tittmann, B. R., Ahlberg, L. and Elsley, R. K., A shear wave rheology sensor, IEEE Transaction on Ultrasonics, Ferroelectrics and Frequency Control, UFFC-34 (2), pp. 263-269, 1987. [ Links ]
[9] Sun, Z., Voigt, T. and Shah, S. P., Rheometric and ultrasonic investigations of viscoelastic properties of fresh portland cement pastes, Cement and Concrete Research, 36 (2), pp. 278-287, 2006. [ Links ]
[10] Balasubramaniam, K., Shah, V., Costley, R. D., Bourdreaux, G. and Singh, J. P., High temperature ultrasonic sensor for the simultaneous measurement of viscosity and temperature of melts, Review of Scientific Instruments, 70 (12), 4618-4623, 1999. [ Links ]
[11] Jakoby, B. and Villekoop, M. J., Physical sensor for water-in-oil emulsions, Sensors and Actuators A, 110, pp. 28-32, 2004. [ Links ]
[12] Jacoby, B., Beigelbeck, R., Keplinger, F., Lucklum, F., Niedermayer, A., Reichel, E. K., Riesch, C., Voglhuber-Brunnmaier, T. and Weiss, B., Miniaturized Sensor for the Viscosity and Density of Liquids - Performance and Issues, IEEE Transaction on Ultrasonics, Ferroelectrics and Frequency Control, 57 (1), pp. 111-119, 2010. [ Links ]


