Serviços Personalizados
Journal
Artigo
Indicadores
-
 Citado por SciELO
 -
 Acessos
Links relacionados
-
 Citado por Google
 -
 Similares em
SciELO
 -
 Similares em Google
Compartilhar
DYNA
versão impressa ISSN 0012-7353
Dyna rev.fac.nac.minas vol.79 no.176 Medellín nov./dez. 2012
USING THE ASTM E 274 SKID TRAILER DATA TO CHARACTERIZE PAVEMENT FRICTION BEHAVIOR WITH RESPECT TO THE TRAVELING SPEED AND THE WHEEL SLIP RATIO
CARACTERIZACIÓN DE LA RESISTENCIA AL DESLIZAMIENTO EN SUPERFICIES DE PAVIMENTO UTILIZANDO EL DESLIZÓMETRO ASTM E 274
MADHURA RAJAPAKSHE
Ph.D. Graduate Research Assistant, University of South Florida, Tampa, United States, mrajapak@mail.usf.edu
LUIS GUILLERMO FUENTES
Ph.D. Chair, Universidad del Norte, Barranquilla, Colombia, lfuentes@uninorte.edu.co
MANJRIKER GUNARATNE
Ph.D. Chair, University of South Florida, Tampa, United States, gunaratn@eng.usf.edu
Received for review March 6th, 2012, accepted June 29th, 2012, final version July, 10th, 2012
ABSTRACT: Knowing the 3-D behavior of friction coefficient (m) vs. traveling speed (v) and wheel slip ratio (s) on runway and highway pavements can facilitate the modern pavement engineers' job to a great extent. However, current methodology is limited to measuring m at desired v and predicting it at different s values (at the same measured v) using 2-dimensional models. The paper presents a study carried out with friction data collected using Locked Wheel Skid Trailer (LWST) (ASTM E 274 Standard Test Method), to obtain the 3-D behavior of m vs. v and s. An available 3-D friction model which is a combination of two well known 2-D friction models; Pennsylvania State University (PSU) model and Rado model, was used with LWST data collected in a field test on a wet asphalt pavement. The findings suggest that this method can provide reasonable predictions of m for pavement management purposes.
KEYWORDS: Friction, Slip Ratio, Macrotexture, Coefficient of Friction, Locked Wheel Skid Trailer.
RESUMEN: Una visión tridimensional de la resistencia al deslizamiento de superficies de pavimento respecto a variables como la velocidad y la razón de deslizamiento permiten caracterizar apropiadamente su comportamiento y facilitan el entendimiento del fenómeno. Sin embargo, los modelos utilizados actualmente para caracterizar la resistencia al deslizamiento solo evalúan un comportamiento bidimensional. La presente investigación utiliza los datos obtenidos por el deslizómetro ASTM E 274 para realizar una caracterización 3D del comportamiento de la resistencia al deslizamiento por medio de la fusión de dos reconocidos modelos bidimensionales de fricción (Modelo de Penn State y el Modelo de Rado). Los resultados de la investigación sugieren que la metodología propuesta presenta apropiados niveles de predicción para ser implementados en sistemas de gestión de infraestructura vial.
PALABRAS CLAVE: Fricción, macrotextura, resistencia al deslizamiento, textura.
1. INTRODUCTION
Pavement friction measurements are observed at different traveling speeds of the measuring devices, as the dynamic friction of tire/pavement interfaces is dependent on the travelling speed (v). It is a well known fact that the dynamic friction at tire/pavement interfaces is also a function of the wheel slip ratio (s), defined by Equation (1). Therefore, the friction coefficient (m) at a tire/pavement interface can be expressed as a two variable function, m - m (v,s).

Where v is the velocity of the vehicle, w is the angular velocity of the tire and R is the nominal radius of the tire.
Continuous Friction Measuring Equipment (CFME) on pavement surfaces constitutes one of the two major types classified by the wheel slip condition; Fixed Slip Devices (FSDs) and Variable Slip Devices (VSDs). VSDs which are specified in ASTM E 1859 [1] are not widely used even though they can measure the variation of friction with both v and s. The devices ROAR and RUNNAR, manufactured by Norsemeter in Norway, are typical examples of VSDs. FSDs can be of two types; locked-wheel and non-locked-wheel FSDs. The Runway Friction Tester (RFT), manufactured by Dynatest, and the Griptester are two examples of non-locked-wheel FSDs. These devices operate at fixed slip ratios between 0.1 and 0.2. Locked Wheel Skid Trailer (LWST) is the most commonly used pavement friction measuring device in the United States. All fifty states' Departments of Transportation (DOTs) have been using this device to collect pavement friction data for years [2]. LWST is used to evaluate the average pavement friction at locked wheel state (s = 1) as outlined in ASTM E 274 [3] and also to measure the peak pavement friction as outlined in ASTM E 1337 [4].
2. DATA COLLECTED BY LWST
LWST is mainly used as a locked-wheel device; it provides the average friction at the locked-wheel condition when it is used for this purpose. It is also used to evaluate the peak friction, for which it records friction data at full wheel slip range (0 to 1) at the traveling speed of the test.
LWST collects friction data at the constant speed of the test vehicle. The test wheel is locked after achieving the expected traveling speed and friction data is collected for a locked wheel phase lasting approximately one second, before the wheel is finally unlocked.
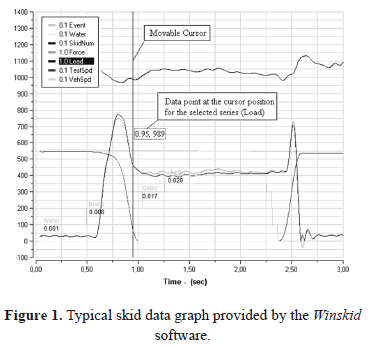
Figure 1 shows the data collected by a typical LWST test. This plot is obtained using the Winskid software developed by International Cybernetics Corporation (ICC) to analyze the raw data from the LWSTs manufactured by them. Collected data include, distance from the starting point of data collection, traveling speed (v) (‘VehSpd' in the graph), circumferential speed of the test wheel (v-sv) (‘TestSpd' in the graph), normal load on test wheel (‘Load' in the graph) and longitudinal frictional force (‘Force' in the graph) on the test wheel, at each data point.
Winskid also provides the skid data at each data point which can be opened in a spreadsheet. One can use the Winskid graph (Figure 1) in combination with the spreadsheet of skid data to extract required ranges of raw data. The movable cursor on the graph with visualized data point facilitates this task.
3. MODELING PAVEMENT FRICTION IN 3-D
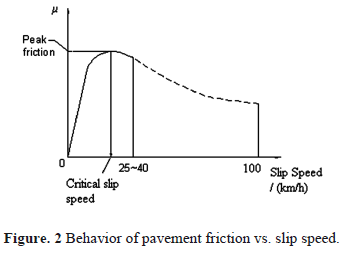
The variation of pavement friction with slip speed can be observed experimentally by using a VSD. A typical plot is shown in Figure 2. This plot is obtained by determining the ratio of the resistive force experienced by the tire to the normal force on the tire, during a continuous braking phase ranging from a no-slip condition to a locked-wheel condition, while traveling at a constant speed of 100 km/h. There is a peak friction observed at a certain critical slip speed. This kind of plot obtained at different traveling speeds is of the same shape, but exhibit the peak friction at slightly different slip ratios. The friction increases until the critical slip speed is reached and thereafter it reduces exponentially. The pre-peak portion of the plot is known to be more affected by the tire properties and the post-peak part is affected by the pavement properties especially the macrotexture [5].
The Pennsylvania State University (PSU) model [6] is one of the earliest pavement friction models used in the pavement management industry. This model is a statistically developed exponential equation (Equation 2) which can be used to predict friction at different slip speeds using friction data measured on a wet pavement at a certain slip speed of the measuring device.

Where SN(S) is the Skid Number (Coefficient of Friction * 100) measured at slip speed S, which is the relative speed between the tire and the pavement (v-sv), and SN0 is the Skid Number at zero slip speed. SN0 has been shown to be highly correlated to pavement microtexture which depends on the surface of aggregate asperities with its magnitude ranging from 1 to 500 mm (0.5 mm). PNG is the percent normalized gradient which describes the rate of decrease of skid resistance with the slip speed. Investigators have shown that PNG is more or less constant on a given surface, and that it is highly correlated to the pavement macrotexture [6, 7]. Pavement macrotexture depends on the arrangement and orientation of aggregate particles on the pavement surface and its magnitude ranges from 0.5 mm to 50 mm [8, 9]. SN0 and PNG can be evaluated by performing a simple linear regression of frictional measurements on a given surface at different speeds. The two model parameters SN0 (friction at slip speed = 0) and PNG can be calibrated to predict SN(S) at any S, by fitting several measured data points to Equation (2).
In an extensive international experiment conducted by the World Road Association which is called the PIARC (Permanent International Association of Road Congresses or the World Road Association) experiment, a modified version of the PSU model was used to harmonize the friction measurements given by devices operated at different slip speeds [8]. Equation (3) defines the PIARC model.

Where FRS is the friction measured at a slip speed S, FR0 is the friction at zero slip speed. Sp can be considered as a constant with units of speed that characterizes the drainage properties of a given surface which are highly correlated to the pavement macrotexture. Sp is calculated by using Equation (4) with the Mean Profile Depth (MPD) value obtained by the Circular Track Meter (CTM) specified in ASTM E 2157 test method [10].

Where a and b are parameters considered to be specific to the texture measuring device used to measure the MPD
Both the PSU and the derived PIARC models confine their applicability to the post-peak portion of the curve shown in Figure 1 as they do not involve parameters which represent the tire influences. However, the PIARC model is used as the basis for the current ASTM Standard practice for harmonizing pavement friction measuring devices (ASTM E 1960) [11, 12].
The International Friction Index (IFI) [11, 12] was developed consequent to the PIARC international experiment, and it is used as the standard to evaluate frictional characteristics of pavement surfaces. IFI is used to harmonize measurements obtained from different frictional measuring devices to a common calibrated friction index. The IFI concept is based on the assumption that the friction value of a given surface depends on the slip speed at which the measurements are taken, texture properties of the pavement surface (both micro and macrotexture) and characteristics of the device used to obtain the measurements [11, 12].
The IFI of a given pavement consists of two parameters: (1) Friction Number (F60) and (2) Speed Constant (Sp). It is typically reported as IFI (F60, Sp) and defined by Equations (5) and (4). This standard practice provides a convenient means of correlating the friction readings from different devices operating at various slip speeds.

Where F60 is the prediction of the calibrated (standard) Friction Number at 60 km/h. A, B and C are parameters specific to the friction measuring device. A, B, and C are obtained by simple linear regression involving the relevant measured parameters in Equations (4) and (5), with the parameter C being used only when a ribbed tire is used for friction testing.
The Rado friction model [5], which is another statistical model developed using the PIARC experiment data, captures both the effects of tire properties and pavement properties on friction vs. slip speed characteristics of a wet pavement. The Rado friction model is defined on Equation (6).
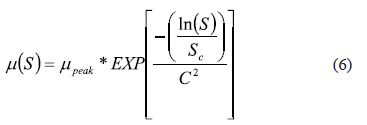
In Equation (6), mpeakis the maximum friction observed during a continuous linear braking phase from free rolling to locked wheel at a constant traveling speed, Sc is the slip speed at which mpeak is observed and C2 is a texture related parameter equivalent to Sp in the PIARC model [13]. The Rado model is capable of describing the friction-slip speed behavior in the complete slip range shown in Figure 2.
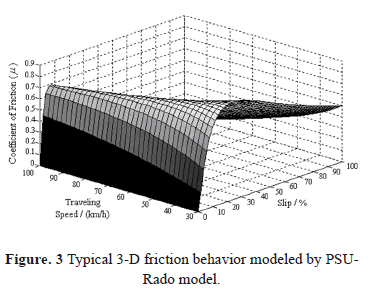
However, neither of the above models can describe the complete 3-dimensional variation of friction with wheel slip and the traveling speed alone. Therefore, a model has been derived combining the PSU and Rado models to serve this purpose [13]. Combination is done by replacing mpeak in the Rado model with the PSU model modified by using traveling speed in place of slip speed (Equation (7)).

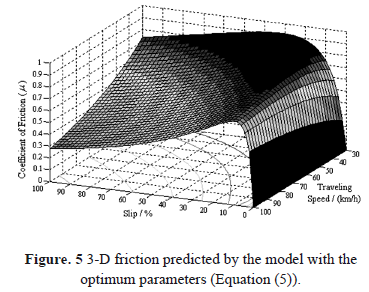
Where v represents the speed of the testing device. The remaining parameters used on Equation (7) were defined earlier in the text and can be used to fit the model to the measured friction data on a particular tire/pavement interface. This model, which will be called the PSU-Rado model in the present document, was used in the analysis to obtain the 3-dimensional friction behavior using the LWST data. Figure 3 shows the typical 3-dimensional behavior of friction described by Equation (7).
4. TEST DATA USED FOR CALIBRATION
A reasonably level and straight 300 feet long asphalt pavement stretch on the right lane of South Bound McKinley Drive, Tampa, Florida was tested with a LWST using a standard smooth test tire (ASTM E 524 [14]). Tests were carried out at 32, 48, 64 and 80 km/h (20, 30, 40 and 50 mph) traveling speeds on a dry sunny day. Four 25 m (75 ft) sections were demarcated and four repetitions were carried out within each section at each speed. Dynamic Friction Tester (DFT) [15] and CTM tests were also conducted along the LWST test path, with one test per section, in dry weather conditions similar to that prevailed during the LWST tests.
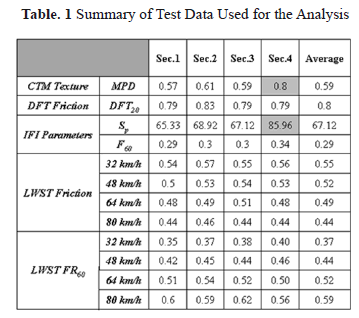
Table 1 illustrates the summary of LWST, DFT and CTM test data obtained from McKinley site according to the standard ASTM practice (ASTM E 1960). The LWST data shown in Table 1 are the average m values measured during the locked wheel phase (s = 1). It is seen that the test data is consistent for all four sections, without much variation from each other. The only major deviation is the CTM MPD at the fourth section which is much higher than that for the other three sections. Hence, this measurement was discarded in computing the average MPD and Sp.
5. CALIBRATION OF THE MODEL USING TEST DATA
The PSU-Rado 3-D friction model was calibrated using the collected LWST data on test Section 3, at each of the four traveling speeds at which the tests were performed. Model parameters m0, Sp and C were optimized to achieve the best fit with the observed data at the calibration speed (the fourth parameter Sc is the slip speed at the maximum observed m). A Matlab program with the inbuilt Matlab function lsqnonlin (nonlinear least-squares) was used to solve the nonlinear data-fitting problem in this analysis.
The analysis using 48 km/h data for calibration is shown in detail in this section and the following section. The analysis with the calibration at the other three tested speeds is presented in Section 7.
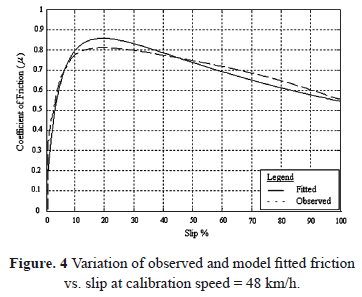
The optimum model parameters (for calibrating at 48 km/h traveling speed) were found to be m0 = 1.07, Sp = 222 km/h and C = 2.42. Sc from the observed data was 9.49 km/h. Figure 4 shows the fitted curve for the selected data using the optimum model parameters. The coefficient of determination (R2) for the fit is 0.91 and the Root Mean Square (RMS) error in m is 0.08.
6. APPLICATION OF THE CALIBRATED 3-D MODEL FOR PREDICTIONS
The model equation is shown with the optimum model parameters in Equation. (5). This equation was used to predict LWST friction of tested interface at traveling speeds other than the calibration speed. The 3-dimensional friction behavior described by Equation (5) is shown in Figure 5.

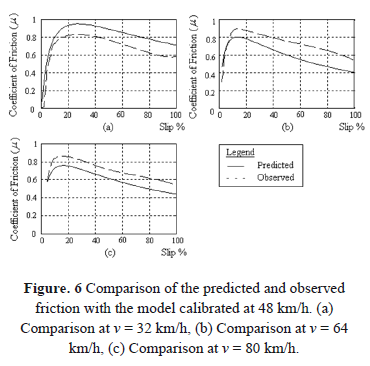
Figure 6 shows the predictions of the coefficient of friction made using Equation (5) at the other three speeds, corresponding to the data that was not used for calibration. For example, the solid predicted line in Figure 6 (a) is the plot of Equation (9) which corresponds to the traveling speed of 32 km/h.

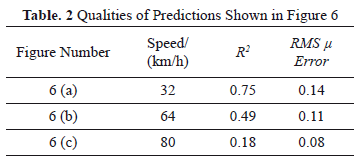
It can be observed that the friction predictions at the speed lower than the calibrated speed (i.e. 32 km/h) are overestimates and it is vice versa at the higher speeds (i.e. 64 and 80 km/h). Table 2 shows the measures of the quality of the predictions shown in Figure 6.
7. CALIBRATION AND PREDICTIONS AT OTHER TESTED SPEEDS
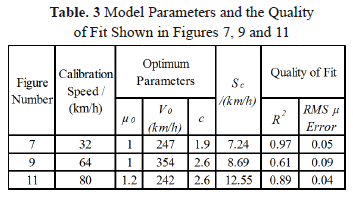
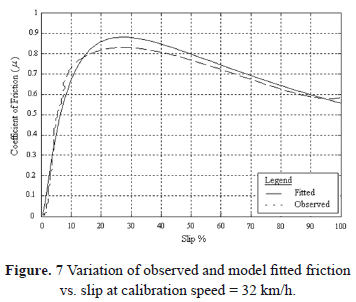
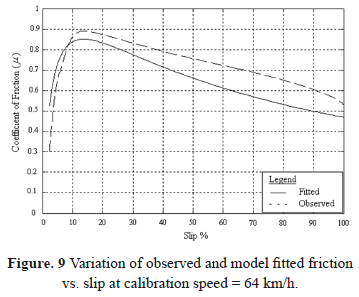
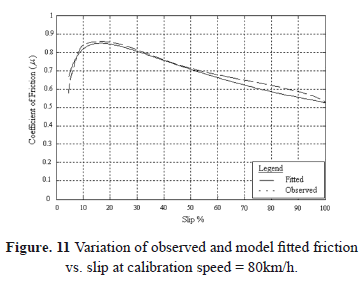
Table 3 shows the optimum model parameters with observed Sc and the quality of the curve fitting, for the model calibrated at 32, 64 and 80 km/h travelling speeds. In addition, Figures 7, 9 and 11 show the plots of curve fitting at the above speeds respectively.
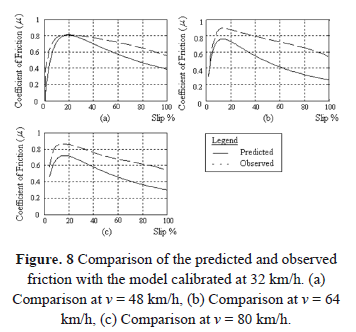
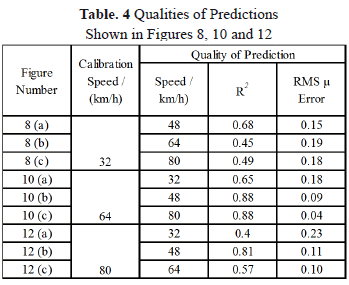
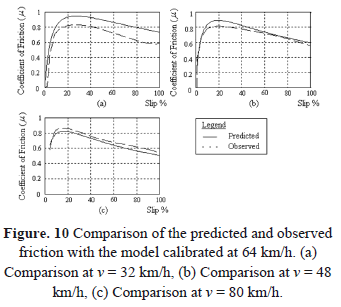
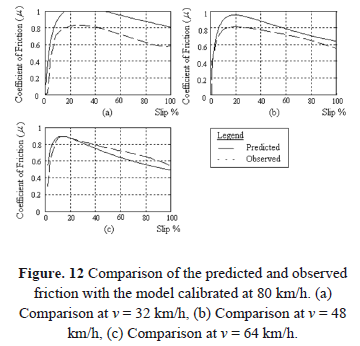
Figures 8, 10 and 12 show the predictions made by using the calibrations at 32, 64 and 80 km/h traveling speeds respectively to obtain the friction at other velocities, the data at which was not used for calibration. Table 4 shows measures of the quality of the predictions shown in Figures 8, 10 and 12.
Averages of the RMS error in m for calibration and predictions can be used as a measure of the overall accuracy of the model. These values are 0.14, 0.10, 0.10 and 0.12 for calibrations at 32, 48, 64 and 80 km/h speeds respectively. The higher the average RMS error the lower the overall accuracy of the model.
Although the curve fitting (Figure 7) is better than that for calibration with 48 km/h data, predictions (Figure 8) are less accurate for calibration with 32 km/h data, making the overall (average) accuracy of the model lower. The predictions are overestimates of the observed friction values.
Even though the curve fitting is worse in this case (calibration with 64 km/h data) (Figure 9), better prediction accuracies have given an overall accuracy comparable to that of calibration with 48 km/h data (Figure 10). Friction values are overestimated at 32 km/h and 48 km/h and they are underestimated at 80 km/h.
The best curve fitting (Figure 11) was obtained for calibration with 80 km/h data. However, lower prediction (Figure 12) accuracies have resulted in less accuracy overall. Predicted friction values are overestimates of observed values for 32 km/h and 48 km/h and they are underestimates for 64 km/h.
8. CONCLUSIONS
An attempt was made to use the detailed LWST data effectively to obtain the 3-dimensional behavior of pavement friction vs. traveling speed and wheel slip. Results show that the combined PSU-Rado 3-D friction model can be used to achieve this purpose by calibrating the model parameters using raw LWST data in the 0 to 1 wheel slip range. The model can be calibrated with data at a single traveling speed. The calibrated model can then be used to predict friction vs. wheel slip at other traveling speeds. According to the results of this study, low speed (32 km/h) and high speed (80 km/h) calibrations provide lower prediction accuracies. Therefore, intermediate speeds (48 km/h and 64 km/h) are proposed to collect data for calibration. However, engineers may have a choice of the calibration speed by collecting data at several travelling speeds and evaluating the overall accuracy of the model at each calibration speed as performed in this study.
The prediction accuracy does not seem to be sufficient for advanced applications such as Antilock Braking Systems (ABS). However, the predictions are reasonably accurate for pavement management purposes (Network level analysis).
Further study of this application is suggested with data from pavements with a wide range of friction levels. This will lead to better judgment on the deviations in the predictions and also suitable adjustments to enhance the accuracy of the model.
9. ACKNOWLEDGEMENTS
This work is carried out as part of the establishment of a calibration center for runway friction measurement devices undertaken by University of South Florida using NASA funding (Account No. NNL06AA17A). The authors appreciate the help of International Cybernetics Company (ICC) in conducting the Locked Wheel Tests.
10. REFERENCES
[1] ASTM Standard E 1859 - 11, Standard Test Method for Friction Coefficient Measurements Between Tire and Pavement Using a Variable Slip Technique, ASTM International, West Conshohocken, PA, 2011. [ Links ]
[2] Fwa, T. F., Handbook of Highway Engineering: Pavement Skid Resistance Management. Taylor & Francis Group, 2006. [ Links ]
[3] ASTM Standard E 274 - 11, Standard Test Method for Measuring Skid Resistance of Paved Surfaces Using a Full-Scale Tire, ASTM International, West Conshohocken, PA, 2011. [ Links ]
[4] ASTM Standard E 1337 - 90(2008), Standard Test Method for Determining Longitudinal Peak Braking Coefficient of Paved Surfaces Using a Standard Reference Test Tire, ASTM International, West Conshohocken, PA, 2011. [ Links ]
[5] Rado, Z., Analysis of Texture Models, PTI Report No. 9510, Pennsylvania Transportation Institute (PTI), Penn State University, State College, Pennsylvania, 1994. [ Links ]
[6] Henry, J. J., Leu, M C., Prediction of Skid Resistance as a Function of Speed from Pavement Texture Measurements. In Transportation Research Record: Journal of the Transportation Research Board, No. 666, Transportation Research Board of the National Academies, Washington, D.C., pp. 7-13, 1978. [ Links ]
[7] Fuentes, L. and Gunaratne, M., Evaluation of the Speed Constant and its Effect on the Calibration of Friction Measuring Devices. Transportation Research Record: Journal of the Transportation Research Board, No 2155, Transportation Research Board of the National Academies, Washington, D.C., pp. 134-144, 2010. [ Links ]
[8] Wambold, J.C., Antle, C.E., Henry, J. J. and Rado Z., International PIARC Experiment to Compare and Harmonize Texture and Skid Resistance Measurements, 01.04.T.PIARC, 1995. [ Links ]
[9] Reyes, O. J., Alvarez, A. E. and Botella, R., Study of a Hot Asphalt Mixture Response Based on Energy Concepts, DYNA, 168, 45-52, 2011. [ Links ]
[10] ASTM Standard E 2157 - 09, Standard Test Method for Measuring Pavement Macrotexture Properties Using the Circular Track Meter, ASTM International, West Conshohocken, PA, 2011. [ Links ]
[11] ASTM Standard E 1960 - 07, Standard Practice for Calculating International Friction Index of a Pavement Surface, ASTM International, West Conshohocken, PA, 2011. [ Links ]
[12] Fuentes, L. and Gunaratne, M., Revised Methodology for Computing International Friction Index (IFI). Transportation Research Board, Paper No 11-0903, Transportation Research Board of the National Academies, Washington, D.C, 2011. [ Links ]
[13] Anderson, A. and Wambold, J.C., Friction Fundamentals, Concepts and Methodology, Publication TP13837E, Transport Canada, 1999. [ Links ]
[14] ASTM Standard E 524 - 08, Standard Specification for Standard Smooth Tire for Pavement Skid-Resistance Tests, ASTM International, West Conshohocken, PA, 2011. [ Links ]
[15] ASTM Standard E 1911 - 09, Standard Test Method for Measuring Paved Surface Frictional Properties Using the Dynamic Friction Tester, ASTM International, West Conshohocken, PA, 2011. [ Links ]


