Serviços Personalizados
Journal
Artigo
Indicadores
-
 Citado por SciELO
 -
 Acessos
Links relacionados
-
 Citado por Google
 -
 Similares em
SciELO
 -
 Similares em Google
Compartilhar
DYNA
versão impressa ISSN 0012-7353
Dyna rev.fac.nac.minas vol.80 no.180 Medellín jul./ago. 2013
SIMULATION BASED ON SYSTEM DYNAMICS FOR EVALUATING THE QUALITY OF TRANSPORT SERVICE IN A COMPLEX SOCIAL SYSTEM
SIMULACIÓN BASADA EN DINÁMICA DE SISTEMAS PARA EVALUAR LA CALIDAD DEL SERVICIO de TRANSPORTE EN UN SISTEMA SOCIAL COMPLEJO.
MAURO CALLEJAS CUERVO
MSc., Universidad Pedagógica y Tecnológica de Colombia, Software Research Group, maurocallejas@uptc.edu.co
HELVER AUGUSTO VALERO BUSTOS
MSc., Universidad Antonio Nariño, Colombia evalero@uan.edu.co
ANDREA CATHERINE ALARCÓN ALDANA
MSc.,Universidad Pedagógica y Tecnológica de Colombia, Software Research Group, Andrea.alarconaldana@uptc.edu.co
Received for review January 15th, 2013, Accepted March 26th, 2013, final version July, 12th, 2013
ABSTRACT: This report presents the creation and simulation of a model based on system dynamics, applied to a complex system, in this case a system of urban public transport for medium-sized cities, evaluating the service quality variables based on comfort and speed. Simulation was performed in four scenarios, in which the value of the variable "Time interval of dispatches" was modified, as it corresponds to an attribute of the operational planning of transport and is subjected to change without altering the physical infrastructure of the road network. This analysis showed the necessity of changing the interval when sending vehicles at peak hours to improve service quality.
KEYWORDS: System Dynamics, simulation, complex systems, quality of service.
RESUMEN: Se presenta la creación y simulación de un modelo basado en dinámica de sistemas, aplicado a un sistema complejo, en este caso un sistema de transporte público urbano para ciudades intermedias, generando la evaluación de la calidad del servicio basado en las variables comodidad y rapidez. Se realizó la simulación con cuatro escenarios en los cuales se modificó el valor de la variable "Intervalo de tiempo de envío de despachos", ya que corresponde a un atributo de la planeación operativa del transporte y es susceptible de cambiar sin alterar la infraestructura física de la red vial. Con el análisis realizado se denota la necesidad de variar el intervalo de envíos de vehículos para mejorar la calidad de servicio que presta el sistema.
PALABRAS CLAVE: Dinámica de sistemas, simulación, sistemas complejos, calidad de servicio.
1. INTRODUCTION
Models used in planning the operation of passenger Urban Public Transport systems (UPT) in medium-sized or intermediate-sized cities have their own characteristics that make them very different from those used in large cities. For analyzing and modeling these systems (called complex because the measurements of variables that influence the system are not exact values), static techniques and methodologies are used. The effectiveness of the results obtained in the model can be proven only when the model itself is introduced, which in practice represents a high cost. Furthermore, transportation operational analysis by using computational techniques has had few studies regarding the measurement of complex variables such as comfort and speed, which are characteristics of the quality of the service provided in a UPT system.
In the area of transport and in the context addressed by this study, some works based on simulation models that propose strategies to improve the quality of transport of persons and objects in an urban road network [1] have been proposed [2-4]. Nevertheless, most studies are aimed to assess and analyze the impact of specific factors in traffic flow within a city. Gonzalez [5] proposes a traffic model for the city of Puebla (Mexico) to analyze different situations through simulation. In terms of the works done in simulation for transport systems, it is important to mention that they are focused on large cities having a mass transit system. Ortiz and Serrano for example [6] propose a model based on discrete event simulation for evaluating mass transit systems using queues. Rall [7] proposes alternatives based on an urban dynamic analysis to reduce the impact of noise from traffic in urban areas. Mauttone, Cancela and Urquhart [8] present a work related to the design and optimization of routes and frequencies in urban public transport. Moller [9] shows the current state of public transport services in general (including UPT), in which he points out that it is deficient in terms of the quality of the service provided. Also, in the work named "Dynamics of Retamar-pasto systems from the center of the Iberian Peninsula" [10], the authors create causal diagrams for complex systems. It also shows the extent of system dynamics and the treatment of these kinds of systems.
Given the above, this work embodies the development of a model based on system dynamics, which simulates the behavior of a UPT operational system in intermediate-sized cities, obtaining results from the evaluation of the quality of the service provided, according to its comfort and speed. Thus it is possible to analyze the operation of a route's programming, from the creation of scenarios to demonstrate the behavior generated in several situations, when their specific characteristics vary in the system.
The model proposed here is developed in six stages: problem definition, system conceptualization, formalization, model behavior, model evaluation and model operation. These steps are described in the body of this document, which begins with the description of the complex system to be simulated, then presents the development of the model and finishes with the conclusions.
2. DESCRIPTION OF THE COMPLEX SYSTEM TO BE SIMULATED
An Urban Public Transport (UPT) system in intermediate-sized cities (less than 150,000 inhabitants) was taken as a case study. In this system, the service quality was evaluated through an analysis of the comfort and speed variables. The process of traveling in a UPT vehicle begins when a person makes the decision to travel from their place of departure to their destination point. For this, they should go to the bus-stop that offers the right transport route. Once there, they should wait a while for a bus and then wonder: "Is this my route?". If the answer is negative they should continue waiting. Otherwise the next question would be: "Is this the kind of bus I like? ". If so they make the stop signal, but if it is not, they wonder: "Do I have enough time to get to my destination?". If the answer is yes, they wait for another vehicle of their choice and route, but if they do not have enough time, they stop the bus and make the trip. If they make the stop signal and the vehicle does not stop, they have to wait for another vehicle. Otherwise, they check if there is room. If so, they get on the vehicle and wonder if there are available seats. If there are, they sit down, otherwise they travel standing. Every time the vehicle stops, they wonder whether that is their stop. If it is, they get off the vehicle. If not, they remain in their place (if sitting); but if they are not sitting, they analyze whether there are now available seats to sit down. This part of the process is repeated until they get to their destination point. Finally, they get off the vehicle and walk to their final destination. That process is performed by every person using the UPT. Those users have certain characteristics such as age, gender and preferences in choosing a transport vehicle. They are the generators of the trip and, in general, they have a reason to travel, a schedule, a departure and a destination point. In addition, the time and distance from the starting point to the bus-stop, the time the trip lasts and the time from the moment they get off the vehicle to their final destination were also taken into account.
Another process involved in the system is the one done by the vehicle, which begins its process in the so-called transport terminal. The driver of the vehicle checks repeatedly if it is his departure time and if he is allowed to cover a route. If not he must wait, otherwise the vehicle begins to move. The driver has yet to comply with different kinds of vehicle stops, such as mandatory stops (stop signs, intersections, traffic lights); in case of finding any, the vehicle is stopped until it is allowed to continue. In case of a person making the stop signal, the vehicle stops (only if there are available seats) allowing the person to make the decision to get on it or not. After that, the vehicle continues its trip. When it reaches a bus-stop, the vehicle stops and a timeout starts. At the end of this timeout -or sooner, according to the driver's will-, the vehicle continues traveling. This process is repeated until the vehicle arrives at the last stop of its assigned route. This procedure is fulfilled by every vehicle covering a route. The characteristics of those routes are an itinerary including starting and final points to cover in a defined time; stopping points with predefined timeouts, as well as having an associated fee, and a departure and arrival time.
Experimental Scenarios: for the creation of scenarios the city of Tunja was chosen, specifically the route covering Reten South and Muiscas neighborhoods, which is one of the most important south-to-north routes of the city and has a total length of 8,370 meters.
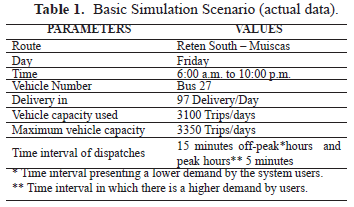
Actual data scenario: the route's programming for a critical business day was chosen -Friday in the city of Tunja because activities increase-. The collected data for this scenario are those currently implemented in the UPT system in the city of Tunja. Information of basic simulation parameters is observed in Table 1. The simulation horizon is one hundred and eighty (180) days.
In this research, several scenarios were established, which allowed the simulation and analysis of the behavior of the route. That is, in addition to the actual data in Table 1 other scenarios were created varying the dispatch time interval parameter as follows:
- Alternative: 17 minutes during off-peak hours and 4 minutes during peak hours.
- Alternative 1: 10 minutes during off-peak hours and 8 minutes during peak hours
- Alternative 2: 30 minutes during off-peak hours and 3 minutes during peak hours.
3. SIMULATION PROCESS
The modeling was done with system dynamics, in which the main stages of the methodologies proposed by Jay Forrester [11] Javier Aracil [12] and Gilbert and Troitzsch [13] were used, since they allow feedback in social systems.
3.1. Definition of the Problem
The UPT is considered a public service and as such it should have a wide coverage, providing a suitable service quality; if the quality of service perceived by users is not satisfactory, they could leave the system. The latter would represent higher social and economic costs to the State, and also would have environmental implications due to an increase in private transport. Moreover, nowadays small and intermediate-sized cities- as in the case of the city of Tunja- do not have a computational tool to assess the effect on their quality of service (in terms of comfort and speed), and no tool exists to simulate the behavior of this situation in order to propose solutions to the abnormal performances of this service.
The simulated period lasts 180 days, which corresponds to the timetable (distribution dispatch in a day), normally used by the transport companies of the selected city. This is the same period of time transport companies have established for fleet usage in order to provide an equitable allocation to each of their members (vehicle owners).
The following elements were identified to achieve a system description of elements that are likely to be studied and that take part in the problem of UPT operation programming in space and time.
- Demand: the demand-related elements of the service are characterized mainly by the traveling of people (journey performed by a person in a vehicle from a starting point to a destination one), which are created at the poles of trips' generation covered by the studied UPT route. The following factors are identified:
- potential trips: number of trips generated for the route over a given period of time
- fulfilled trips: number of trips done within the UPT system
- trips generated in a period: number of trips generated in the city, for the studied route over a period of time
- acceptable quality trips: trips rated with a quality level higher than 3.0
- unacceptable quality trips: trips rated with a quality level lower than 3.0
- new trips: proportion of trips generated in a given period of time increasing potential trips
- incapacity service: proportion of trips that were not provided due to a supply shortfall
- dropout: number of non-served trips due to the incapacity of service. Or the number of trips that are not adequately served
- return: proportion of trips that are used again after the dropout of the system. It is considered that the return trip is made every 2 time units
- quality: average assessment given to comfort and speed of the trip by users of the system at a given time
- travel generation rate: percentage of new trips generated in the given time period, associated with the growth characteristics of the population of the city and to permanent changes related to the activities carried out by its inhabitants.
- return rate: the rate of UPT users returning after some time
- dropout rate: rate of people definitely leaving the UPT system
- permanent abandonment: people definitely leaving the UPT system
- Offer: The UPT service supply is composed of several elements that take part in the operation and that affect the system's behavior. Among these are:
- dispatch: dispatch number (trips) per unit of time assigned to the studied route, taken from the microscopic simulation.
- dispatch capacity: average of the maximum number of passengers that can be transported in a vehicle in a dispatch, generated by the microscopic simulation
- dispatched trips: maximum number of trips that the route is able to serve
- level of service: quality of the service provided to the UPT system users at a given time. According to Dueñas [14], the service level is assessed on a scale of 0.0 to 5.0, as follows: excellent if the value is higher than 4.5; good, if it goes from 3.5 to 4.5; fair, from 2.5 to 3.4; bad from 1.5 to 2.4, terrible from 0.5 to 1.4 and finally, unacceptable if the score is lower than 0.5.
3.2 System Conceptualization
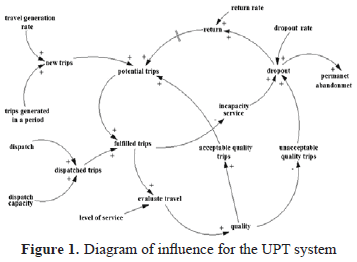
In this phase, the different elements of the problem description were defined, and the influences that occur between them are outlined, which is summarized in the diagram of influence generation shown in Figure 1.
Figure 1 shows the elements of the system and the way they influence or affect each other. The following describes the identified major causal feedback cycles involved in the system's behavior.
Potential trips have a permanent increase due to the population growth of cities, to the increase of the economic activities in the cities, and to the generation of urban infrastructure problems. All these create the need for users of other transportation means to use this service for their mobilization within the city.
For the model, the dispatched trips is considered to be a constant, because it is what really happens in practice; transport companies adapt the volumes and types of their fleet for months or years, and therefore, their dispatch frequencies. This is done under regulatory bodies' permission or requirement.
The quality of service, regarding its speed and comfort during the trip, is inversely proportional to the volume of daily potential users of the system, i.e., as the demand for the service increases (due to the periodic generation of new trips and the eventual return of users who had left the system) the quality of service is reduced since the capacity offered remains constant. The system regulates itself with the dropping out of UPT users toward other transport means such as individual public transport or private transport, when users are not satisfied with the quality of service they receive. This reduces the demand for the service and, thus, improves the quality of service for the users who remain in the system. When the quality increases, users tend to remain in the system, making it attractive for new users and users from other means. This behavior takes place until the system finds an equilibrium point where the quality of service reaches a level of acceptance by users.
The dropout by UPT users who change to other transportation means is affected by a fraction of those users who were not served in a day or who were not satisfied with the quality of service, so they decided to use another means of transport. From these users, a fraction tends to return to the system after a while, once they have adjusted their activities schedule to the supply of the service, or when they know about some improvements in the service quality. This phenomenon is reflected in the model as a causal relationship delay.
3.3 Formalizacion
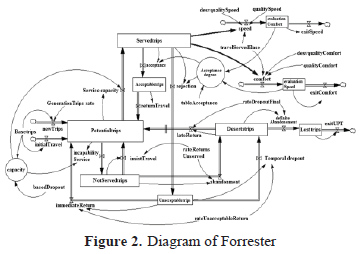
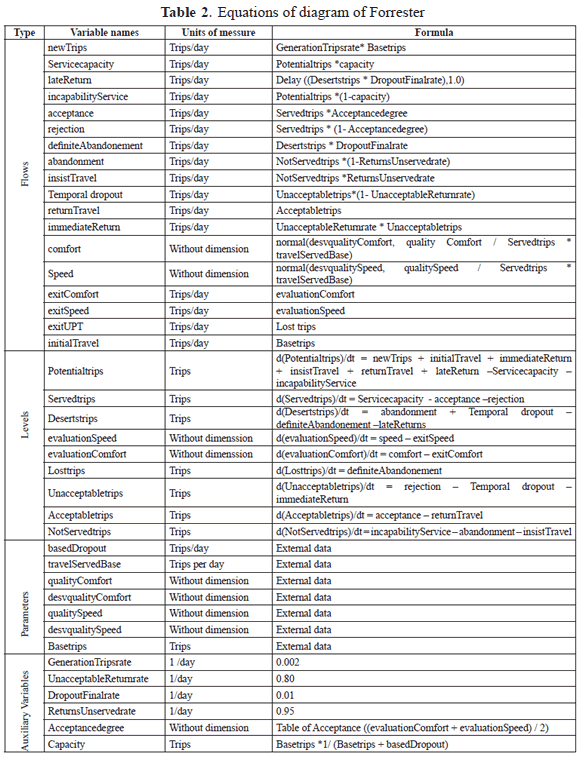
In this phase, the diagram of influences -reached in the previous stage- becomes a flow-level diagram or Forrester's, this corresponds to the model to simulate. Figure 2 shows the model developed in Vensim[15].
3.4 Behavior of the Model
When analyzing the behavior of the system, the effect of service quality in coverage can be seen. When the quality of the service is low, potential trips are reduced due to the dropout of users switching to other transport systems. As users leave the system and the supply remains constant, the quality of service increases to a point of acceptance for them, so that a balance point is achieved, in which the volume of dropout approaches the number of new UPT system users. This quality measure cannot be considered as optimal since the coverage of the system is reduced. To achieve a satisfactory quality measure the scenario should be modified, with a schedule of the operation that increases the supply and achieves a reasonable coverage to provide this service.
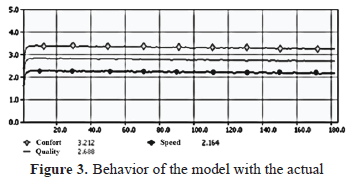
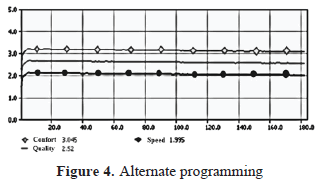
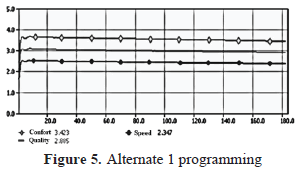
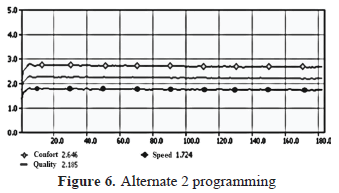
In Figures 3 to 6, the trends of the behavior of the service quality perceived by users are observed, on axis Y and the grade (0.0 to 5.0) is shown; and on axis X, the simulation horizon (days) is shown.
3.5 Evaluation of the Model
In the evaluation phase, the results obtained by applying the model were compared to the projections given by specialists, who confirmed that the information derived from this study shows a similar behavior to that of the real system. This allows competent authorities to make decisions based on these simulations.
The behavior of the system in the simulation with actual scenario data (Figure 3) presents an evaluation of the quality of service of 2.68 (on a scale of 0-5), considered as fair. Regarding the trips, it is noticed that from 4523 possible trips, 3675 were served or effective; and from these, 2875 user evaluated the service delivered as acceptable. There was also a dropout of 202 people.
Figure 4 shows that the rating of the quality of the service was 2.52, which is a fair service quality. In this scenario (Alternate), 4547 potential trips were generated (number of candidates to use the service), from which 3467 used the service (number of people using the transport service). The assessment of acceptability was given by 2457 trips (number of people satisfied with the service provided), and 256 users left the UPT system.
The simulation with data from Alternate scenario 1 (Figure 5) shows that the quality rating was 2.88 (fair), evaluated in this way by 3514 users of 4065 doing the total trips served (given the 4334 potential trips). In this scenario the dropout was 123 users.
On the other hand, Alternate scenario 2, as shown in Figure 6, showed a rating of the quality of service of 2.18, which is considered bad. In this simulation, 4577 potential trips were given, from which 3096 were served, and from these, 1766 users evaluated the service as acceptable. In this scenario the dropout was 340 users (or trips). According to the analysis of the behavior of the models described, it is possible to deduce that the scenario approaching the acceptability of the service is Alternate scenario 1 (Figure 5) since it obtains a dropout rate lower than in the other scenarios. Also, the worst simulated scenario is shown in Figure 6, due to the fact that the parameter "time interval of dispatches", is unevenly distributed over non-peak hours (30 minutes) and peak hours (3 minutes), which does not compensate for the number of system users.
3.6 Exploitation of the Model
This last phase is used to analyze alternative policies that can be applied to the UPT system, being a useful tool for analysts of the operational planning of transport in the city of Tunja. The main recommendation from the analysis of the simulation results, is that the frequency of sending each vehicle must be appropriate and the time when each bus station receives the users, the time that the trip lasts, and the level of comfort that is supposed to be offered by the actual system must be taken into account. Other proposals implementing the model and analysis are beyond the scope of this research but it remains for companies supplying the service of UPT to implement policies in order to increase quality.
4. CONCLUSIONS
By using the simulation model, it was possible to manipulate the system's comfort and speed variables, thanks to the fact that the system dynamics allows the treatment of complex variables and the variation of levels and flows according to the simulation horizon selected.
The simulation model allows the deficiencies of the real system to be identified. Through the analysis of the system's behavior in different scenarios, it was possible to propose alternatives for improvement without incurring the high costs of implementation; this is what happens with static strategies- which are sometimes not optimal for the company since they are only measurable and assessable after the strategy's implementation time.
In creating the model, it was possible to verify the effectiveness of the methodology chosen -taking into account the analysis of specialists in the field- since it was possible to compare the results of previous evaluations to the data obtained in the computer model, finding that the latter provides results at lower cost, in less time, and with high effectiveness in improving the quality assessment in providing transportation service.
The model's design allows the manipulation of the input parameters so it can be easily configured with real data from other cities with similar characteristics to the ones analyzed in this study, making it a possible solution replicable in other settings.
The results shown in Figures 4 to 7 demonstrate that UPT system users rate speed higher than comfort, making the quality grade low, since, on average, the difference between both scores is a unit.
The results obtained with the different simulated scenarios settings allowed to show that in non-peak hours dispatches should not be as frequent as in peak hours. The model also allows variables to be set so that accurate times for dispatches could be analyzed, making the assessment of UPT system quality service appropriate or satisfactory.
REFERENCES
[1] Kenneth R. H., Unjamming Traffic with Computers, Scientific American, October 1997. [ Links ]
[2] Bottom, J., Ben-Akiva, M., Bierlaire, M., Chabini, I.; Koutsopoulos, H. and Yang, Q. Investigation of Route Guidance Generation Issues by Simulation with Dynamit, International Symposium Pergamon on Transportation and Traffic Theory 1999. [ Links ]
[3] Nguyen Q., Pascal A. and Estraillier, P. Multi-agent Architecture with Space-time Components for the Simulation of Urban Transportation Systems, Proceedings of EWGT2012 - 15th Meeting of the EURO Working Group on Transportation, Volume 54, 4, pp. 365-374, 2012. [ Links ]
[4] Angel, P., and Marín L., A Computational Method to Obtaint Optimal Paths in Road Networks, Dyna, año 78, Nro. 167, pp. 112-121, 2011. [ Links ]
[5] Calleros, J., How to Improve Traffic Flow through the Simulation?, Computer Science. Institute of Astrophysics, Optics and Electronics. Puebla, Mexico, 2012. [ Links ]
[6] Triviño, J. and Serrano, L. Simulation of mass transit systems, Engineering and Research Journal, vol. 26, no. 1, pp. 51-57, April, 2006. [ Links ]
[7] Rall, J., Urban Dynamic Analysis: New Approaches to Act against Noise. School of Architecture, Planning and Design. National University of Rosario. Rio Bamba. Argentina. Available at: http://www.fceia.unr.edu.ar/acustica/biblio/adu.pdf. November 2012. [ Links ]
[8] Mauttone, A., Cancela, H. and Urquhart, M. Design and Optimization of Routes and Frequencies in Urban Public Transport, Models and Algorithms. Montevideo, Uruguay. In: http://www.fing.edu.uy/inco/pedeciba/bibliote/reptec/TR0307.pdf, November 2012. [ Links ]
[9] Moller, R., A Proposal for Improving Public Transportation in Santiago de Cali. Ingeniería y Competitividad, Universidad del Valle. fasc.1 vol.3, pp. 11 - 22, 2001. [ Links ]
[10] López, A. Dynamics Retamar-Pasto Systems Center of the Iberian Peninsula, University of Alcalá, Available at: http://www.uah.es/estudios/postgrado/detalle_proyectos.asp?CdPlan=D188&expe=79&proy=2. November 2012. [ Links ]
[11] Forrester, J. W. Urban Dynamics. Productivity Press. 1969. [ Links ]
[12] Aracil, J. System Dinamics. ISDEFE C / Edison. Madrid. pp. 58. 1995. [ Links ]
[13] Gilbert, N. and Troitzsch, K., Simulation for the Social Scientist, Open University Press. 1999. [ Links ]
[14] Dueñas, D., Urban Paper: Editorial, Universidad Pedagógica y Tecnológica de Colombia, Tunja. 1997. [ Links ]
[15] VENSIM. Simulation software. Available at: http://vensim.com/vensim-software/. October 2012. [ Links ]


