Services on Demand
Journal
Article
Indicators
-
 Cited by SciELO
 -
 Access statistics
Related links
-
 Cited by Google
 -
 Similars in
SciELO
 -
 Similars in Google
Share
DYNA
Print version ISSN 0012-7353
Dyna rev.fac.nac.minas vol.80 no.182 Medellín Nov./Dec. 2013
A NOVEL FUZZY PARAMETER FOR GROUND FLASH DENSITY
UN PARÁMETRO DIFUSO NOVEDOSO PARA DENSIDAD DE DESCARGAS A TIERRA
CAMILO YOUNES
Ph.D. Universidad Nacional de Colombia, Caldas, Colombia, cyounesv@unal.edu.co
ÓSCAR DUARTE
Ph.D. Universidad Nacional de Colombia, Bogotá D.C., Colombia, ogduartev@unal.edu.co
JUAN PULGARÍN
M.Sc. Universidad Nacional de Colombia, Caldas, Colombia, jdpulgarinr@unal.edu.co
Received for review October 8th, 2012, accepted April 4th, 2013, final version April, 10th, 2013
ABSTRACT: Lightning parameters such as ground flash density GFD have been determined using mainly deterministic methods and in the last 20 years the main source of information has been lightning location systems (LLS) data. GFD has some problems like the dependence on the area of the grid studied, strong variations between data in closer points of the grid and its low descriptive capability. Additionally LLS introduce other problems due to the location accuracy that must be in accordance with the area of the grid to be studied. This paper presents a novel fuzzy parameter to calculate ground flash density using modern computational techniques. The new parameter called Fuzzy Ground Flash Density (FGFD) can deal with the problems related to the GFD parameter itself and the location accuracy of the LLS. FGFD gives a better representation of the phenomena and it is more adequate for practical problems especially in engineering subjects such as lightning location systems design and lightning risk assessment. Some examples were created to demonstrate the validity of the new parameter and a real case using the Colombian LLS data is shown.
KEYWORDS: Lightning, Ground Flash Density, Fuzzy Sets.
RESUMEN: Algunos parámetros del rayo, tales como la densidad de descargas a tierra DDT se han determinado usando principalmente métodos determinísticos y en los últimos 20 años la principal fuente de información han sido los datos de los sistemas de localización de rayos (SLR). La DDT tiene algunos problemas como la dependencia del área de la malla que se va a estudiar, las fuertes variaciones entre los datos en puntos cercanos de la malla y su baja capacidad descriptiva. Adicionalmente los SLR introducen más problemas debidos a la precisión en la localización que debe estar en acuerdo con el área de la malla que se va a estudiar. Este artículo presenta un parámetro difuso novedoso para calcular la densidad de descargas a tierra usando técnicas computacionales modernas. El nuevo parámetro llamado Densidad Difusa de Descargas a Tierra (DDDT) puede tratar con los problemas relacionados al parámetro de DDT en sí y con la precisión en la localización de los SLR. La DDDT proporciona una mejor representación del fenómeno y es más adecuado para problemas prácticos, especialmente en temas de ingeniería tales como diseño de sistemas de localización de rayos y evaluación de riesgos por rayo. Algunos ejemplos fueron creados para demostrar la validez del nuevo parámetro y se muestra también un caso real usando datos de un SLR Colombiano.
PALABRAS CLAVE: Rayos, densidad de descargas a tierra, conjuntos difusos.
1. INTRODUCTION
Nowadays, most lightning parameters are obtained using Lightning Location Systems data that are generally stored in large databases [1-4]. Nevertheless such parameters are still calculated with traditional methods without taking into account modern computational methods and techniques despite great advances specially in the last 20 years in subjects such as data mining [5-8] and fuzzy logic [9, 10], [11-13] that can obtain potentially useful and previously unknown information.
One of the most important lightning parameters is Ground Flash Density (GFD). This parameter has been calculated for almost 50 years since Pierce [14] and Golde [15] made their famous lightning counters, and during the last 25 years using lightning location systems (LLS) data.
GFD has been continuously displacing another important parameter; the Keraunic Level, because it is too weak to detect storm severities and small areas with high GFD values.
Unfortunately GFD has some problems specially related to LLS performance that is characterized by its location accuracy and detection efficiency that make GFD dependent on these aspects, which some studies on GFD have shown, as well as other additional problems specially in engineering subjects like lightning protection systems design and lightning risk assessment [16-24].
Basically, GFD has been calculated in a deterministically way, choosing an area and counting the number of flashes that strikes the ground in a given period usually a year, so its units are [Number of flashes/km2·year]. Using possibility and fuzzy set theories terminology we can describe the traditional GFD calculation as a "crisp" set (CGFD).
It is well known that such CGFD has the following problems [25-30]:
- Area Dependence: CGFD depends strongly on the area or region selected.
- Hard Variation: CGFD calculated for two points geographically adjacent can have extremely different values.
- Low descriptive capability: Due to past two items, CFGD weakly describes the phenomenon that it intends to represent.
Fuzzy logic has had increasing applications in different branches of engineering, as it can be seen in works such as those presented by Moreno and Ovalle, and Escobar et al. [31, 32]. In order to solve the problems detected for CGFD, a new parameter is defined by means of the fuzzy sets theory, we call it "Fuzzy" Ground Flash Density (FGFD). It is shown that FGFD is a parameter that better represents the phenomena, that it can be implemented easily and it solves the problem with location accuracy that affects the classical GFD estimation.
This paper is organized as follows. Section 2 contains some examples that explain the problems with CGFD. Section 3 presents the new concept of Fuzzy Ground Flash Density with its mathematical description. Section 4 shows the validation of the FGFD parameter by means of some empirical experiments and real examples. Finally Section 5 and Section 6 present a final discussion and the conclusions of the paper respectively.
2. FUZZY SET CONCEPTS
Zadeh first introduced fuzzy sets in his seminal work of 1965 [15]. A fuzzy set is a set whose elements may be partially included in it. The classical theory of sets does not allow partial inclusion of elements in a set; in classical (crisp) sets an element is or is not included in a set and there is no other option. We call this assertion the "third excluded principle".
However, when we deal with fuzzy sets every element has a degree of membership to the set whose value is greater than or equal to zero and less than or equal to one. In other words, given a fuzzy set A and an element x, we define mA(x) the degree of membership of x to the fuzzy set A. It satisfies:

Using this notation, we can define a fuzzy set A over the universe of discourse U as a collection of pairs x, mA(x):

Zadeh also proposed the following notation: suppose the discrete Universe of Discourse U

And a fuzzy set A defined on U. The Zadeh notation for A is:
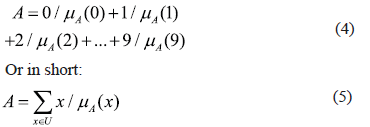
The expression above is not an addition it is just a notation. If the Universe of Discourse U is continuous (for example U = R) we modify the notation:

Cardinality is the number of elements in a set. For a fuzzy set A over a discrete Universe of Discourse U the cardinality C{A} is defined by:

If the Universe of Discourse U is continuous its cardinality is

The concept of fuzzy sets has been widely extended and used. For an introduction from an engineering perspective see Mendel [33]. Classical texts about fuzzy sets fundamentals and applications are the text of Driankov [34] and the text of Klir [11].
3. EXPLANATION OF CGFD PROBLEMS
In order to describe the main problems that affect CGFD, 3 examples are presented.
3.1. Example 1
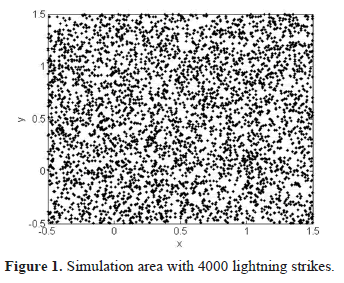
Assuming that the geographical area under study is the square [−0.5, 1.5] × [−0.5, 1.5]. Inside it 4000 lightning flashes striking in random coordinates have been simulated. Each coordinate has a uniform distribution; figure 1 shows the simulated strikes in the area.
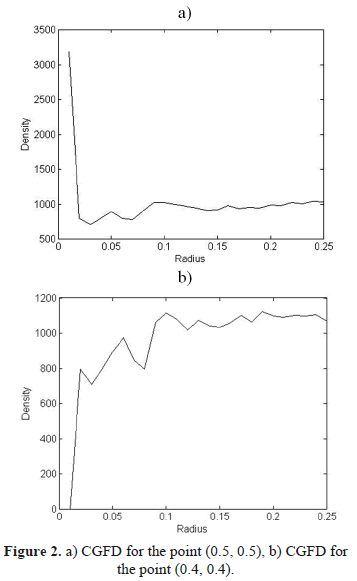
In order to show the effect of the area used to evaluate the CGFD, the latter was calculated with different areas varying the radius of the circle centered at the point (0.5, 0.5) and (0.4, 0.4).
Figure 2 (a) and b)) shows the CGFD variation increasing the radius of the evaluation area, it can be observed that the CGFD value is affected by the area of evaluation and is not the same for two different points, (0.5, 0.5) and (0.4, 0.4) respectively.
3.2. Example 2
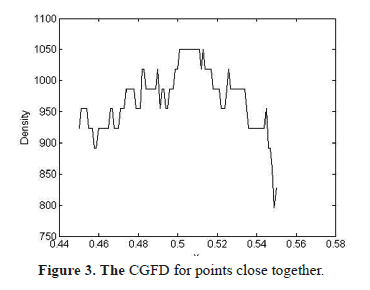
Using the same set of simulated flashes as example 1, CGFD has been calculated for different points at coordinates (x, 0.5) with x ∈ [0.45, 0.55] using a radius of 0.1. The result of this simulation is shown in figure 3 where can be observed that even if the points are close together, their CGFD values can vary substantially.
3.3. Example 3
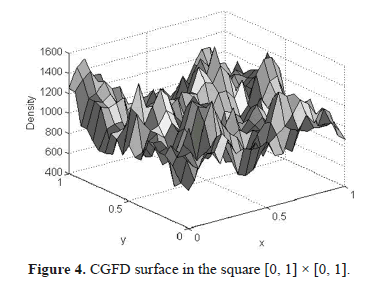
Using the same set of simulated flashes as example 1 again, CGFD has been calculated for 400 equally spaced points in the square [0, 1] × [0, 1]; a circular region with radius 0.05 has been used. The results are shown in the surface plot in figure 4.
It can be observed that even when the striking flashes were simulated using a uniform distribution that generates a global CGFD of 1000, the surface observed is rugged and presents values very different from 1000.
4. FUZZY GROUND FLASH DENSITY
The Fuzzy Ground Flash Density (FGFD) parameter proposed in this paper consists of defining a fuzzy region M around the point c whose coordinates are (cx, cy) used in order to calculate the FGFD in such a point or region. The (x, y) point membership function to the region M is defined as mM (x, y).
How many flashes strike the region M? Assume that N is the total number of flashes and pi the i − th flash that strikes the coordinates (xi, yi); the number of flashes NM can be obtained as shown by equation (9):

What is the area of the M fuzzy region? Defining the infinitesimal surface element dS centering on (x, y) and S as the total surface to be considered, the area AM of the fuzzy region is described in equation (10):

Then we can define the Fuzzy Ground Flash Density - FGFD at the point c as described in equation (11):

We can define M as a circle with a fuzzy border by means of the definition of a fuzzy radius. Working with a trapezoidal membership function mrR defined by a minor radius r and a major radius R as is described in equation (12).

Then, the membership mM(x, y) (cx, cy) can be obtained as is described in equation (13):

And the area AM can be calculated using equation (14):

This can be analyzed more easily using polar coordinates, in order to simplify we take (cx, cy) = (0, 0)
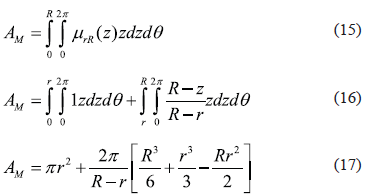
There must exist a circle with equivalent radius RE that has the same area as AM. RE can be calculated with equation (18):

It is clear that if instead of dividing by the equivalent area we divide by the minor radius area, the FGFD should be greater than the CGFD calculated with the same area (we count more flashes for the same area). On the other hand if instead of dividing by the equivalent area we divide by the major radius area the FGFD should be lower than the CGFD calculated with the same area (we count less flashes for the same area).
If we divide by the equivalent radius area, we have an intermediate value between the two situations, that is the reason that FGFD is less sensitive to the circle’s area, as it is an intermediate value between a small area (minor radius) and a big area (major radius).
Therefore we propose using FGFD in the same way as CGFD but calculating equivalent areas depending on the membership function.
5. EXPERIMENT
In order to validate the fuzzy novel parameter proposed, three more examples were designed, additionally a result using real data is shown, using the Colombian Lightning Location System data.
5.1. Example 4
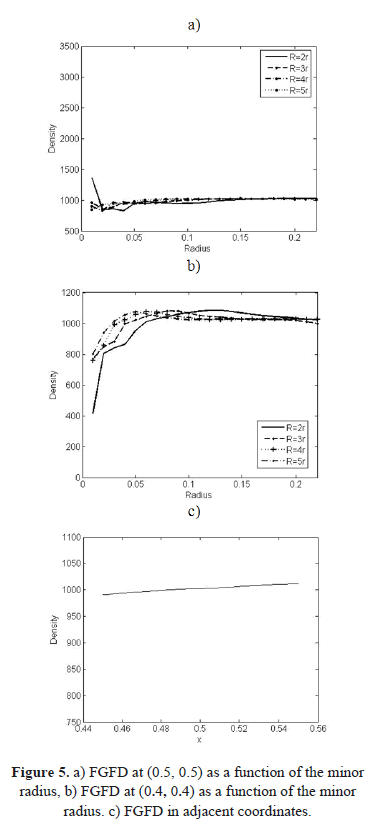
Using the same data as example 1, the FGFD has been calculated at the point (0.5, 0.5) for different values of minor radius r and the major radius R with values of 2r, 3r, 4r and 5r in order to plot the 4 curves shown in figure 5.
If figure 5 a) is compared with figure 2 a) it can be observed how the dependence on the radius is much lower using FGFD. An additional example was done at the coordinates (0.4, 0.4) obtaining similar results as shown in figure 5 b).
5.2. Example 5
Using again the same data as example 1, FGFD has been calculated for different points at coordinates (x, 0.5) with x  [4.5, 5.5], using a minor radius of 0.1 and major radius of 0.3. Results can be observed in figure 5 c).
If we compare the results of the example 5 with the ones of the example 2, it can be observed that using FGFD large variations of GFD values are avoided between points close together.
5.3. Example 6
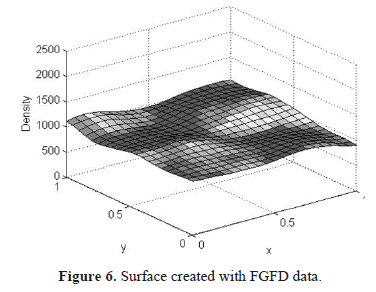
Similar to Example 3, FGFD was calculated for 400 coordinate points equally spaced in the square [0, 1] × [0, 1]. A circular region with minor radius of 0.1 and major radius of 0.3 was used. Figure 6 shows the surface created with the FGFD points.
If we compare the surface in figure 6 with the surface created in example 3, it can be observed that FGFD more accurately represents the 1000 lightning strikes generated with uniform distribution in the area under study.
5.4. Example using real data
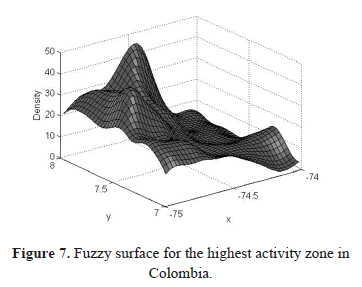
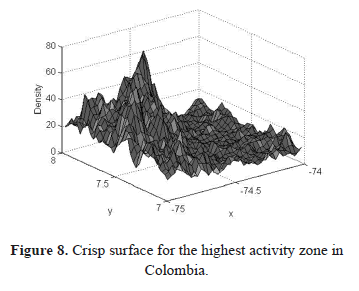
Using the Colombian Lightning Location System data, the CGFD and FGFD was calculated for the highest atmospheric activity zone with a grid of 3 km × 3 km, the region is a square 1º x 1º (111.11 km) with a center point located at (-74.5ºW, 7.5ºN). The membership function used in the FGFD case was a trapezoid, whose associated area, is a circle with a 3 km minor radius and a 15 km major radius.
Figure 7 and figure 8 show the fuzzy and crisp surfaces respectively for the zone under study. It is evident that the fuzzy surface is more adequate, without the strong variation that can be observed in the crisp surface. Despite the fact that the highest value in the fuzzy surface is lower than the one in the crisp surface, it represents the phenomena in a much better way.
6. FINAL DISCUSSION
FGFD calculating is basically a GFD data smoothing strategy. Like every smoothing technique it is possible to use it in the wrong way losing data and important details. Generally, excessive smoothing tends to homogenize data values and creates a reduction of the peak values of GFD.
On the other hand a deficient smoothing cannot allow either to know important patterns and generates higher GFD peak values. It can be observed in example 7 below.
Therefore the criteria to choose the minor and major radius values must be related to the expected degree of detail in the representation of the phenomena.
The following are some general rules to be taken into account:
- Select the major radius (R in equation 12), with a length larger than the distance between two adjacent calculation points (two grid points which are contiguous).
- Select a minor radius longer than 5% of the minimum separation between couple of flashes.
- Select a major radius shorter than the minimum level of detail that is required.
6.1. Example 7
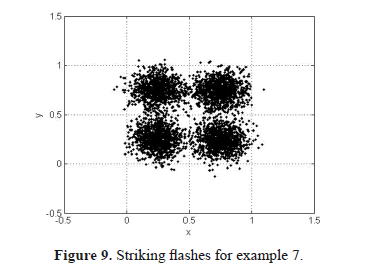
Inside the square [−0.5, 1.5] × [−0.5, 1.5] 4000 flashes striking in randomly coordinates have been simulated. The coordinates (x, y) of 1000 flashes have been generated using a Gaussian distribution with standard deviation of 0.1 centered on (0.25, 0.25); another 1000 flashes were generated using the same function centered on (0.25, 0.75); and two more groups of 1000 flashes were generated centered on (0.75, 0.25) and (0.75, 0.75). Figure 9 shows the distribution.
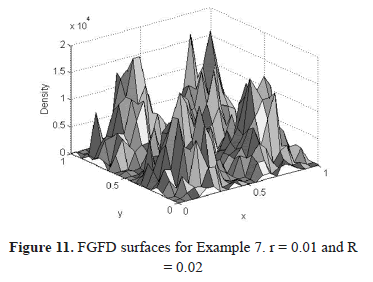
FGFD surfaces have been calculated for different combinations of minor and major radii. Such surfaces are shown in figure 10. It can be observed that an excessive smoothing (bigger radius) makes the Gaussian pattern disappear and reduces the FGFD peak values.
Additionally, figure 11 shows the effects of a deficient smoothing that give similar results to the crisp GFD; it is impossible to recognize the original patterns that generate the data.
7. CONCLUSIONS
Lightning parameters have been calculated in the last 20 years using LLS data in a traditional way not taking advantage of databases that store the information using modern computational methods like data mining and fuzzy logic.
Some previous studies have shown that the Ground Flash Density parameter calculated with LLS data presents some problems, specially related to its dependence on the area used to calculate the parameter, the strong variation of GFD values between close grid points and its low descriptive capability of the phenomena.
A novel fuzzy parameter called Fuzzy Ground Flash Density FGFD has been introduced in order to represent the phenomena in a better way.
FGFD can deal with problems related to the LLS performance like the location accuracy and the problems of the GFD calculated in a traditional way.
FGFD is obtained by means of a fuzzy area that depends on the membership function used.
The fuzzy area can be represented as a fuzzy circle with a minor and a major radius that must be determined by an analysis of sensitivity in order to obtain the better fuzzy area to represent the phenomena.
The implementation of this novel parameter with real data from the Colombian LLS has shown much better results especially with relation to lightning protection systems and lightning risk assessment.
REFERENCES
[1] Coquillat, S., Boussaton, M-P., Buguet, M., Lambert, D., et al. Lightning ground flash patterns over Paris area between 1992 and 2003: Influence of pollution?, Atmospheric Research, 122, pp. 77-92, 2013. [ Links ]
[2] Rodriguez, R. B., Mendes, V. M. F. and Catalão, J. P. S., Lightning Data Observed With Lightning Location System in Portugal, IEEE Transactions on Power Delivery, 25, pp. 870-875, 2010. [ Links ]
[3] Xie, Y., Xu, K., Zhang, T. and Liu, X., Five-year study of cloud-to-ground lightning activity in Yunnan province, China, Atmospheric Research, in press, 2013. [ Links ]
[4] Enno, S. E., A climatology of cloud-to-ground lightning over Estonia, 2005 - 2009, Atmospheric Research, 100, pp. 310-317, 2011. [ Links ]
[5] Delgado, M., Marín, N., Sánchez, D. and Vila, M.A., Fuzzy Association Rules: General Model and Applications, IEEE Transactions on Fuzzy Systems, 11, pp. 214-225, 2003. [ Links ]
[6] Sánchez, D., Adquisición de relaciones entre atributos en bases de datos relacionales [PhD Thesis]. Universidad de Granada, 2002. [ Links ]
[7] Piatetsky-Shapiro, G., Frawley W.J. and Matheus, C.J., Knowledge discovery in databases: An Overview, The AAAI Press, 1991. [ Links ]
[8] Agrawal, R., Imielinski, T. and Swami, A., Mining association rules between set of items in large databases. Proc. of the 1993 ACM SIGMOD Conference. 1993. [ Links ]
[9] Zadeh, L.A., Fuzzy Sets, Information and Control, 8, pp. 338-353, 1965. [ Links ]
[10] Zadeh, L.A., A computational approach to fuzzy quantifiers in natural languages, Comput. Math. Applicat, 9, pp. 149-184, 1983. [ Links ]
[11] Klir, G., Fuzzy Sets and Fuzzy Logic, Prentince Hall, 1995. [ Links ]
[12] Duarte, O., Aplicaciones de Lógica Difusa, Ingeniería e Investigación, pp. 5-12, 2000. [ Links ]
[13] Duarte, O., Sistemas de Lógica Difusa - Fundamentos, Ingeniería e Investigación, pp. 22-30, 1999. [ Links ]
[14] Pierce, E.T., Latitudinal variation of lightning parameters, J. Appl. Meteor., 9, pp. 194-195, 1970. [ Links ]
[15] Glode, R.H., Lightning, 1978. [ Links ]
[16] Younes, C., Lightning parameters evaluation in Colombia using terrestrial and satellital data [MSc Thesis]. National University of Colombia, 2002. [ Links ]
[17] Younes, C., Torres, H., Perez, E., Gallego, L., Cajamarca, G. and Pavas, A., Lightning parameters evaluation in the colombian highest atmospheric activity zone. Proceedings of ICLP 2004. [ Links ]
[18] Younes, C., Torres, H., Perez, E., Gallego, L., Montana, J., Herrera, J. and Vargas, M., A comparisson between satellital and terrestrial ligthning detection systems. Proceedings of ISH 2003. [ Links ]
[19] Younes, C., Torres, H., Perez, E., Gallego, L., Vargas, M., Montana, J. and Rondon, D., Colombian LLS performance and its correlation with the lightning imaging sensor - LIS. Proceedings of SICEL 2005. [ Links ]
[20] Gallego, L.E., Duarte, O., Torres, H., Vargas, M., Montana, J., Perez, E., Herrera, J. and Younes, C., Fuzzy risk analysis due to lightning in Colombia. Proceedings of ICLP 2002. [ Links ]
[21] Gallego, L.E., Duarte, O., Torres, H., Vargas, M., Montana, J., Perez, E., Herrera, J. and Younes, C., Lightning risk assessment using fuzzy logic, Journal of Electrostatics, 60, pp. 233-239, 2004. [ Links ]
[22] Torres, H., Younes, C., Salgado, M., Rondon, D., Perez, E., Quintana, C., Herrera, J., Montana, J. and Vargas, M., Ground stroke density in tropical zone. Proceedings of ISH 2001. [ Links ]
[23] Torres, H., El Rayo, National University of Colombia - UNIBIBLOS, 2002. [ Links ]
[24] Neuwirth, C., Spitzer W. and Prinz, T., Lightning Density Distribution and Hazard in an Alpine Region, Journal of Lightning Research, 4, pp. 166-172, 2012. [ Links ]
[25] Shultz, W., Cummins, K., Diendorfer, G. and Dorninger, M., Cloud-to-ground lightning in Austria. A 10-year study using data from a lightning location system, Journal of Geophysical Research, 110, 2005. [ Links ]
[26] Schultz, W. and Diendorfer, G., Detection efficiency and site errors of lightning location systems. Proc. of the 14th International Lightning Detection Conference, Tucson. 1996. [ Links ]
[27] Pinto, I.R.C.A., Pinto, O., Rocha, R.M.L., Diniz, J.H., Carvalho, A.M. and Cazetta, A., Cloud-to-ground lightning in the southeastern Brazil in 1993, 2. Time variations and flash characteristics, Journal of Geophysical Reseach, 104, pp. 31381-31388, 1999. [ Links ]
[28] Pinto, I.R.C.A., Pinto, O. and Naccarato, A.P., How ground flash density obtained by lightning location networks can be used in lightning protection standards: A case study in Brazil. Proc. of the 19th ICLD. 2006. [ Links ]
[29] Diendorfer, G. and Shultz, W., Lightning Characteristics Based on Data from the Austrian Lightning Locatiing System, IEEE Transactions on Electromagnetic Compatibility, 40, pp. 452-464, 1998. [ Links ]
[30] Torres, H., Younes, C., Salgado, M., Rondon, D., Perez, E., Quintana, C., Herrera, J., Montana, J. and Vargas, M., Variation of ground stroke density with latitud. Proceedings of SIPDA 2001. [ Links ]
[31] Moreno, J. and Ovalle D., Support Model for Electricity Trade Using Fuzzy Logic and Machine Learning, Dyna, 159, pp. 67-76, 2009. [ Links ]
[32] Escobar, A., Moreno, J. and Múnera, S., Modeling of Investment Strategies in Stocks Markets: An Approach from Multi Agent Based Simulation and Fuzzy Logic, Dyna, 163, pp. 211-221, 2010. [ Links ]
[33] Mendel, J., Fuzzy Logic Systems for Engineering: A Tutorial, Proceedings of the IEEE, 83, pp. 345-377, 1995. [ Links ]
[34] Driankov, D., An introduction to fuzzy control, Springer Verlag, 1993. [ Links ]


