Serviços Personalizados
Journal
Artigo
Indicadores
-
 Citado por SciELO
 -
 Acessos
Links relacionados
-
 Citado por Google
 -
 Similares em
SciELO
 -
 Similares em Google
Compartilhar
DYNA
versão impressa ISSN 0012-7353
Dyna rev.fac.nac.minas vol.80 no.182 Medellín nov./dez. 2013
PREDICTION OF FATIGUE LIFE FOR A TRANSVERSE FILLET WELDED JOINT AND ANALYSIS OF THE INFLUENCE OF CRACK ECCENTRICITY ON THE FAILURE
PREDICCIÓN DE LA VIDA A FATIGA DE UNA UNIÓN SOLDADA DE FILETE TRANSVERSAL Y ANALISIS DE LA INFLUENCIA DE LA EXCENTRICIDAD DE LA GRIETA EN LA FALLA
NELSON ARZOLA
Ph.D., Facultad de Ingeniería, Universidad Nacional de Colombia, narzola@unal.edu.co
OSCAR ARAQUE
Ph.D., (c), Departamento de Ingeniería Mecánica, Universidad de Ibagué, Colombia, oscar.araque@unibague.edu.co
Received for review May 6th, 2012, accepted December 6th, 2013, final version January, 9th, 2013
ABSTRACT: In this paper a procedure based on the Finite Element Method and Linear Elastic Fracture Mechanics to obtain a mathematical model of crack propagation in transverse fillet welded joints is presented. We used ASTM-A36 steel plates and E6013 electrodes for the joints, using shielded metal arc welding (SMAW) as the welding process. The model uses a surface crack located in the weld toe. Differences of up to 41% in crack growth rates were found between cracks located 90% out of the bead mid plane with respect to the central crack. The straight and convex bead profiles were employed and according to the results there were no significant differences in fatigue life for both kinds of bead profiles. The results of the models were compared with conventional weld calculations and validated with experimental tests. The theoretical fatigue life values were within the statistical confidence interval for p=95%.
KEY WORDS: Fatigue, welding, transverse fillet welded joint, eccentricity, Fracture Mechanics
RESUMEN: En este artículo se presenta un procedimiento basado en el Método de los Elementos Finitos y en la Mecánica de la Fractura Elástica Lineal para obtener un modelo matemático de propagación de grietas en uniones soldadas de filete transversal. Se empleó como material para las placas acero estructural ASTM-A36 y como material de aporte fueron utilizados electrodos E6013, usando un procedimiento de soldadura SMAW. Las grietas modeladas fueron de tipo superficial ubicadas en el pie de la soldadura. Se encontraron razones de propagación que difieren hasta en un 41% entre grietas centradas y con excentricidad de un 90%. Se emplearon cordones con perfil recto y convexo encontrándose una diferencia pequeña en la vida de fatiga entre ambos tipos. Los resultados de los modelos obtenidos fueron contrastados con el método convencional de cálculo y validados por medio de ensayos experimentales. Los valores de vida de fatiga se encontraron dentro del intervalo de confianza para p=95%.
PALABRAS CLAVE: Fatiga, soldadura, unión de filete transversal, excentricidad, Mecánica de la Fractura
1. INTRODUCTION
Steel structures on bridges, buildings, and industry are mostly assembled by using welded joints. The calculation methods used have basically not changed in recent decades, although all the specialists on the matter are aware of the simplifications employed. To cover this lack of exactitude in the design of welded joints, the welding norms use high design factors, thus, guaranteeing the structural integrity of these types of permanent joints.
In welded joints, different failure mechanisms operate affected by different factors like: geometrical configuration, technology used, environment in which they operate, and characteristics of the applied loads, among others. Undoubtedly, fatigue failure is the most catastrophic cause of damage in industrial components because it does not reveal previous signs of partial loss of functionality, except when using inspection planning Diverse types of defects can be provoked in welded joints, generated by factors like the welding regime, metallurgic characteristics, environmental conditions, and welder expertise, among other factors that affect the quality of the welded deposit. In most instances, defects in welds lead to the appearance of stress concentrators that accelerate crack growth due to fatigue. Alam [1] reported that crack-type defects of welding solidification may locally influence the field of stresses in the welded region. Researchers Sanders and Lawrence [2] studied the effect of the lack of penetration (LOP) and lack of fusion (LOF) on the fatigue behavior of an Al-5083-0 aluminum alloy with a double-V weld, concluding that defects due to LOP may seriously reduce the fatigue life of a welding joint, for welds with reinforcement and with the reinforcement removed. It is concluded that the LOF defect is less critical than the LOP defect. It has also been reported that the effect of internal discontinuities on fatigue is minimal for welds with reinforcement; porosities only become a negative factor when the reinforcement is removed. The work by Chin-Hyung Lee et al., [3] studies the influence of the geometry of the welding joint on fatigue resistance by using cruciform-shaped specimens. As a result, resistance to fatigue increases gradually with the increase of the welding flank angle and the radius of the weld toe. Additionally, it was discovered that the throat thickness of the weld bears little influence on the fatigue resistance of the joint. In another research, Balasubramanian and Guha [4], studied the influence of the size of the weld bead on the rate of crack growth for flux-cored arc welding (FCAW) in cruciform-geometry specimens. During the tests LOP was induced and a constant amplitude cyclic load was used. The main result was that the rates of crack growth are influenced by the location of the tip of the crack in the welding joint, these variations were attributed to changes in the microstructure provoked by the thermal cycle.
In welded joints, the presence of imperfections like solidification cracks, slag inclusions in weld toe, undercuts, or lack of penetration effectively accelerate the initiation phase of the fatigue [5]. In welded joints, the presence of stress concentrators associated with the geometry of the joint and with internal or surface defects is almost inevitable; these influence crack propagation by fatigue. It is also important to consider the influence on the bead geometry parameters of the welding process. Dorta et al. [6] reported experimental results where it was observed that the width, height and penetration of the weld bead decrease with increasing welding speed. The results of another study [7] indicate that the duration of the crack propagation life is from 75 to 89% of the total life for all types of joints studied. Due to this, the total fatigue life of the welded joints can be assumed to be dominated by the crack propagation stage.
Currently, design and operation criteria are widely accepted, which contemplate welds with imperfections; which only need to be repaired if the presence of defects is dangerous for the integrity of the structure [8]. A tool used by many researchers to establish welded-joint fatigue failure prediction models is the Finite Element Method. Guirao et al., [9] presented a detailed simulation using this technique for longitudinal welds. Horioka and Alencastre [10] studied stress distribution in typical welded joints subjected to design static loads, using the Finite Elements Method to evaluate the influence of some geometrical parameters. Sleczka [11] analyzed the low-cycle fatigue strain for welded joints employed in the assembly of H and I profiles, with reinforcement plates and with butt and fillet welds for load transmission. The procedure of stress analysis is presented, which was divided into a global analysis of finite elements, along with a local analysis for the region of the stress concentrator. As a result, fatigue life curves were obtained by using the equation based on Langer's formula. Furthermore, in this work a comparison between experimental and theoretical results was carried out for two groups of joints, a plate with a transverse butt weld and a plate with attachments respectively.
In the work by Tran and Pan [12], the analytical stress intensity factor and J integral solutions for resistance and friction stir spot welds are developed. Also, 3D finite element analyses were conducted to examine the accuracy of the results. Finally in this research, general trends and estimation methods of the stress intensity factor and J integral solutions at the critical positions of spot welds in lap-shear specimens of different materials and thicknesses are given for engineering applications.
These investigations mentioned above are focused on understanding the complex behavior of welded joints. Analytical and numerical models are employed to simulate the stress-strain fields in the weld bead location, and especially in the vicinity of fatigue cracks. In most of these studies a special effort to use refined meshes, higher order finite elements, contact boundary conditions of real situations and advanced constitutive material laws. It is common to find several kinds of limitations or simplifications in these models; for example, they do not use heterogeneous material properties in the heat affected zone (HAZ), and they do not account for interactions between flaws and fatigue cracks nor between multiple fatigue cracks. Likewise, residual stresses in non-homogenous fields are often not included in the simulations. The synergy between all these issues together with more powerful computational techniques will permit simulation results closer to the fatigue phenomena in welded joints.
This work develops modeling techniques and performs experiments that seek to provide mathematical models on the fractomechanical behavior of a transverse overlap welding joint. A set of closed-form solutions is proposed based on Fracture Mechanics obtained through the Finite Element Method, which permit evaluating the rate of crack growth of the welded joints of structural steel obtained through Shielded Metal Arc Welding (SMAW). The study seeks to increase the degree of accuracy in the calculation of fatigue life of welded joints, through prediction models of crack propagation.
2. MATERIALS AND METHODS
To justify the use of the analysis of a transverse lapped joint characterization was made of the three types of welded seams most commonly used in the construction of edifications, bridges, and industrial structures from the point of view of their geometry, mechanical properties, defects, and resistance to fatigue failure. This characterization determined that the transverse overlap configuration is one of the most used as a structural welded joint solution. Also, different types of technologies were analyzed to obtain the welded joint, among which there are: ordinary or alloy welding, gas welding, arc welding, shielded metal arc welding, arc welding with flux powder, aluminothermic welding, pressure welding, resistance welding, and ultrasonic welding among others. Of the prior, shielded metal arc welding (SMAW) is the most widely used for structural assembly. Due to this, this work established the study of this type of weld, using as a base material ASTM-A36 structural steel and as filler material E6013 electrodes [13, 14].
The main considerations and restrictions employed in the models are:
- Plastic strains are small and Linear Elastic Fracture Mechanics is used.
- The filler material (E6013) and the base material (ASTM-A36) are considered linear elastic and the properties are defined according to the certificate of warranty from the provider and by testing through tensile tests.
- The dimensions of the specimens are fixed to certain magnitudes, for high-cycle fatigue to be produced (103<Nf<106 cycles) with a completely alternating load of 7500 N peak value.
- The initial flaw type is a surface crack and it is located in the most stressed zone normal to the maximum main stress.
- The initial flaw has a 4-degree angular separation between its faces and its initial size is 80 µm.
- The increase of the defect between one iteration and the following is not above 10% of the crack size existing at the moment of the iteration.
- Prismatic elements are used with nodes located on the vertices and between the edges; in front of the crack triangular prima elements are used.
The ANSYS® V10.0 software was used to calculate the singular nodes in the vicinity of the vertex of cracks, while a computer with an Intel Dual Core processor @ 2.00 GHz was used to solve the models. As a first phase, a preliminary fatigue life prediction model was generated using the Finite Element Method to define the dimensions of the specimens with which, with a completely alternating load of 7500 N, the fatigue life is within the range of high-cycling fatigue.
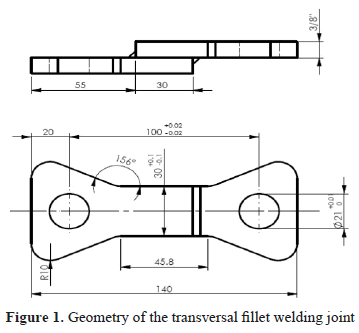
Figure 1 shows the configuration of the welded joint analyzed, which is composed of two superimposed plates with transversal weld beads. The width of the plates is the same and the weld beads are of the fillet type. The fundamental geometrical parameters for this model are: plate width (W=30 mm), length of bead (Lc=30 mm), and plate thickness (S=9,52 mm).
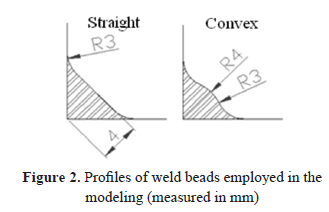
It has been reported by different authors that the shape of the weld bead profile and of the rest of the welded joint configuration conditions the severity of the stress field, becoming a factor to bear in mind in the fatigue prediction models [15, 16]. To analyze the influence of the geometry of the weld bead transversal section during the life of the specimens, two different types of bead profiles were evaluated: straight and convex. The real weld profiles obtained through SMAW processes are similar to the convex profile, the straight profile, or to an intermediate between both types. The parameterization of the bead profiles was carried out as a function of plate thickness and it is shown in Figure 2.
The location where the initial micro-defects appear in the weld bead depends on a set of factors: metallurgic characteristics, welding regime, cooling rate of the joint, properties of the material, restrictions to dilatation or contraction to which the joined plates are subjected, among others [1, 17]. These micro-defects are seeds of subcritical propagation of cracks when at an acute angles stress intensity factors are reached above the propagation threshold value.
The literature discusses numerous criteria for fatigue-crack modeling; this research employs the model proposed by Paris-Erdogan, which is the one most widely used for fatigue processes in the subcritical propagation region (region II) [7, 18],

With da/dN the crack growth rate, DKeq is the range of the equivalent stress intensity factor, and C and m are properties of the material.
The determination of stress intensity factors for geometries and application modes of simple loads can be carried out through easily implemented analytical solutions. But when the geometries and loads are more complicated, these induce complex stress and strain fields on the structural component; therefore, it is recommended to use the Finite Element Method to determine said factors [19]. Also, the displacement correlation technique (DCT) is relatively simple to perform and offers sufficiently precise solutions for the purpose of this work. Due to this, the DCT method is employed in the modeling of the cracks in the weld joint analyzed.
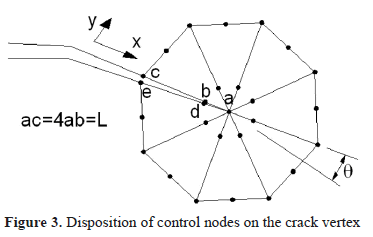
To describe the stress field intensity in the region near to the crack vertex, it is necessary to use singular elements, with an additional node at a distance of a quarter of the size of the fissure vertex. With these singular elements, the stress intensity factors can be calculated in the following manner,
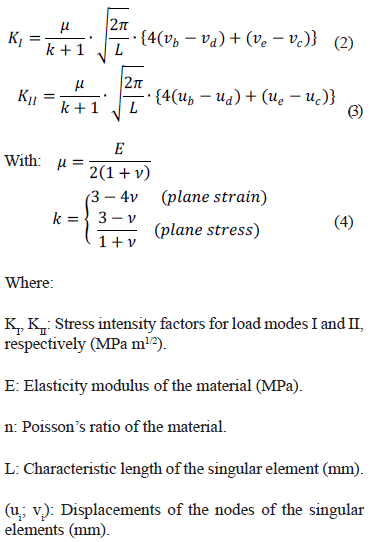
Figure 3 shows the singular elements, the disposition of the nodes and the displacements employed in calculating the stress intensity factors.
To obtain good results, the meshing of the component is carried out by observing some rules. For example, the tip of the crack must be meshed with small singular concentric elements and should not vary in size as the crack extends. The rest of the component is meshed with quadrangular elements that provide good precision.
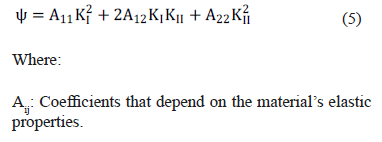
Various methods are available to establish the orientation of the crack as it extends, although all basically lead to similar results. This work uses the strain energy density method on the crack vertex (y), which is expressed according to (5). The relative local minimum of y corresponds to a large volume change and is identified with the region dominated by macro dilatation leading to crack growth. Accordingly, this method establishes that the crack propagates in the direction of minimum strain energy density [18].
3. RESULTS AND DISCUSSION
3.1. Mathematical models of crack propagation
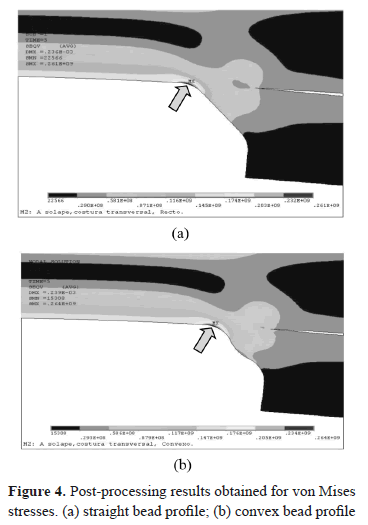
Figure 4 shows the results for von Mises stresses obtained via ANSYS® for both types of bead profiles analyzed. Arrows indicate the location where the maximum equivalent stresses appear. As noted, the weld toe turns out to be the most stressed zone for both cases, and where fatigue cracks are most likely to appear.
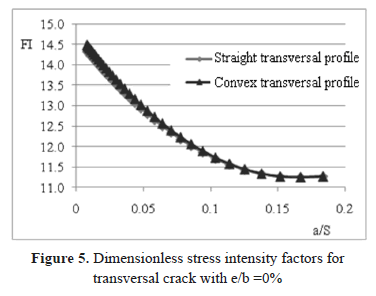
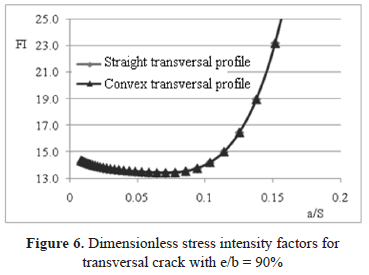
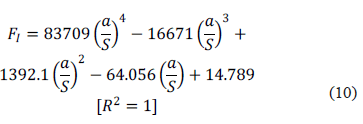
Through the method implemented in this study, results were obtained for the stress intensity factors per iteration during stable crack propagation. Two situations were analyzed for the welded joint; in the first, the crack appears at the foot of the bead centered with respect to the specimen mid plane and parallel to the chord. In the second variant, the crack maintains the same orientation and location at the foot of the bead, but it is eccentric with relation to the bead mid plane, 90% with relation to the semi-width of the plates (e/b=90%). For both situations and for the whole iteration range, the values for KII are negligible with respect to those for KI; also, the crack inclination angle (q) is quite small. Therefore, both values could be considered negligible in practice for simulating effects of the structural integrity of the welded joint. For the calculations it is important to have the dimensionless stress intensity factor (FI) for the crack configuration and transversal bead geometry. This is defined according to expression (6).

With sn being the remote normal stress acting on the crack position and a, the crack depth. Figures 5 and 6 show the FI curves for the two types of bead transversal profiles, and for cases of central crack and eccentric crack, respectively, with respect to the bead mid plane.
The adjusted closed-form solution for the central crack (e/b=0) are,
Straight transversal profile:
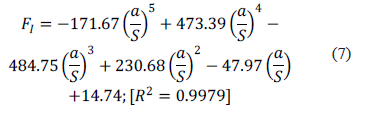
Convex transversal profile:
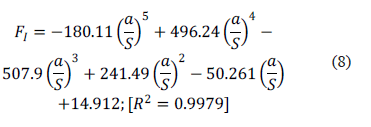
Furthermore, the adjusted closed-form solution for the eccentric crack (e/b=90%) are,
Straight transversal profile:

Convex transversal profile:
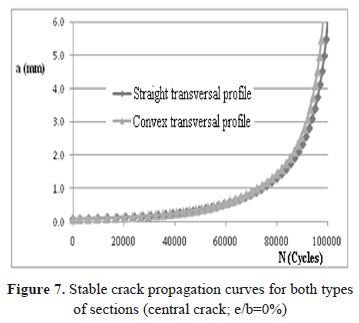
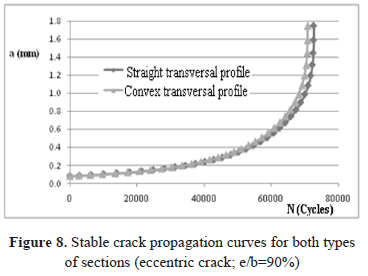
Figures 7 and 8 show the stable crack propagation curves for both types of weld bead profiles and for central and eccentric cracks, respectively. It is notable that the straight profile generates a slightly lower concentration of stresses, so the fatigue life for this bead geometry is 2.5% greater in relation to the life of the convex profile for the eccentric crack. This difference can be considered negligible, which is why it is concluded that the effect of bead thickness on fatigue life is quite weak in this type of weld joint configuration. However, the position of the fatigue crack along the length of the bead does significantly affect the life of the joint, there was a fatigue life difference of up to 41% between the welded joints with central cracks and localized cracks near to the ends of the beads (e/b=90%).
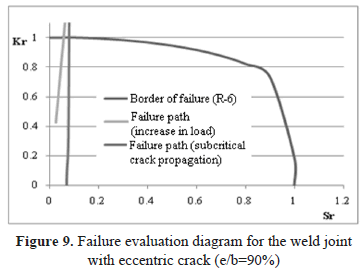
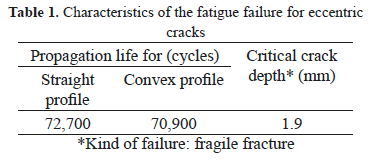
Figure 9 illustrates two possible failure trajectories in the Failure Evaluation Diagram for the eccentric crack with relation to the specimen mid plane. The first of these corresponds to a crack growing in subcritical manner from the initial size, previously predefined; while the second situation corresponds to a 3 mm long crack, and the welded joint is subjected to a tensile load that increases progressively from zero. The interception of these two trajectories with the border of failure defines the failure situation of the welded joint for both cases, which in this case is a fragile fracture of the welded joint.
3.2. Experimentation and validation of the models
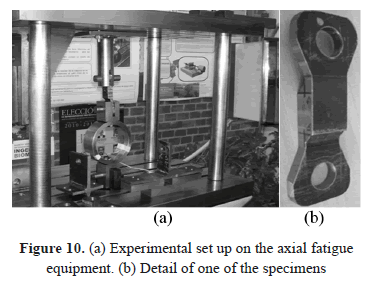
The specimens were tested to fatigue with the required configuration, whose laterals were machined to achieve good dimensional correspondence and eliminate ends of the beads, likely to have significant flaws product of arc rupture and other known negative factors. Nevertheless, weld bead profiles were not machined after weld process. The intention is to obtain experimental results for fatigue in welded joints close to real industrial welding practices. It is difficult to guarantee uniform dimensions and weld bead profiles between specimens. For that reason, several specimens were fabricated; and then, those specimens with weld chord throat equal to 4 mm with tolerance equal to ±7.5% were selected for testing. Four specimens were tested to fatigue (N=4). Figure 10 shows the assembly of one of the specimens on the axial fatigue test machine (a) and a detail of the type of specimen tested (b). The axial fatigue facility used was specially fabricated to test different configurations of welded joints. With it, it is possible to set any load cycle rate with an applied load limit value of up to 10 kN and 30 Hz application frequency. Experimental conditions were set with completely alternating load with a peak load value of 7500 N and an application frequency of 3 Hz. The applied load was adjusted through a double-eccentric mechanism by reading a dynamic load cell connected to a data acquisition system DAS (National Instrument). Cycling was registered with a digital counter with optical sensor.
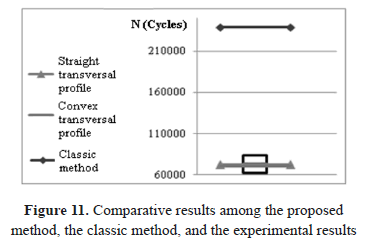
From the number of cycles registered to the point of fracture, the mean value, standard deviation, and confidence interval for 95% probability were found. Also, the number of cycles to reach failure according to the classical method to calculate fatigue [13, 14] is determined according to expressions (11, 12). For the welded joint configuration studied, the fatigue life result is equal to 238,700 cycles.
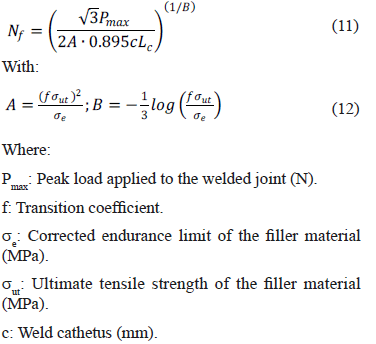
Figure 11 shows the comparison of fatigue life expectation calculated according to the two models developed, the classical method and the experimental results. The life value calculated through the classical method appears with dark line. In this figure, lines indicating the number of cycles practically overlap for straight and convex transversal profiles. Fatigue test results appear like a confidence interval box (mean=73,287 cycles; standard deviation=3,531 cycles).
Table 1 shows the cycle values to fracture obtained from the numerical method for the crack in eccentric location, which turned out to be the most critical location, both with the theoretical method as with the experimental tests. Results were obtained using the method proposed, which agree well with the confidence interval obtained experimentally. However, the fatigue life result obtained with the classical method of fatigue life estimation overestimates the duration by more than threefold. This lack of correspondence in the classical procedure occurs as a product of various factors, among them it does not evaluate the region where the maximum stresses effectively occur, employing a stress concentrator for global fatigue for each kind of welded joint, and using the material strength of the filler material.
4. CONCLUSIONS
The method developed proves effective for the synthesis of fatigue crack propagation models in transverse fillet welded joints. It could be potentially useful for other types of geometric configurations of welds. A very good correspondence was found between the most critical locations in the theoretical models and the zones where fatigue cracks appeared and propagated on the specimens. These locations were the heels or toes of the welded seams and the cracks propagated exposing their surfaces along a plane very proximal to the plane of the maximum principal stress.
The central contribution of this work is the derivation of closed-form solutions, equations (7-10), by mean of the Finite Element Method and Linear Elastic Fracture Mechanics, to calculate the stress intensity factors required to predict superficial crack growth rates (central and eccentric cracks respectively) in transverse fillet welded joints. There are two limitations in this research, in first place homogeneous mechanical properties are considered for the HAZ, and in second place the tensile residual stresses that develop upon contraction of the welding bead are not accounted for. Future work should include these two aspects.
The number of cycles until fatigue failure determined using the models proposed was found to be within the confidence interval (p = 95%), calculated from the results of the experimental tests. This is coherent with the fact that the welded joints tested were not mechanized in order to modify the bead profiles; hence, having intermediate transversal shapes between the theoretical straight and convex profiles employed in this work. There are differences in the results of the models of crack propagation, which differ by up to 41% for central cracks and with eccentricity (e/b=90%) with relation to the bead mid plane. Nevertheless, according to the results there were no significant differences in fatigue life for straight and convex bead profiles.
A contradiction exists between the locations employed conventionally to calculate and test welded joints and the regions that effectively endure processes of volumetric fatigue. Thereby, it has been shown that conventional calculation methods and testing employed in welded joints have deficiencies. The conventional calculation of the fatigue life produced a potentially dangerous over-estimation of more than threefold. So that the normalized use of design factors of four or more would be totally justified in traditional calculation methods.
ACKNOWLEDGMENTS
The authors wish to thank the Dirección Nacional de Investigación de la Sede Bogotá - Universidad Nacional de Colombia (research project DIB 8008044) and Ibague University for the support offered in conducting this investigation.
REFERENCES [ Links ]
[2] Sanders, W. W. and Lawrence, F.V., Fatigue Behavior of aluminum alloy weldments, fatigue testing of weldments, ASTM STP 648, 1977. [ Links ]
[3] Lee, C., Chang, K., Jang, G. and Lee, C. Y., Effect of weld geometry on the fatigue life of non-load-carrying fillet welded cruciform joints, Engineering Failure Analysis, 16, pp. 849-855, 2009. [ Links ]
[4] Balasubramanian, V. and Guha, B. Influence of weld size on fatigue crack growth characteristics of flux cored arc welded cruciform joints, Materials Science and Engineering, A265, pp. 7-17, 1999. [ Links ]
[5] Berkovis, D., Kelly, W. and Di, S., Consideration of the effect of residual stresses on fatigue welded aluminum alloys structures, Journal of Fatigue & Fracture of Engineering Material and Structure, 21, pp. 159-170, 1998. [ Links ]
[6] Dorta, M., Vidal, J., Mateo, A., Fargas, G. y Camejo, F., Modelos empíricos para la predicción de la geometría del cordón en soldaduras a tope de un acero inoxidable dúplex 2205, DYNA, 78, pp. 206-215, 2011. [ Links ]
[7] Murthy, R. D., Gandhi, P. and Madhava Rao, A.G., A model for fatigue prediction of offshore welded stiffened steel tubular joints using FM approach, International Journal of Offshore and Polar Engineering, 4(3), pp. 241-247, 1994. [ Links ]
[8] Maddox, S.J., Applying fitness-for purpose concepts to the fatigue assessment of welded joints, the International Conference on Fatigue, Toronto, Ontario, Canada, 72-81, 1994. [ Links ]
[9] Guirao, J., Rodríguez, E., Bayón, A., Bouyer, F., Pistono, J. and Jones, L., Determination through the distortions analysis of the best welding sequence in longitudinal welds VATS electron beam welding FE simulation, Fusion Engineering and Design, 85, pp. 766-779, 2010. [ Links ]
[10] Horioka, J. E. y Alencastre, J., Estudio de los esfuerzos en uniones soldadas por el método de los elementos finitos, CIMNE, Barcelona, 2002. [ Links ]
[11] Sleczka, L., Low cycle fatigue strength assessment of butt and fillet weld connections, Journal of Constructional Steel Research, 60, pp. 701-712, 2004. [ Links ]
[12] Tran, V. and Pan, J., Analytical stress intensity factor solutions for resistance and friction stir spot welds in lap-shear specimens of different materials and thicknesses, Engineering Fracture Mechanics, 77, pp. 2611-2639, 2010. [ Links ]
[13] Design Handbook for calculating fillet weld sizes, American Welding Society, Miami, Florida, 1997. [ Links ]
[14] Shigley, J. E., Mischke, C. R. and Budynas, R. G., Mechanical engineering design, McGraw-Hill, 7th Edition, pp. 463 - 486, 2004. [ Links ]
[15] Nguyen, N.T. and Wahab, M.A., The effect of butt weld geometry parameters on stress intensity factor and fatigue life, Computational Mechanics, Valliappan, Pulmano & Tin-Loi (Eds), Rotterdam, pp. 883-888, 1993. [ Links ]
[16] Niu, X. and Glinka, G., The weld profile effects on stress intensity factors in weldments, International Journal of Fracture, 35, pp. 3-20, 1987. [ Links ]
[17] Wahab, M.A. and Alam, M.S., The significance of weld imperfections and surface peening on fatigue crack propagation life of butt-welded joints, Journal of Materials Processing Technology, 153 and 154, pp. 931-937, 2004. [ Links ]
[18] Socie, D. F. and Marquis, G. B., Multiaxial Fatigue, Society of Automotive Engineers, Boca Raton, 2000. [ Links ]
[19] Tada, H. Paris, P. C. and Irwin, G. R., The stress analysis of cracks handbook, St. Louis (MO): Del Research Corporation, pp. 452-620, 1973. [ Links ]


