Services on Demand
Journal
Article
Indicators
-
 Cited by SciELO
 -
 Access statistics
Related links
-
 Cited by Google
 -
 Similars in
SciELO
 -
 Similars in Google
Share
DYNA
Print version ISSN 0012-7353
Dyna rev.fac.nac.minas vol.80 no.182 Medellín Nov./Dec. 2013
EXPERIMENTAL VALIDATION OF A MODEL FOR PHOTOVOLTAIC ARRAYS IN TOTAL CROSS-TIED CONFIGURATION
VALIDACIÓN EXPERIMENTAL DE UN MODELO PARA ARREGLOS FOTOVOLTAICOS EN MATRIZ INTERCONECTADA
CARLOS ANDRÉS RAMOS-PAJA
Ph.D., Profesor Facultad de Minas, Universidad Nacional de Colombia, Sede Medellín, caramosp@unal.edu.co
JUAN DAVID BASTIDAS
Ing., Escuela de Ingeniería Eléctrica y Electrónica, Universidad del Valle, Cali, Colombia, juan.d.bastidas@correounivalle.edu.co
ANDRÉS JULIÁN SAAVEDRA-MONTES
Ph.D., Profesor Facultad de Minas, Universidad Nacional de Colombia, Sede Medellín, ajsaaved@unal.edu.co
Received for review January 18th, 2013, accepted July 13th, 2013, final version July, 24th, 2013
ABSTRACT: An extended analysis and the experimental validation of a mathematical model for Total Cross-Tied photovoltaic arrays, based on the inflection points concept, is presented. The model is able to reproduce the electrical characteristics of real photovoltaic plants in both uniform and mismatched conditions (e.g. partial shading). The model calculates the array voltages in which the bypass diodes are turned on, which allows one to detect when a photovoltaic module is active or bypassed in order to consider or neglect its contribution to the array current and power. Such a procedure generates a significant reduction in the computational burden required in comparison with classical approaches. The experiments presented in this paper confirm the advantages of the model: low computational burden, high accuracy reproducing the experimental data, and its usefulness to perform energetic evaluations for viability analysis.
KEYWORDS: photovoltaic array, mathematical model, inflection points, low computational burden, experimental validation, total cross-tied configuration.
RESUMEN: Este artículo presenta un análisis extendido y la validación experimental de un modelo matemático, basado en el concepto de puntos de inflexión, para arreglos fotovoltaicos en matriz interconectada. El modelo reproduce las características eléctricas de plantas fotovoltaicas reales en condiciones uniformes y no-uniformes (e.g. sombreado parcial). El modelo calcula los voltajes del arreglo en los cuales se activan los diodos de bypass, lo que permite detectar si un módulo fotovoltaico está activo o inactivo para decidir si se considera o desprecia su contribución a la corriente y potencia del arreglo. Este procedimiento genera una reducción significativa en la carga computacional requerida en comparación con soluciones clásicas. Los experimentos reportados en este artículo confirman las ventajas de modelo: baja carga computacional, alta exactitud en la reproducción de datos experimentales, y su utilidad en las evaluaciones energéticas de arreglos fotovoltaicos orientadas al análisis de viabilidad.
PALABRAS CLAVE: sistemas fotovoltaicos, modelo matemático, puntos de inflexión, baja carga computacional, validación experimental, matriz interconectada.
1. INTRODUCTION
The high popularity of solar power systems caused by their low pollution and sustainable operation [1], along with the implementation of policies and subsidies to provide incentives for Photovoltaic (PV) installations [2, 3], have promoted the PV market in the last years, where the installed PV power capacity has grown from 0.1 GW in 1992 to 14 GW in 2008 [2]. Most of the installed capacity corresponds to grid-connected applications, which, in many cases, operate under mismatched conditions due to the partial shadows produced by surrounding objects (trees, buildings, antennas, etc.) and clouds, as well as the differences in the parameters of the PV panels.
When a PV array is operating under mismatched conditions the Power vs. Voltage curves exhibit multiple Maximum Power Points (MPP) produced by the activation and deactivation of the bypass diodes of the PV modules, which depend on the operating point of the PV array and on the connections among the PV modules [4, 5, 6]. Mismatching conditions also produce significant drops in the maximum power available in the PV array and may cause the Maximum Power Point Tracking (MPPT) strategy of the PV system to be trapped in a Local MPP (LMPP). All of this wastes energy, producing degradation of the PV panel, and affect the return of investment time of a PV installation.
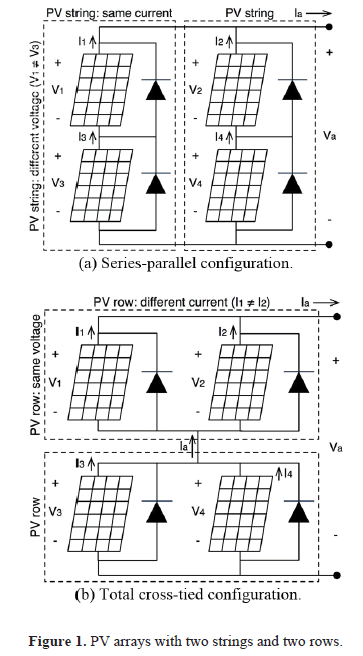
The most used PV array configurations are the Series-Parallel (SP) and the Total Cross-Tied (TCT), although in the literature it is possible to find other configurations like the Bridge-Linked (BL) and the Honey-Comb (HB) [4]. In the SP configuration the PV modules are connected in series forming strings, which are connected in parallel to form the array. For example, Figure 1(a) shows a SP array with 2 strings of 2 PV modules each. Due to the wide use of SP configurations in PV installations of any size, several models with different accuracies and calculation speeds have been developed [6, 7].
In the TCT configuration the PV modules are connected in parallel forming rows, which are connected in series. For example, Figure 1(b) shows a TCT array with 2 rows of 2 PV modules each. The TCT configuration is used in PV installations since it mitigates the effects of the mismatching conditions as reported in [3, 4]. But despite its increasing utilization in PV installations, little information concerning the modeling of TCT arrays exists. In [4] the equations for solving the equivalent circuit of a rectangular TCT configuration to validate a piece-wise linearized model is presented. However, for a TCT configuration with N rows of M PV modules connected in parallel it is necessary to solve a system of N·M+N non-linear equations as proposed in [4], which results in a high computational burden and long calculation times.
Due to the lack of mathematical models for TCT configurations, Shams El-Dein et al. [3] use circuital simulations of the PV system, implemented in Simulink from Matlab, to detect the TCT configuration that produces the highest power. Such a solution is intended for a TCT array with a fixed number of PV modules and a particular mismatching profile. Basically, the solution reported in [3] constructs a cost function that calculates the energy of the array in a period of time by considering the voltages of each row and the current of the array, which is optimized by means of the Branch and Bound (BB) algorithm. Then, the optimal TCT configuration (OTCT) is contrasted with the SP and TCT original configurations by using circuital simulations again. Since a circuital simulator is required, the solution of Shams El-Dein et al. is not suitable for online reconfiguration; moreover it requires a large amount of calculations to solve the implicit Kirchhoff's circuit laws of the PV array.
Therefore, a mathematical model for TCT configurations is required to define the best PV module arrangement in PV installations. In addition, since the SP configuration is widely used in small and large PV plants, such a model is needed to select between the TCT and SP options. Moreover, finding online the correct array reconfiguration is the new frontier in small PV systems, where active reconfiguration devices are used to maximize the PV power. In such an application the TCT configuration is widely adopted [5, 8], hence a fast and accurate model-based MPP calculation procedure is required.
This paper experimentally validates a mathematical model to calculate the current and power of TCT photovoltaic arrays, aimed at reducing the computational burden and removing the requirement of circuital simulators in energy evaluation analyses. In addition, this paper provides an extended analysis concerning the model basis and improved performance. The model analyzed and validated in this paper was first introduced in the work "Mathematical model of total cross-tied photovoltaic arrays in mismatching conditions" developed by the authors, which appeared in the 4th IEEE Colombian Workshop on Circuits and Systems (CWCAS-2012, © 2012 IEEE).
2. EXPERIMENTAL COMPARISON OF TCT AND SP CONFIGURATIONS
Figure 1 shows both SP and TCT configurations of a PV array composed of four PV modules connected in two strings (columns) and two rows (2 x 2). From the circuit of Figure 1(a) it is noted that in the SP configuration, the PV modules in the same string (column) have the same current but different voltage. Instead, from the circuit of Figure 1(b) it is noted that in the TCT configuration, the PV modules in the same row have the same voltage but different current.
Moreover, in the SP configuration the same mismatched level on the PV modules of the same row have a different effect on the array current and power. Therefore, as discussed in the literature [3], exchanging row-arranged PV modules could generates different maximum power points. For example, if the four modules in Figure 1(a) have different irradiance conditions, exchanging the position of modules 3 and 4, i.e. move module 3 to the second string and move module 4 to the first one, would change the operating conditions of each string, which modify the power curve of the array. In contrast, the same exchange of modules in the TCT configuration of Figure 1(b) has no impact on the array current or power. Such a condition is due to the current of the row being the same regardless of the PV modules position.
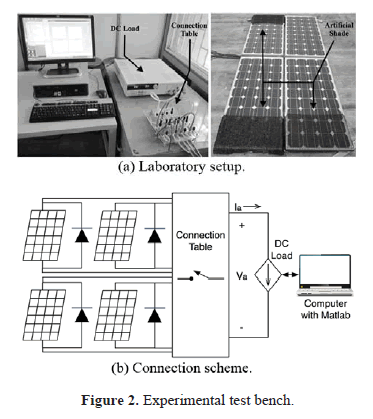
To compare the SP and TCT electrical behavior, the experimental system of Figure 2 was developed: ERMD85 PV modules were interconnected by means of a connection table, and its PV voltage was imposed by an electronic DC load controlled by means of a computer with Matlab. The same computer also registered the current/voltage data of the PV array.
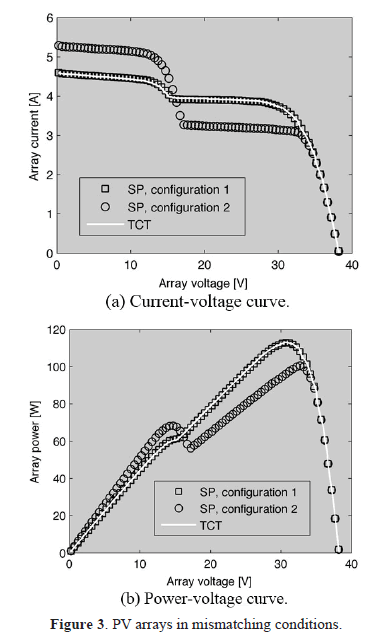
From the experiments, the current/voltage (I-V) and power/voltage (P-V) curves for the SP and TCT configurations of Figure 1 were obtained under deep mismatching conditions: the I-V curves of each PV module was registered and used to plot the electrical characteristics of the PV arrays. The obtained data are shown in Figure 3, where both the TCT and SP configurations generate the same power profile if the same mismatching profile is given (TCT and SP configuration 1).
When the PV array is partially shaded by a fixed obstacle such as a post or a tree, which is typical in urban environments, the change of the sun position also changes the irradiance profile, causing the shaded modules to become non-shaded and vice versa. Cloud movement may cause the same effect. This condition can be modeled by the exchange of the irradiances of modules 3 and 4, which in TCT does not cause any effect on the PV power, while in SP it generates different current and power curves (SP configuration 2) with a lower global MPP. Therefore, TCT configuration is an interesting option if the mismatching profile is not fixed or previously known, which is a common condition.
3. TCT CONFIGURATION ANALYSIS
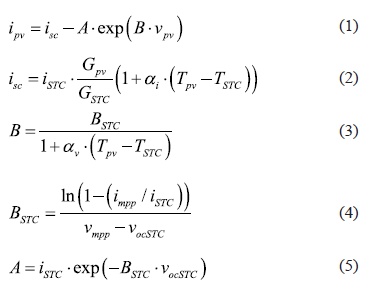
Using an explicit relation between the current and voltage of a PV module by neglecting the parallel and series resistances of the classical model [6], (1) is obtained, where ipv and vpv are the current and voltage of the PV module, respectively. The parameters A, B, and isc can be evaluated based on the datasheet information for a given irradiance (Gpv) and temperature (Tpv) by using (2)-(5), where iSTC and vocSTC are the short circuit current and open-circuit voltage at Standard Test Conditions (STC), respectively; while TSTC, and GSTC are the temperature and irradiance of the PV module at STC, respectively. BSTC is the value of parameter B at STC, impp and vmpp are the current and voltage of the PV module at the MPP for a given irradiance and temperature condition, respectively. Finally, ai and av are the current and voltage temperature coefficients. This paper considers ERMD85 PV modules to illustrate the model. The nominal parameters of such commercial PV modules are: iSTC = 5.13 A, vocSTC = 21.78 V, impp = 4.8 A, vmpp = 17.95 V, ai = 0.0013 A/oC, and av = -0.07405 V/oC.
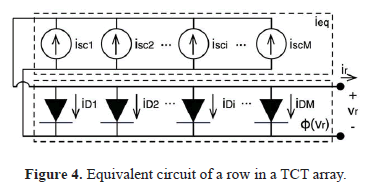
From Figure 1(b), and as anticipated above, it is evident that in TCT configurations the current of a row of PV modules does not depend on the modules position in the row. Using the explicit PV model (1), the current of a PV row with M parallel modules and voltage vr is:

where Ai and Bi are the module parameters, and ieq and F(vr) represent the equivalent electrical circuit of the row as depicted in Figure 4, ie represents the aggregated short-circuit currents of the modules (7), and F(vr) represents the aggregated current of the P-N junctions of the modules (7), which are traditionally modeled by diodes [6] with current iDi = Ai.exp(Bivr).
From the derivative of the row current given in (8), which is always negative since module parameters are always positive in real conditions, it is noted that each row voltage vr produces a unique row current ir. In addition, (8) ensures that ir is a monotonically decreasing function.

Another important factor from a practical TCT array is revealed in Figure 1(b): commercial PV modules have bypass diodes, inserted by the manufacturer, aimed at protecting the modules from negative currents that cause hot spots that degrade the array [9]. Bypass diodes are placed in parallel with the PV module, and such diodes force the module voltage to zero if the current imposed on the module is higher than its short-circuit current, which mainly depends on the irradiance [6].
Since the activation of a bypass diode forces zero power production for the associated row (zero voltage for the modules in parallel), it also causes an inflection point on both current and power curves. Such a condition is illustrated in Figure 3, where at 15.19 V the TCT current and power curves exhibit an instantaneous derivative variation.
4. REVIEW OF THE TCT MODEL
This section reviews the model to be experimentally validated, extending also the analyses presented in [10].
A TCT configuration with N series and M parallel modules can be represented using (6) with N series equivalent circuits, each one of them with a bypass diode. Therefore, the PV array current ia is defined by the higher row current, while the rows with lower currents will have the associated bypass diode active, which in turn imposes zero voltage to such PV rows. Hence, the currents of all bypassed modules are the short-circuit currents, i.e. currents at zero volts.
The previous condition can be used to reduce the array current/power calculation time, since such variables must be evaluated for a given array voltage in order to calculate the current of each PV module. Therefore, the rows voltages must be calculated, and by means of (6), the array current can be obtained. This means that N row voltage variables are unknown, and a non-linear N-equation system, composed of multiple instances of (6), must be solved. But if the imposed array voltage precedes an inflection voltage, at least one bypass diode is active, therefore at least one row voltage is zero and the non-linear system to be solved has one equation less. In general, if the imposed array voltage precedes J inflection voltages, the non-linear system to be solved has J equations less, which strongly reduces the array current/power calculation time.
Since the PV rows are in series, as in Figure 1(b), the position of a particular row in the array has no impact on the current and power curves. Therefore, without loss of generality, the description of the inflection point calculation considers the PV rows placed in descendent order of ieq, hence ieq,j = ieq,k with j < k and j, k ∈ [1, N]. Since the current of j-row is higher than the current of k-row, in a string with j-row and k-row connected in series, the inflection point occurs when the k bypass diode becomes active, which also causes

Replacing (6) into (9), the inflection voltage is given by the voltage of the j-row (Vo,j,k) in (10), where indexes [i, j] and [i, k] refer to the i-th modules of the j-th and k-th rows, respectively. Moreover, (10) can be used to calculate the inflection voltage between PV rows with different number of modules Mj and Mj. For a rectangular TCT array (N x M), M = Mj = Mk. It is noted that (10) is a nonlinear equation that could be solved by traditional numerical methods to obtain the inflection voltage between j-th and k-th row (Vo,j,kk).

However, in a string with more than two rows, Vo,j,k represents the contribution of the row j to the minimum array voltage that turn off the bypass diode of the row k (Vo,k); therefore Vo,k is calculated as the sum of the inflection points contributions of the rows with ieq greater than ieq,k (modules from 1 to k-1). In general the contribution of the row m to the inflection voltage of the row k (with m < k) is obtained from the solution of Vo,m,k in (11), and the value of Vo,k is calculated from (12).

From (12) it is evident that the inflection point is calculated by solving (11) a maximum of k-1 times. Therefore, with N PV rows there are a maximum of Nr = N-1 inflection points, and to find all the inflection points a maximum of (Nr+1)·Nr/2 non-linear equations must be solved. But since the inflection points do not change with the imposed array voltage for a given irradiance and temperature conditions, the solution of those equations is required only once to calculate the PV array current and power.
Then, the array current ia for an imposed array voltage va is calculated by means of (6), where the PV rows voltages vr,i must be found. Such voltages are obtained by taking into account that the current of the rows is the same, which define the following non-linear equation system:

Such a system has Nac + 1 non-linear equations, where Nac depends on the position of va with respect to the inflection voltages and represents the number of non-bypassed rows. Therefore, the number of calculations required to obtain the array current/power curves is significantly reduced in comparison with classical techniques, where the calculation of each point of the curves requires the solution of a N·M+N non-linear equation system as in the TCT array representation reported in [4].
The non-linear equation system of (13)-(14) can be solved by means of classical approaches like the Newton-Raphson method, or by means of modern approaches like the fsolve() function of Matlab. But in both cases the search domain of the solution is constrained by the inflection points: the array current is always constrained by the currents of the inflection points that surround the array voltage. Therefore, if the array voltage va is between the inflection points k and k+1, i.e. Vo,k <v< Vo,k+1 where Vo,k and Vo,k+1 are the voltage inflection points, the array current ia fulfills Io,k < ia < Io,k+1 where Io,k and Io,k+1 are the current inflection points, which are calculated from (6). Such a characteristic reduces the calculation time since the zone where the solution occurs is known. Moreover, since the current derivative is negative (8), the solution ia can be found by iteratively searching the solution starting from the inflection points, but more efficient algorithms like Newton-Raphson method or fsolve() function can converge to the solution faster.
5. EXPERIMENTAL VALIDATION OF THE MODEL
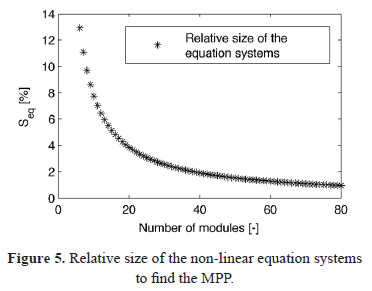
The previous model for TCT arrays is useful in both uniform and mismatching conditions. Due to the presence of multi-peaks and inflection points, the mismatching conditions provide a higher challenge. Therefore, the size of the non-linear equation system that must be solved to find the MPP is used to validate the reduced calculation requirements of the solution presented in [10], in contrast with the classical approach of [4]. Figure 5 shows the relative size of the non-linear equation systems Seq = Neq,ip/Neq,cl, where Neq,ip and Neq,cl correspond to the number of equations required in [10] and [4], respectively.
To provide a fair comparison such a figure considers symmetrical TCT arrays, thus N=M, and an MPP voltage near to 80 % of the open circuit voltage. Moreover, only half of the modules have been considered to be under mismatching conditions, this is because having all modules mismatched is the best condition for the validated model in terms of number of equations (two equations), while no modules mismatched is the worst condition (N+1 equations). From Figure 5 it is noted that the validated model has to solve an equation system with less than 14 % of the equations required by the classical solution for N ≥ 5. In addition, the percentage is reduced when the number of modules increases: for N ≥ 80 the size of the equation system in [10] is less than 1 % of the one required by the classical approach. Such results show the large reduction of the computational burden achieved by the validated model.
To validate the model accuracy, a TCT array with three rows and two strings (N=3, M=2, denoted 3 x 2) was considered. The tests use experimental data obtained from the laboratory setup of Figure 2, where six I-V characteristics of ERMD85 PV modules with different mismatching conditions were measured. From such electrical characteristics, the parameters of the explicit model (1) were calculated by means of (2)-(5) for all the PV modules.
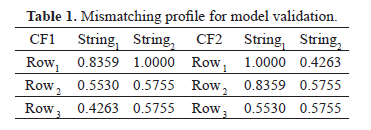
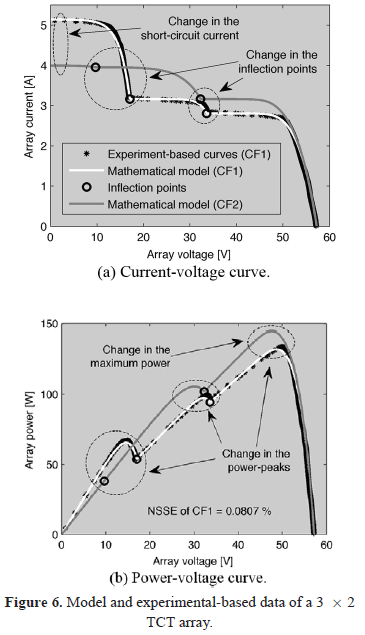
A first configuration, named CF1, was constructed with the experimental data to form the 3 x 2 array with a deep mismatching profile described in Table 1, whose values refer to the level of irradiance that reaches the module: 1.0000 refers to a non-shaded module while 0.4263 refers to a module with 42.63 % of the maximum irradiance. The data exhibit a maximum irradiance Smax = 560.60 W/m2, therefore in CF1: S1,1 = 560.60 W/m2 for N = 1 and M = 2, while S3,2 = 322.63 W/m2 for N = 3 and M = 2. Figure 6 presents the I-V and P-V curves of the CF1 experimental-based TCT array, where three LMPP (power-peaks) and two inflection points are observed.
Then, the model of [10] was implemented in a Matlab script using the fsolve() function with the default trust-region-dogleg algorithm, it considers the calculated parameters of (1) for each PV module. The model was processed to estimate the I-V and P-V curves of CF1, the results are presented in Figure 6, where the LMPP and inflection points where accurately predicted. Moreover, to quantitatively validate the model accuracy, the Normalized Sum of Squared Errors (NSSE) index (15) was used, where y and ye represent the reference and estimated values, and H represents the number of data samples. The low NSSE value (NSSE = 0.0807 %) provided by the validated model guarantees the correct reproduction of the real electrical characteristics. Therefore, the maximum power achievable by the array, which occurs at the LMPP with higher power or GMPP, can be accurately predicted.

To illustrate the usefulness of the validated model in testing the effect of different positions of the modules in the TCT array, a second configuration named CF2 was simulated by exchanging the position of 66.67 % of the PV modules as given by Table 1. Figure 6 shows the I-V and P-V curves of CF2, where the short-circuit current of the array, the inflection points, and the LMPP have significant changes. The results also show an increment in the maximum power caused by connecting the modules in CF2 instead of CF1.
Finally, the results presented in Figure 6 show the correctness of the calculation of the inflection points and the accurate reconstruction of the current and power curves. Hence, the validated model can be used to simulate the power production of TCT arrays without using a circuital simulator. Moreover, such TCT array simulations can be performed iteratively to predict the potential energy production of an array in periods of hours, days, months, years, etc. Similarly, the model can be used to find the best modules position in the TCT array by simulating the possible cases to contrast the maximum power achievable in each one of them.
6. ENERGY EVALUATION EXAMPLE
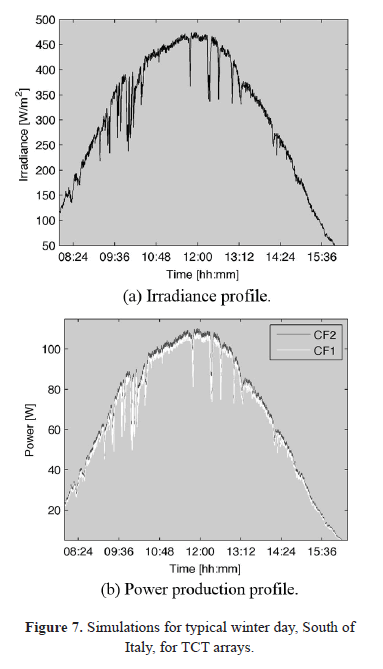
To illustrate the usefulness of the validated model in both the evaluation of energy production and the comparison of the modules position for long terms, the mismatched CF1 and CF2 arrays were used to estimate the potential energy production of a TCT power plant. The adopted irradiance profile, depicted in Figure 7(a), corresponds to a typical winter day in the South of Italy.
Figure 7(b) reports the simulation of CF1 and CF2 TCT arrays for the 8 hours and 20 minutes of the irradiance profile, sampled every 30 s (1000 irradiance values), where CF1 produces 1.8811 MJ (0.5225 kWh) while CF2 produces 1.9254 MJ (0.5348 kWh). Such information is essential to calculate the return time of the investment used to define the economic viability of the solution. Moreover, the simulation reports that just by changing the position of the PV modules to CF2 the array produces 2.36 % more energy, which in turns increases the economic viability of the power plant. The simulation of the irradiance profile (1000 irradiance values) for CF1 and CF2 take 45 minutes in a computer with 8 Gb of memory and an Intel Core i7-2 GHz processor.
Finally, this example shows the model's usefulness in the planning, design and modification analysis of TCT photovoltaic power plants.
7. CONCLUSIONS
The proposed experiments confirm the advantages of the validated model: low computational burden, high accuracy reproducing the experimental data, and its usefulness to perform energetic evaluations for viability analysis.
The performed experiments also highlight that the model structure makes its implementation in standard programing languages (e.g. C, Matlab, etc.) simple for using it in different ways: for example, the model can be used to estimate the energy production of a TCT array and to rapidly test different configurations, which is useful to perform economic and technical viability analyses. Similarly, the model can be used in a reconfiguration scheme to dynamically find the best module organization.
Finally, the model can be further improved by considering the series and parallel resistances of the single-diode model. But such a condition will generate implicit current/voltage relations that require the specialized Lambert W function to be solved [6], which also requires large calculation times.
ACKNOWLEDGEMENTS
This work was supported by the project VECTORIAL-MPPT of the Universidad Nacional de Colombia and by the scholarships APCC-ND-66-197 and 095-2005 from COLCIENCIAS.
REFERENCES
[1] Chejne, F., Macia, A., Estrada, D., Velasquez, H. and Londono, C., "Radiation model for predicting temperature evolution in solar cooker," Dyna, vol. 78, pp. 68-74, 2011. [ Links ]
[2] IEA, "Technology Roadmap Solar photovoltaic energy," Tech. Rep., 2010. [Online]. Available: http://www.iea.org/papers/2010/pv roadmap.pdf [ Links ]
[3] Shams El-Dein, M. Z., Kazerani, M., Salama, M. M. A., El-dein, M. Z. S. and Member, S. S., "An Optimal Total Cross Tied Interconnection for Reducing Mismatch Losses in Photovoltaic Arrays," IEEE Transactions on Sustainable Energy, vol. 99, pp. 1-9, 2012. [ Links ]
[4] Wang, Y.-J. and Hsu, P.-C., "An investigation on partial shading of PV modules with different connection configurations of PV cells," Energy, vol. 36, no. 5, pp. 3069-3078, 2011. [ Links ]
[5] Velasco-Quesada, G., Guinjoan-Gispert, F., Pique-Lopez, R., Roman- Lumbreras, M. and Conesa-Roca, A., "Electrical PV Array Reconfiguration Strategy for Energy Extraction Improvement in Grid-Connected PV Systems," IEEE Transactions on Industrial Electronics, vol. 56(11), pp. 4319-4331, 2009. [ Links ]
[6] Petrone, G., Spagnuolo, G. and Vitelli, M., "Analytical model of mismatched photovoltaic fields by means of Lambert W-function," Solar Energy Materials and Solar Cells, vol. 91(18), pp. 1652-1657, 2007. [ Links ]
[7] Patel, H. and Agarwal, V., "MATLAB-Based Modeling to Study the Effects of Partial Shading on PV Array Characteristics," IEEE Transactions on Energy Conversion, vol. 23(1), pp. 302-310, 2008. [ Links ]
[8] Nguyen, D. and Lehman, B., "An Adaptive Solar Photovoltaic Array Using Model-Based Reconfiguration Algorithm," IEEE Transactions on Industrial Electronics, vol. 55(7), pp. 2644-2654, 2008. [ Links ]
[9] Silvestre, S., Boronat, A. and Chouder, A., "Study of bypass diodes configuration on PV modules," Applied Energy, vol. 86 (9), pp. 1632-1640, 2009. [ Links ]
[10] Ramos-Paja, C.A., Bastidas, J.D., Saavedra-Montes, A.J., Guinjoan-Gispert, F. and Goez, M., "Mathematical model of total cross-tied photovoltaic arrays in mismatching conditions". Proceedings of the IEEE 4th Colombian Workshop on Circuits and Systems (CWCAS). Barranquilla, Colombia, pp. 1-6, 2012. [ Links ]


