Serviços Personalizados
Journal
Artigo
Indicadores
-
 Citado por SciELO
 -
 Acessos
Links relacionados
-
 Citado por Google
 -
 Similares em
SciELO
 -
 Similares em Google
Compartilhar
DYNA
versão impressa ISSN 0012-7353
Dyna rev.fac.nac.minas vol.81 no.183 Medellín jan./fev. 2014
https://doi.org/10.15446/dyna.v81n183.36918
http://dx.doi.org/10.15446/dyna.v81n183.36918
FREE AND CONSTRAINED SINTERING OF 3-MOL % YTTRIA STABILISED ZIRCONIA
SINTERIZADO LIBRE Y CON RESTRICCIÓN DE ZIRCONIA PARCIALMENTE ESTABILIZADA CON ITRIA 3-MOL %
LUZ STELLA ARIAS-MAYA
M.Sc., Facultad de Ingeniería Mecánica, Universidad Tecnológica de Pereira, Pereira, Colombia, stellarias@hotmail.com
Received for review January 28th, 2013, accepted July 29th, 2013, final version August, 20th, 2013
ABSTRACT: Densification and shrinkage behaviour of ceramics or other powder materials can be predicted in a simple manner by using the master sintering curve. In this work, the densification data required to construct the master sintering curve of a 3-mol% yttria stabilised zirconia powder have been obtained. Bulk samples prepared by cold pressing, as well as thick films made of the same powder applied to a rigid substrate, were sintered. The free and constrained sintering experiments have been performed applying three different heating rates, with and without isothermal step at a maximum temperature of about 1450 °C. The shrinkage of the samples was measured in situ during densification using a push rod dilatometer. Also, a conventional box furnace was used, applying the same heating schedule, to compare the results. Microstructural analysis has been achieved by using scanning electron microscopy, environmental scanning electron microscopy, and optical microscopy. An acceptable agreement was obtained between similar samples sintered in the dilatometer and the box furnace, indicating that the dilatometer data could be used for both environments. The bulk samples reached lower densities than the films, probably due to their lower initial densities. For the samples free of constraint, a master sintering curve was achieved with an activation energy of 550 kJ mol-1. For the constrained case, problems associated with the substrate and the uncertainties in the measurements hindered the characterisation of the film, i.e., a single master sintering curve could not be produced.
Key words: Yttria stabilised zirconia, Sintering, Master sintering curve, Restriction.
RESUMEN: La densificación y la contracción de cerámicos u otros materiales en polvo pueden ser predichos de una manera sencilla usando la curva maestra de sinterizado. En este trabajo se han obtenido los datos de densificación requeridos para construir la curva maestra de sinterizado de zirconia en polvo estabilizada con 3-mol% itria. Se sinterizaron muestras compactadas en frío, así como películas gruesas hechas del mismo polvo y aplicadas a un sustrato rígido. Las pruebas de sinterizado libre y con restricción fueron realizadas aplicando tres velocidades de calentamiento, incluyendo o no una etapa isotérmica a la máxima temperatura de ~1450 °C. La contracción de las muestras se midió durante la densificación usando un dilatómetro de varilla de presión. También se usó un horno convencional, aplicando la misma curva de calentamiento para comparar resultados. El análisis microestructural fue logrado mediante microscopía de barrido electrónico, microscopía de barrido electrónico ambiental y microscopía óptica. Se obtuvo una concordancia aceptable entre muestras similares sinterizadas en el dilatómetro y en el horno convencional, indicando que los datos del dilatómetro pueden ser usados para ambos ambientes. Las muestras que se sinterizaron sin restricción alcanzaron menores densidades que las películas, probablemente debido a que sus densidades iniciales eran menores. Para las muestras libres de restricción, se obtuvo una curva maestra de sinterizado con una energía de activación de 550 kJ mol-1. Para las películas sinterizadas con restricción, algunos problemas asociados con el sustrato y con las incertidumbres de las mediciones impidieron la caracterización de la película, es decir, la obtención de una curva maestra de sinterizado con un solo valor de energía de activación.
Palabras clave: Zirconia estabilizada con ittria, Sinterizado, Curva maestra, Restricción.
1. INTRODUCTION
Sintering is a process by which crystalline powder particles reduce their free surface energy. The reduction of the total surface energy and grain boundary leads to densification and shrinkage of the body, due to the moving of atoms. The mass transport is possible over the free surfaces of particles and over the grain boundaries that form between the adjacent ones.
The finished ceramic piece's characteristics are affected by many variables and facts involved in its manufacturing. These characteristics are also affected by the properties of the powders and the additives used to prepare the piece. Due to this, it is difficult to predict the ceramic powder kinetics and behaviour during sintering, as well as the dimensions, properties and final appearance of the piece. Manufacturers usually have to use trial and error to determine the effects of sintering, and they have to adopt the composition and appropriate heating routes. In consequence, the time and production costs increase.
For this reason, it is helpful for the sintering process to have tools that facilitate predictions of the piece change in size. The Master Sintering Curve (MSC) is a practical model developed to predict behaviour and shrinkage of metals and ceramics during sintering of compacted powders, regardless of the heating path. The MSC is obtained from data from various experiments, and it is valid for powders with the same microstructure and manufacturing process. Therefore, the model is vulnerable to the powder composition and physical characteristics, as well as the process conditions [1].
The MSC can also be used for comparing different powders, the additive effects and their ease of sintering [2]. In addition, it allows establishing the main sintering mechanism, through the activation energy [3]. The concept has been applied successfully to different systems free of constraint.
The axes of the MSC are relative density (RD) and the work of sintering (Q), which depends on the sintering temperature (T) and time (t), representing the dominant diffusion mechanism. This dependent parameter is shown in Eq. 1, where Qb is the activation energy for grain boundary diffusion and R is the gas constant.
![]()
Eq. (1) defines de MSC, where there is no assumption about the relationship between time and temperature [4]. All the terms affected by microstructure are on one side of the equation, and the time and temperature terms on the other side. Both sides are related experimentally [1,3]. The model is based on the linear contraction given in a concept developed for Hansen et al. [5], where the sintering process is given in one stage, instead of the traditional three stages. The model of Su and Johnson [1,3] assumes that the main diffusion mechanism is grain boundary diffusion.
The construction of a MSC requires the estimation of the activation energy (Q). The appropriate value can be obtained with the data gathered in a dilatometer using different heating rates. An initial value for Q is assumed, and then curves of density versus Q, the work of sintering, are plotted for each heating rate. The curves must converge to a unique activation energy in a sigmoid curve [6].
Ceramic materials are widely investigated (e.g., [7-16]); in particular, zirconia is a ceramic recognized by its multiple applications in engineering, due to their exceptional properties, such as high hardness, toughness, high oxygen diffusivity and low thermal conductivity [12]. Yttria stabilized zirconia (YSZ) presents high resistance and toughness, high temperature resistance and also conducts oxygen ions at 800 °C or more. These qualities make YSZ a good candidate for applications such as electrolyte in solid oxide fuel cells (SOFCs) [11-14].
In SOFCs, a thin layer of YSZ is deposited as electrolyte on a rigid substrate. The film is sintered with the substrate, which impedes the free contraction in the film plane. Consequently, this contracts only in the direction perpendicular to the plane. This means that just the thickness dimension changes during sintering. This particular case is known as constrained sintering, where the densification process of the sample is affected due to the resulting stresses.
This work evaluates the possibility of obtaining a MSC for zirconia powders stabilized with yttria (YSZ) at 3% mol without restriction and of extending it to the case in which sintering is performed with restriction. Additionally, this work aims at comparing data taken from a conventional oven with the data given by a dilatometer, taking into account the difficulties to collect data mainly in the case where restriction is present. Some comparisons are possible through microstructural analysis.
2. METHODOLOGY
2.1. Samples
Two groups of samples were prepared for this study using 3-mol % yttria stabilized zirconia powders (Melox Chemicals 3Y XZ07078/14, batch number 04/316/01M). The powder and the screen-printed specimens were supplied by Rolls-Royce Fuel Cell Systems Ltd. More details about the powder characteristics, the formulation of the ink and the printing process can be found in [7]. Two groups of samples were prepared with the objective of analyzing the behaviour of the material during free and constrained sintering, the latter one, when a layer of the material is placed on a rigid substrate.
2.2. Samples for free sintering
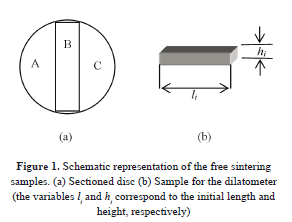
The ceramic powder was blended with 23 ± 2 wt% (standard deviation) polyvinyl alcohol (PVA) as binder. Each blend was used to prepare two green compacts with diameters of 20 mm and 2 mm height (Fig. 1). The discs were made in a Specac hydraulic uniaxial pressing machine at a pressure of 31 MPa. Each sample was cut in three parts; one of them was used in the dilatometer and at least other in the box furnace. The samples dimensions were measured using digital callipers with a precision of ±0.01 mm.
2.3. Samples for constrained sintering
Each sample has a planar design. The electrolyte thick-film layers were placed using a Smetech Benchmark 90 screen-printing machine. The squeegee applied a force of 4.5 kgf to the ink during the printing operation. The mesh size was 165 apertures per inch with a nominal thickness of 100 mm ± 3mm and an open area of 44%. The electrolyte layer was formed as a laminate, with three applications to reduce the presence of defects. The substrate was a flat sided tube made from porous magnesia-magnesium aluminate spinel. Between the electrolyte and the substrate, a priming layer of about 30 mm was applied and pre-fired to smooth the surface. The electrolyte layer had a thickness of about 24 mm [7].
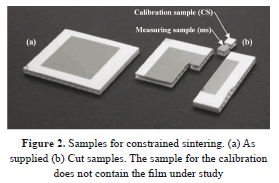
The samples were supplied as squares with 50 mm sides and 5 mm height. From them, smaller samples were cut with dimensions of 6'6'5 mm3 for dilatometry and 6'10'5 mm3 for the conventional oven (Fig. 2). Contamination of the samples was avoided, and then each cut was made with a diamond wheel without lubricant.
It was necessary to use two kinds of samples in the dilatometer (Fig. 2 (b)). The first one, named calibration sample, CS, lacked the electrolyte film and was used for performing the calibration of the dilatometer against which to measure the changes of thickness of the layer in study. The second type did include the electrolyte layer.
2.4. Sintering
Two ovens were used in this work: a conventional oven, Elite Thermal System Model BRF17/5-I-M with a Eurotherm 2416 programmer, and a dilatometer, Netzsch DIL 402C/41G with an "S" sample thermocouple and a pushrod that applies a force of only 30 cN to the sample. The pushrod transmits the signal to a Linear Variable Displacement Transducer (LVDT). The sample holder and calibration sample for the free sintering experiments are made of alumina. The gases released from the sample were purged using Argon at 44 ml min-1.
In the dilatometer, it was necessary to correct the dimension changes in the system. For this purpose, a calibration sample (CS) was used. In the case of free sintering, the CS (alumina) was supplied by the Netzsch group. For constrained sintering the sample without the priming and electrolyte layers was used.
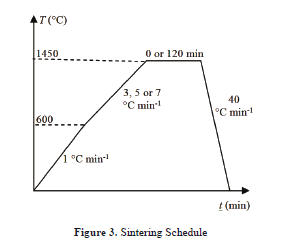
The samples were fired both in the dilatometer and the box furnace, which were programmed with the same schedule. This was done with the aim of comparing the results. Six sintering programs were performed, which are shown in Fig. 3. The first step (1 °C min-1) was the same for all the incursions and was used to burn out the binder and other organic additives in the samples (if higher heating rates are used, the vapours generated from the binders may damage the samples). For both free and constrained sintering, the calibration run had the isothermal step for each heating rate (3, 5, and 7 °C min-1). Different heating rates and dwell times were used so as to obtain a generic master sintering curve, and were selected based on a previous work [7].
2.5. Density
The final density of the free samples was measured by means of a digital balance, whose precision was of ±0.0001 g. This balance allowed the use of the Archimedes method. Deionised water was chosen as the fluid for the measurements. The samples were covered with a thin layer of nail polish, with the aim of avoiding water infiltration. The ASTM Standard test Method for Bulk Density and Volume of Solid Refractories by Wax Immersion (ASTM C914-95) [17] has been followed. The densities were given by the instrument with two decimal places, including the fluid temperature corrections.
Also, the final density for the samples sintered in the dilatometer was calculated assuming uniform contraction and constant mass:
![]()
where, ri is the initial density, Dl/li is the linear contraction and Dl is the value given by the dilatometer. The final value was also measured by manual methods. The estimated data were compared with those measured before sintering to validate the results.
The density was determined from the surface of the electrolytic layer following the linear intercept method from the British standard EN 623-3:2001 method B [18]. The micrographs were obtained by means of a scanning electron microscope Hitachi S-3200N. For estimating the porosity of the samples, at least 100 pores were measured through lines drawn on the micrographs. The relative density is given by:
![]()
where pf is the final mean volume fraction of porosity:
![]()
Assuming constant area in the constrained layer, it is possible to find its initial density from the final density value and the relative change of length in the perpendicular direction to the layer (Dl/lic), being lic the initial thickness of the layer.

2.6. Layer thickness for the constrained films
The thickness of the electrolyte layer was measured before (lic) and after (lfc) sintering. Images from the green layer were obtained by scanning electron microscopy (SEM) in both vacuum and variable pressure (ESEM) modes. Before using SEM, the samples were covered with gold (~20 nm) using a Turbo Sputter Coater (Emitech K575X High Vacuum). In this way, the charging effect due to poor conductivity of the samples is reduced. The ESEM does not require covering the samples, minimizing the risk of contaminating the samples before sintering.
Additionally, optical microscopy, using a digital camera, was used for capturing images from the films sintered with the isothermal step for 2 h at the maximum temperature. The mean of the thicknesses of the layers after sintering was estimated from the images. Sample preparation for light microscopy included mounting them in Epofix resin mixed with alumina powder. After settling each sample, they were polished, following the adequate procedure.
Using the mean of the final layer thickness (lfc), and the change of length of the film measured by the dilatometer (including corrections), Dldil, the initial layer thickness, lic, was estimated:
![]()
The average of the results for lic was considered as the general initial layer thickness assuming the same thickness for all of them.
3. RESULTS AND DISCUSSION
3.1. Free sintering
3.1.1. Density
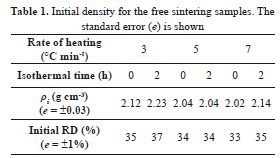
The cold pressed sample initial densities are shown in Table 1. These were obtained from the data taken from the green bodies and were compared with the values estimated from the measurements after sintering. This fact proved the consistency in the sample fabrication process, which is important in finding an adequate MSC.
In general, the results are acceptable, taking into account that the samples could continue the densification process during cooling; mainly those that did not have a dwell step in their schedule. This affects the manual measurements, in the way that the RD tends to be slightly higher than the last density values given by the dilatometer. In addition, the RD tends to decrease with increasing heating rate, as it has been reported in the literature (e.g., [2,7]).
In a similar way, the results from the samples sintered in the dilatometer were compared with those densified in the conventional furnace. The results were consistent, which suggests that the process is similar in both cases. This consistency is important as, when the constrained samples are considered, there will be greater experimental difficulties in terms of measuring, e.g., the relative densities. The results from free sintering give confidence in the techniques.
3.1.2. Density and shrinkage curves
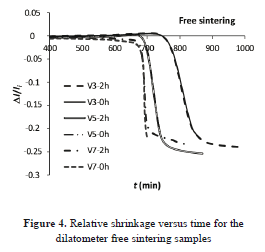
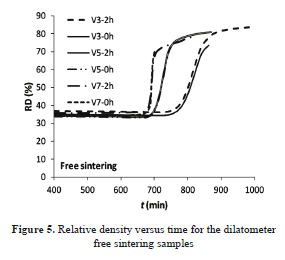
Figs. 4 and 5 show the relative change of length and relative density against time, given by the dilatometer. In the figures, "V3", e.g., means a heating rate of 3 °C min-1 and 2h corresponds to 2 h of soaking at Tmax. For each heating program, with or without an isothermal step, both samples follow the same trajectory, as expected.
3.2. Constrained sintering
3.2.1. Layer thickness
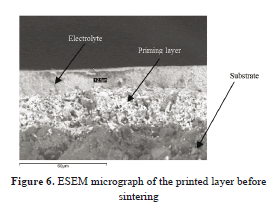
Fig. 6 shows a micrograph of the electrolyte and priming layer, before sintering, that was obtained by ESEM. This type of micrograph was used for measuring the initial thickness of the YSZ film, even though, subsequent analysis suggested that this can have borders produced when the samples were cut, which could affect the results. Therefore, the initial thickness was estimated from the final thickness, as described below.
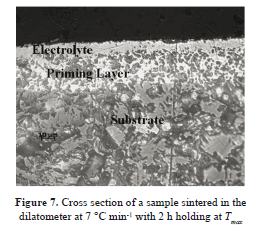
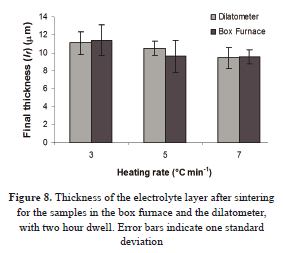
The cross section of one sample sintered with an isothermal step (two hours at about 1450 °C) is shown in Fig. 7. The image was achieved by light microscopy. The final thickness results are given in Fig. 8. There is an acceptable agreement in the data obtained for the samples sintered in both the dilatometer and the conventional oven. The bars correspond to the standard deviation.
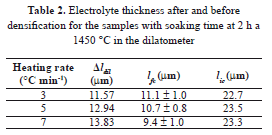
The mean value for the final layer thickness (lfc) and the change of length given by the dilatometer (Δldil) were used to estimate the thickness of the green layer (Eq. (6)). In this way, an average of 23 mm with standard error e = 0.2 mm (Table 2) was found. This value is in acceptable agreement with that reported by the manufacturer (24 mm).
3.2.2. Shrinkage of the film
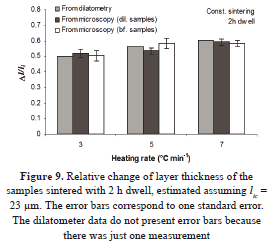
Assuming 23 mm for the initial thickness of the samples, the shrinkage of the specimens sintered with soaking time in the box furnace was calculated using the data obtained by microscopy. The corresponding information is shown in Fig. 9. The results for the samples sintered in the dilatometer are similar to those sintered in the conventional oven. The estimated values by light microscopy are reported with the standard error. The average of the sintered film among the samples sintered in the dilatometer and the box furnace is 10 ± 1 mm. This value is similar to the sintered thickness reported by Wright [7]. The congruence in the results suggests confidence in the dilatometer measuring.
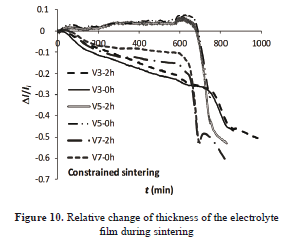
Assuming contraction of the layer only in the perpendicular direction to the substrate plane and with the data provided for the dilatometer, linear shrinkage versus time curves were built. The corresponding curves are given in Fig. 10.
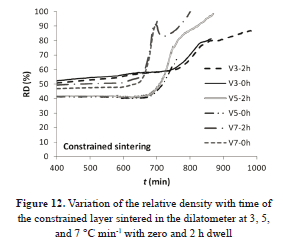
The sintered samples with 5 °C min-1 of heating rate expanded during the first heating period and then the contraction begun. The other samples show contraction throughout the heating treatment. According to some observations the base layer may have suffered densification or the substrate was not sufficiently homogeneous. The latter could have affected the results.
3.2.3. Density
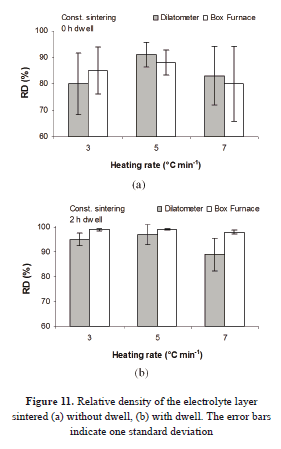
The relative densities are compared in Fig. 11. The standard deviation bars are longer for the samples with an isothermal step. This can be the result of the size, distribution, and shape variations of the microstructure, because at this degree of densification, the pores are just starting to link to each other, forming nets, and are taking a spherical shape. It means that there is not a homogeneous structure.
Even though the densities tend to be slightly higher for the samples from the conventional oven, the results are similar. A possible explanation is that in this furnace, the cooling step was bigger, leading to further densification and larger grain size. Additionally, the linear intercept method for estimating the density of the layer surface presents some difficulties. Furthermore, the restriction impedes to some degree the elimination of pores in a higher level in some zones [19] and hinders their reaccommodation. Similarly, internal stresses might contribute to the heterogeneous densification throughout the film [20].
In Fig. 12 the curves of relative density versus time are plotted. The uncertainty in the measurement of final density, taken from the micrographs, the heterogeneity in the layer, and the possible densification of the priming layer can be possible causes of the lack of convergence in the curves and for the variations in the initial density values.
3.3. Master sintering curves
The data collected were used for trying to obtain the MSC. The curves were developed by Dr. Ruoyyu Huang from Leicester University, following the process given by [21], based on finite elements. The work of sintering (Q) is determined by numerical integration and the activation energy is obtained when the curves converge.
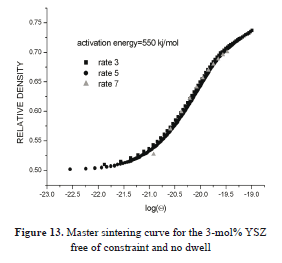
The curve for the bulk samples is shown in Fig. 13. The data converge to a single curve, with an activation energy of 550 kJ mol-1. This means that the densification kinetics is common to all the samples. There is a slight deviation for the rate of 7 °C min-1, mainly above 72% relative density, at the threshold of the isothermal step. This tendency may be due to some fact that interferes with the densification kinetics and the activation energy for this particular powder.
For the constrained layer, there was not a satisfactory convergence towards a universal curve during the process of densification. Two possible causes for this could be: there is no universal curve for this case, or the data are not reliable enough to produce the MSC. Given the problems related to the difficulty of subtracting the effect of the substrate, the latter reason must be eliminated by more experimentation before it could be concluded that a MSC cannot be achieved for this particular case.
3.4. Comparisons for free and constrained sintering
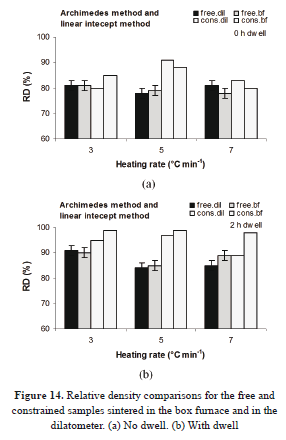
Apart from the master curves for both sintering cases (with and without restriction), it is also possible to compare the data, analyzing the relative density, as presented in Fig. 14.
The relative densities are, in general, higher for the samples sintered on the substrate. In previous works (e.g., in [22]), it has been found that the volumetric contraction tends to be lower for screen printed electrolytes than for bulk samples. However, in this work, the initial densities of the free sintered samples were lower than those of the printed layers. The average relative density for the former was 35 ± 1%, while its counterpart for the latter samples was 43 ± 4%. This contributes to the differences in this study.
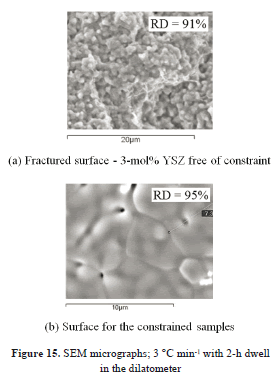
Figure 15 provides examples of the bulk and electrolytic layer microstructures.
4. CONCLUSIONS
This work reported the results of experiments with 3-mol% yttria stabilized zirconia. The material was sintered free of constraint, as well as with restriction by applying it to a rigid substrate. Three different heating rates were used: 3, 5, and 7 °C min-1. Half of the samples underwent an isothermal step at ~1450 °C; for the other half, this step was omitted. The samples relative length changes were measured in situ by a dilatometer. For improving reliability, some experiments were performed using a conventional oven. The samples reached the same level of densification independently of the source utilized for sintering.
A MSC was obtained for free sintering with an activation energy of 550 kJ mol-1. This curve can be very useful for predicting the tendencies and behaviour during densification of this specific compacted powder.
In the case of the layer printed on a substrate, the latter gives some restriction to the stabilized zirconia film. In some of the SEM micrographs taken from the surface, non homogeneity in the porosity and accommodation of the microstructure was noticed, mainly at the intermediate rate of heating used in this work. This lack of homogeneity increases the uncertainty in the measuring. Other factors, such as the difficulty in subtracting the data from the layer itself and the contribution of the substrate to the dimensional changes, are considered as possible causes for the data not converging to a single activation energy and finding a unique curve.
REFERENCES
[1] Su, H. and Johnson, L., Sintering of alumina in microwave-induced oxygen plasma, J. Am. Ceramics Soc., 79(12), pp. 3199-3210, 1996. [ Links ] [2] Kutty, T.R.G., Khan, K.B., Hegde, P.V., Banergee, J., Sengupta, A.K., Majumdar, S. and Kamath, H.S., Development of a master sintering curve for ThO2, J. Nuclear Mat., 327, pp. 211-219, 2004. [ Links ] [3] Su, H. and Johnson, L., Master sintering curve: a practical approach to sintering, J. Am. Ceramics Soc., 79(12), pp. 3211-3217, 1996. [ Links ] [4] Johnson, D.L., Finding and utilising the master sintering curve. Proceedings of Sintering 03 - An International Conference on the Science, Technology and Applications of Sintering. Pennsylvania, 15-7, September, pp. 15-17, 2003. [ Links ] [5] Hansen, J.D., Rusin, R.P., Teng, M. and Jonhson, D.L., Combined-stage sintering model, J. Am. Ceramics Soc., 75(5), pp. 1129-1135, 1992. [ Links ] [6] Teng, M., Lai, Ch. and Chen, Y., A computer program of master sintering curve model to accurately predict sintering results, Western Pacific Earth Sciences, 2(2), pp. 171-180, 2002. [ Links ] [7] Wright, G.J., Constrained sintering of yttria-doped zirconia: the relationship between microstructure and gas flow rate [PhD Thesis]. Guildford, UK: University of Surrey, 2006. [ Links ] [8] García, C., García, C. and Paucar, C., Formación insitu de circonia en la síntesis de sustitutos óseos basados en matriz de alúminacircón infiltrada con hidroxiapatita, Dyna, 77(162), pp. 143-149, 2010. [ Links ] [9] Ribero, D., Restrepo, R., Paucar, C. and García, C., Disminución de la temperatura en la síntesis de un material cerámico altamente refractario (mullita) a partir de hidroxihidrogeles, Dyna, 74(153), pp. 95-100, 2007. [ Links ] [10] Mendoza, E.J., Zamora, L.A. and Galvis, F.V., Influencia del contenido de óxido de magnesio y del tratamiento térmico en la disolución de Ca+2 de un material cerámico bioactivo del tipo 31SiO2-11P2O5-(58-x)CaO-xMgO, Dyna, 73(150), pp. 167-173, 2006. [ Links ] [11] Li, N., Mahapatra, M.K., and Singh, P., Sintering of porous strontium doped lanthanum manganite-yttria stabilized zirconia composite in controlled oxygen atmosphere at 1400 °C, J. Power Sources, 221, pp. 57-63, 2013. [ Links ] [12] Lei, L., Fu, Z., Wang, H., Lee, S.W. and Niihara, K., Transparent yttria stabilized zirconia from glycine-nitrate process by spark plasma sintering, Ceramics Int., 38, pp. 23-28, 2012. [ Links ] [13] Guoa, F. and Xiao, P., Effect of Fe2O3 doping on sintering of yttria-stabilized zirconia, J. Eur. Cer. Soc., 32, pp. 4157-4164, 2012. [ Links ] [14] Wang, X., Kima, J.-S. and Atkinson, A., Constrained sintering of 8mol% Y2O3 stabilised zirconia films, J. Eur. Cer. Soc., 32, pp. 4121-4128, 2012. [ Links ] [15] López-Honorato, E., Dessoliers, M., Shapiro, I.P., Wang, X. and Xiao, P., Improvements to the sintering of yttria-stabilized zirconia by the addition of Ni, Ceramics Int., 38, pp. 6777-6782, 2012. [ Links ] [16] Mascolo, M.C., Mascolo, G. and Ring, T.A. Grain boundary evolution on sintering in yttria (8 mol%)-stabilized zirconia assisted by one or two driving forces, J. Eur. Cer. Soc., 32, pp. 4129-4136, 2012. [ Links ] [17] ASTM Standard. C 914 - 95 Standard test method for bulk density and volume of solid refractories by wax immersion, 272-274, 1995. [ Links ] [18] BSI-British Standards Institution. BS EN 623-3 Advanced technical ceramics-monolithic ceramics-general and textural properties-part 3: determination of grain size and size distribution (characterized by the linear intercept method), 1-22, 2001. [ Links ] [19] Garino, T.J. and Bowen, K., Kinetics of constrained-film sintering, J. Am. Ceram. Soc., 5(2), pp. 251-257, 1990. [ Links ] [20] Hsueh, C.H., Carneim, R.D. and Armstrong, T.R., Modelling of constrained sintering in multilayer systems, 2007. Available: http://www.ms.ornl.gov/researchgroups/SCG/PDF/Sintering.pdf. [ Links ] [21] Kiani, S., Pan, J. and Yeomans, J.A., A new scheme to find the master sintering curve, J. Am. Ceramics Soc., 89(11), pp. 3393-3396, 2006. [ Links ] [22] Carroll. D.R. and Rahaman, M.N., An initial stage model for the sintering of constrained polycrystalline thin films, J. European Ceramic Soc., 14(5), pp. 473-479, 1994. [ Links ]


