Serviços Personalizados
Journal
Artigo
Indicadores
-
 Citado por SciELO
 -
 Acessos
Links relacionados
-
 Citado por Google
 -
 Similares em
SciELO
 -
 Similares em Google
Compartilhar
DYNA
versão impressa ISSN 0012-7353
Dyna rev.fac.nac.minas vol.81 no.185 Medellín maio/jun. 2014
https://doi.org/10.15446/dyna.v81n185.37063
http://dx.doi.org/10.15446/dyna.v81n185.37063
Testing the efficiency market hypothesis for the Colombian stock market
Comprobación de la hipótesis de eficiencia del mercado bursátil en Colombia
Juan Benjamín Duarte-Duarte a, Juan Manuel Mascareñas Pérez-Iñigo b & Katherine Julieth Sierra-Suárez c
a Escuela de Estudios industriales y Empresariales, Universidad Industrial de Santander, Colombia, jduarte@uis.edu.co
b Facultad de Ciencias Económicas y Empresariales, Universidad Complutense de Madrid, España, jmascare@ccee.ucm.es
c Escuela de Estudios industriales y Empresariales, Universidad Industrial de Santander, Colombia, katjulss@gmail.com
Received: February 9th, 2013. Received in revised form: April 14th, 2014. Accepted: May 19th, 2014.
Abstract
One of the basic assumptions of asset pricing models (CAPM and APT) is the efficiency of markets. This paper seeks to prove this requirement in its weak form, both for the General Index of the Stock Exchange of Colombia and for the Colombian market's most representative assets. To this end, different statistical methods are implemented to show that stock patterns do not follow a normal distribution pattern. Additionally, when testing the Colombian efficiency market through a series of runs, BDS, LB and Bartlett test, there is no evidence of randomness in the main financial assets except Ecopetrol. Moreover, in the specific case of IGBC there is an improvement in market efficiency from 2008 to 2010, period that coincides with the onset of the global economic crisis.
Keywords: efficient-market hypothesis, random walk, auto-regression, run test, BDS test, LB test and Bartlett test
Resumen
Uno de los supuestos básicos de los modelos de valoración de activos (CAPM y APT), es la eficiencia de los mercados. El presente trabajo busca comprobar este requisito en su forma débil, tanto al Índice General de la Bolsa de Valores de Colombia como a las acciones más representativas del mercado colombiano. Para tal fin se comprueba por diferentes métodos estadísticos que las series bursátiles no siguen el patrón de una distribución normal. Además, al indagar sobre la eficiencia del mercado colombiano, mediante los test de Rachas, BDS, LB y Bartlett, se evidencia no aleatoriedad en los principales activos financieros con excepción de Ecopetrol, mientras que para el IGBC se observa una mejora en la eficiencia del mercado del 2008 a 2010, periodo que coincide con el inicio de la crisis económica mundial.
Palabras clave: hipótesis de eficiencia de mercado, caminata aleatoria, autorregresión, pruebas de rachas, prueba BDS, prueba LB e interval.
1. Introduction
The empirical proof for the Efficient Markets Hypothesis (EMH) is based on determining if the price of financial instruments actually follows a Random Walk (RW), or in other words, if the price formation of these instruments is unpredictable and that future price is impossible to systematically forecast in order to obtain some extraordinary benefit in the marketplace. The EMH supposes that both the flow of future information and the investor's reactions are generated simultaneously and causes an "instantaneous" and random movement in prices.
According to Campbell et al. [1] the random walk is structured in three different versions, Random Walk 1, 2 and 3 (RW1, RW2 and RW3; respectively). RW1 is defined as a random walk in which the rise in prices and returns are independent and identically distributed (i.i.d), the RW2 on the other hand, requires that increments be independent, but not identically distributed, and finally the RW3, allows dependent but uncorrelated increases.
Among the pioneers for the efficient markets theory we have Bachelier [2], who in his doctoral thesis "Théorie de la Spéculation" developed a mathematical and statistical theory from the Brownian movement, explaining the efficiency of markets through the behavior of a martingale. Years later it was Cowles [3], who for the first time studied empirically the recommendations of stock analysts, arriving at the conclusion that their assertive opinions did not systematically prevail in the market, lending credibility to the theory of efficient markets.
In modern financial economics, Fama [4], another pioneer in the field of efficient markets, used extensive empirical investigations which verify the random walk model in versatile markets, highlighting the challenge that the chartists faced in predicting stock prices in the face of randomness. The definition of EMH has been changed several times by Fama, and that is how the author incorporates into the efficient market theory the concepts of transaction and information costs to show that prices reflect information only up to the point that the marginal benefits don't exceed the costs (transactional and informational) [5]. Years later he would modify again the definition of EMH to incorporate market anomaly concepts into the model: "the expected value of abnormal returns is zero, but chance generates deviations from zero (anomalies) in both directions" [6].
Paralleling Fama's work, Samuelson [7] offered the first formal theoretical argument for efficient markets, in which Price changes must fluctuate unpredictably as they incorporate. Instantaneously, the expectations and information from market participants, and that is where the author employs the martingale analogy, instead of the random walk that Fama put forward.
During the last decade and a half in Latin-American there has been much work done on market efficiency. One of the first to prove the randomness of Latin-American markets was Urrutia [8], who tested the Argentinean, Chilean and Mexican markets from 1975 to 1991 through the runs tests and quotient variation, and arriving at the conclusion that these markets do not follow a random walk. Years later, in 1997, Bekaert et al. [9] analyzed the Colombian General stock Exchange Index through runs and serial correlation test; they rejected the random walk theory from 1987 to 1994. In the new millennium, Delfiner [10], proved the relative efficiency of the Argentinean market as compared to the United States Market from 1993 to 1998, using a quotient variant test, a modified R/S test, autocorrelation and runs test, wherein were detected certain levels of dependency in Argentinean returns and Alexander filters found that in that country there were extra gains, which were lost in commissions. In 2004, Maya [11] found the presence of randomness in the Colombian market. In 2006, Zuluaga and Velásquez [12] found that it is possible to obtain returns when the investment is made in dollars, obeying the signals originated from some indicators, but conditioned to the fact that low costs of transaction can be obtained, rejecting the efficient market hypothesis in the Colombian Foreign Exchange Market. Later, Eom et al. [13] computed the Hurst exponent to test the weak-form efficient market hypothesis in 60 market indexes of various countries. They empirically discovered that Colombia has a high average Hurst exponent that evidences a low degree of efficiency.
However, the most of the studies test only the general index stock market in an only period. This paper seeks to prove the weak-form efficient market hypothesis, both for the General Index of the Stock Exchange of Colombia and for the Colombian market's most representative assets in different periods of time.
2. Methodology
The process of proving empirically begins with the definition of the simple space and the study variable, and below we perform a preliminary analysis of the series with the goal of defining if the behavior follows a normal distribution. Then, we test the data to prove if returns are independent and identically distributed, through runs and BDS tests. Finally, we verify the existence of serial autocorrelation through Barttlet and Ljung-Box (LB) test.
2.1. Data
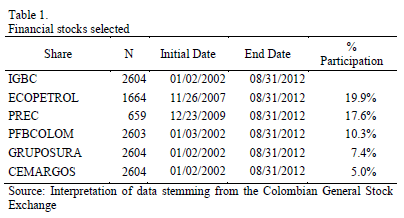
On July 3, 2011, the Colombian stock Exchange (BVC) consolidated the versatile markets of Bogota, Medellin, and Cali -which all operated independently before- into just one index. For this reason it is reasonable to begin this study 6 months prior to the opening of the index, or in other words starting in January 2002. In table 1, some selected companies have fewer numbers of observations owing to the fact that their activities were initiated after the opening day of the IGBC.
Using the Pareto principle, we identify the most representative Colombian shares, using as criteria the participation on the Colombian General stock Exchange Index (IGBC). In Table 1, it is shown the stocks which form 60% of the index with the corresponding dates and number of observations.
2.2. Preliminary analysis of financial series
The objective of understanding the behavior of the data makes necessary the application of a statistical analysis which allows us to define the best adjustment of the empirical distribution. To this end we implement two stages: in the first we calculate the basic statistics, together with the Jarque-Bera (JB) test in order to determine if the series has a normal distribution; second we submit the data to ordering in so as to rank the adjustments of theoretical distributions. We use return performance compounded continually as the variable for the study, considering the advantages mentioned by [1].
2.3. Testing the efficiency market hypothesis
As was illustrated in the theoretical listing, different tests are available to prove the EMH. This study will first proceed to apply the nonparametric tests (Runs and BDS) with the purpose of identifying whether rising returns are independent and identically distributed, or rather fitting version RW1 of the Random Walk. Similarly, to prove version RW3 we estimate the LB test, which together with the corresponding correlation analysis suggested by Bartlett, seek to identify the returns that are not correlated.
The nonparametric runs test or the Wald–Wolfowitz [14] test, seek to test the hypothesis of market efficiency by contradicting the RW1, using this as a basis for the number of series (R) found in the sequence, so that small or large quantities of R imply no randomness in price generation. This variable behaves asymptotically as a normal distribution, that when standardized generates a discrete statistic for the eq. (1).

Where  is the number of returns above the mean and
  is the number of returns below the mean, we reject the i.i.d return if the value of p is less than 5%.
BDS Test.
The BDS test developed by Brock et al, and implemented in 1996 together with LeBaron [15], is characterized for being a nonparametric statistical test strongly tending away from linear and non-linear structures [16], which seeks to prove the null hypothesis that a temporary series is i.i.d The theoretical explanation of this test proves, in part, the fact that when using a series of  returns
  of a financial stock, which follows some function of distribution f (
 ~ f), that upon determining an epsilon (e) greater than zero and less than a range
 , or
, or  . The BDS test hypothesis is
 .
.
In order to obtain probability , we use correlation integral
  [17] and [18]. So that with an immersion
  and a distance of e with n observations, the statistic
  is defined by the eq. (2).

Once the BDS test is completed and following the recommendations of previous tests [19] which suggest estimating the tests for various epsilons in order to substantiate their acceptance or rejection, using four different epsilons: 0.5, 1, 1.5 and 2 typical deviations of the data. We use dimensions  = {2-6} with the intent of observing the statistical behavior as
  grows.
On the other hand, to find the self-correlation in stocks returns, it is used the Bartlett test and the Ljung-Box Q test, which are shown below.
2.3.3. Ljung-Box Test.
This test is a variation of the Box and Pierce Q test, which seeks to prove that, the hypothesis that the  coefficients of Autocorrelation are simultaneously zero [20]. The statistic LB is defined by eq. (3).

Where  is the size of the sample and
  is the lag. The null hypothesis is rejected if p_value <5%.
2.3.4. Bartlett Test.
This proof analyze the individual hypothesis that "some" of the Autocorrelations are other than zero, and to this end we turn to what Bartlett demonstrated [21], meaning that if a time series is purely random (white noise), the coefficients of correlation behave asymptotically like a normal distribution with mean of zero and variance of , in which case the 95% confidence level for any
  is defined as
  ) ó
) ó  .
.
3. RESULTS
Following are the results of the statistical tests described in the methodology, and appearing in the very same order:
3.1. Preliminary series analysis
In Table 2, we see the first four moments for the data, their maximums and minimum values and the probability for type I errors in the Jarque-Bera statistic. From the statistical data, we can see that the skewness and kurtosis of different financial instruments do not correspond to the characteristics of a normal distribution, especially in the fourth moment, which for all cases is higher than the typical 3 for ormal distribution. Another important observation is the fact that the minimums and maximums in the series are more than the standard ±6 deviations, showing long tails in the distributions, which is also not typical of a normal distribution. The mean and median of the different stocks approach zero, but are different one from another, contradicting the equality which these two parameters should share in a normal distribution. In summary, from the basic statistics the following may be observed: strong leptokurtosis in all stocks; asymmetry, most especially with Ecopetrol and Cemargos; distributions largely reflecting maximum and minimum values, which leads to the conclusion that none of the analyzed series behaves as a normal distribution, however the Pacific Rubiales share can be deemed the stock which most closely resembles a normal distribution.
The presumptive abnormality of the series, detected through the analysis of the first four moments, is confirmed by the Jarque-Bera test, as shown in the data from Table 2, wherein different financial stocks show P values and JB equal to zero in all cases, thereby rejecting the normality hypothesis of the instruments.
Moreover, after performing the adjustment tests through the  statistic, we see that the distribution that best describes the majority of the series is Logistic, which ranks first in 83% of assets, while, the normal distribution comes out in second place in 4 of the 6 series analyzed, thus supporting the results from the basic statistics and the Jarque-Bera test previously analyzed. Below we proceed to perform a statistical inference to determine whether the returns behave like Random Walks 1 and 3.
3.2. Runs test
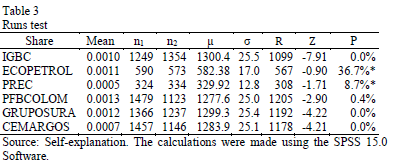
From Table 3 we deduce that for most of the stocks the returns are not i.i.d, except Ecopetrol and PREC. This can be owed to the fact that from their inception these are the two national stocks with the highest trading volumes in the country (Table 1).
3.3. BDS test
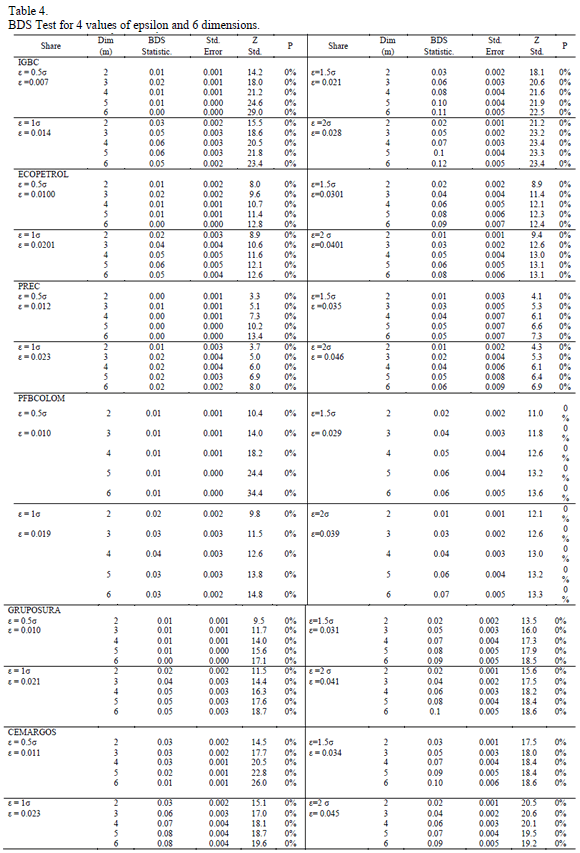
The Table 4 shows the results from the BDS test, from which we may conclude that the different financial series not show i.i.d, as evidenced by the fact that in all calculations the standardized BDS is much greater than Z2.5% (1.96) generating type 1 errors 1 of 0%.
In much the same way we can see that even as we increase epsilon, the hypothesis must still be rejected, because generally the value of the statistic is greater than 10, producing p_values of zero for all stocks, epsilons and dimensions given. Note that as the dimension is increased, the statistic generally grows as well, thus ratifying the rejection of 
The results of the BDS test are coherent and consistent with previous investigations [22], [1] and [15] in the sense that this test has strong potential to detect linear and non-linear structures, and it is for this reason that we reject the i.i.d hypothesis for all stocks, indicating that the Colombian financial series contain some type of structure.
3.4. Serial correlation analysis
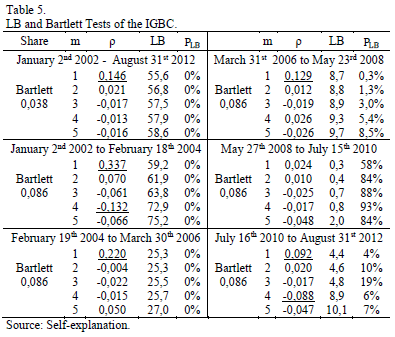
To contrast the LB and Bartlett tests we will proceed in the following way: first, with the intent of evaluating the IGBC over time, we estimate the tests, dividing the study period into smaller groups of 520 observations each, spanning over the period from January 2, 2002 to August 31, 2002 (Table 5); secondly, we evaluate the data for the entire analysis period (2002-2012).
To decide the number of moments there is reference to Tsay [23], who basing in simulation studies, suggests taking m ≈ ln(n), Therefore, for this study, we consider it appropriate to use up to 5 lags.
Upon observing the IGBC data in Table 5, we find that the p_value of the LB test is zero both for the entire period and for the two first sub-periods, thus rejecting the hypothesis of randomness until 2006, so that for the three remaining periods from 2006 to 2012 we do not reject a randomness theory for the prices in the Index, in other words, we find an improvement in the market efficiency following 2006. Note also that the highest values for type 1 errors for the combined LB test appear in the sub-period 2008 - 2010.
Moreover, taking into account the Bartlett test, Table 5 highlights different periods, the significant Autocorrelations from the first moment (and fourth in sub-periods 1 and 5), which can be interpreted to mean that the Index could at least
present an auto-regressive model of the first order. Again in the period 2008-2010 we reject the individual hypothesis that the moments are significant, reaffirming Random Walk 3 for this period.
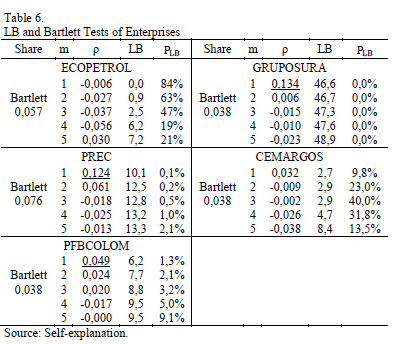
In Table 6 we evaluate the shares over the period from January 2, 2002 to August 31, 2002 (Table 6).
Upon analyzing the data in Table 6, we find that for the Ecopetrol and Cemargos stocks, we do not reject the combined hypothesis which asserts that the autocorrelations are zero and this because of the evidence of randomness in the stocks. The opposite occurs in the case of the PREC, PFBCOLOM and Gruposura series; these reveal significant Autocorrelations in some of their moments, a reflection of non-randomness. As respects the significant individual Bartlett test, we again see what we have already evidenced since it identifies serial correlation in the first moment for PREC, PFBCOLOM and Gruposura.
Note that in the analysis of the series test, the two stocks with the most random profiles are Ecopetrol and PREC, while in the Autocorrelation analysis, the other stocks illustrate the same phenomenon are Ecopetrol and Cemargos, meaning that Ecopetrol meets the conditions of Random Walk 1 and Random Walk 3.
4. CONCLUSIONS
Through the analysis of the first four moments and the Jarque-Bera test, we find that the main financial stocks in Colombia do not follow a normal distribution, which is ratified by the analysis of statistic  , further illustrating that the stock which best fits the financial series is Logistic, and notwithstanding the importance of the ranking of the adjustments, the normal distribution occupies second and third place for the four stocks (IGBC, PREC, Gruposura and Cemargos), which stocks represent 30% of the Colombian market.
Upon proving EMH through series tests, the BDS test, LB and Bartlett tests, we deduce that for the entire evaluated period (2002-2012), the Colombian market lacks weak market efficiency. For the IGBC we also find that breaking down the period into sub-periods we see an improvement in the efficient markets hypothesis for the 2008 to 2010 period.
We see evidence of serial correlation between 5% and 20% in the IGBC, PREC, PFBCOLOM and Gruposura stocks, concentrated principally in the first moment, which leads to the conclusion that the price of these stocks may be partly explained by Random Walk 1.
REFERENCES
[1] Campbell J, Lo A, Mackinley A. The Econometric Of Financial Markets Princeton, New Jersey: Princeton University Press; 1997. [ Links ]
[2] Bachelier L. Théorie de la speculation. Annales scientifiques de l'école normale superieure. 1900; 3: pp. 21-86. [ Links ]
[3] Cowles A. an Stock Market forecasters forecast? Econometrica. 1933; 1: pp. 309-324. [ Links ]
[4] Fama E. Random Walks in Stock Market Prices. Financial analysts journal. 1965; 21: pp. 55-59. [ Links ]
[5] Fama E. Efficient Capital Markets:II. The journal of finance. 1991; 46(5): pp. 1575-1617. [ Links ]
[6] Fama E. Market Efficiency, Long-term Returns, and Behavioral Finance. Journal of financial economics. 1998; 49: pp. 283-306. [ Links ]
[7] Samuelson pp. Proof that properly anticipated prices fluctuate randomly. Industrial management review. 1965. [ Links ]
[8] Urrutia J. Tests of random walk and market efficiency for Latin American emerging equity markets. Journal of financial research. 1995; 18: pp. 299-309. [ Links ]
[9] Bekaert G, Erb C, Harvey C, Viskanta T. What matters for emerging markets investments? Emerging markets quarterly. 1997: pp. 17-26. [ Links ]
[10] Delfiner M. Comportamiento de los Precios de las Acciones en el Mercado Bursátil Argentino (Un Estudio Comparativo). Working Papers, Universidad CEMA. 2002; 215. [ Links ]
[11] Maya C, Torres G. The unification of the Colombian stock market:a step towards efficiency. Empirical Evidence. Latin american business. 2004; 5(4): pp. 69-98. [ Links ]
[12] Zuluaga M, Velásquez J. Selección de indicadores técnicos para la negociación en el mercado cambiario colombiano I: comportamientos individuales. Revista DYNA. 2006; 74(152): pp. 9-20. [ Links ]
[13] Eom C, Choi S, Oh G, Jung WS. Hurst exponent and prediction based on weak-form efficient market hypothesis of stock markets. Physica A. 2008; 387: pp. 4630–4636. [ Links ]
[14] Wald A, Wolfowitz J. On a Test Whether Two Samples are from the Same Population. Ann. Math. Statist. 1940; 11(2): pp. 147-162. [ Links ]
[15] Brock W, Dechert W, Scheinkman J, LeBaron B. A test for independence based on the correlation dimension. Econometric reviews. 1996; 15(3): pp. 197-235. [ Links ]
[16] Dechert W. A Characterization Of Independence Fo A Gaussian Process In Terms Of The Correlation Integral. Working papers 8812, Wisconsin Madison - Social Systems. 1988. [ Links ]
[17] Grassbeger P, Procaccia I. Characterization of Strange Attractors. Physical review letters. 1983a; 50(5): pp. 346-349. [ Links ]
[18] Grassbeger P, Procaccia I. Measuring Strangeness of Strange Attractors. Physica D. 1983b; 9 : pp. 189-208. [ Links ]
[19] Álvarez N, Matilla M, pp. P, J. R. Análisis de las deficiencias del test BDS en series temporales univariantes. ASEPUMA. 2002; 10 (1): pp. 4. [ Links ]
[20] Ljung G, Box G. On a measure of lack of fit in time series models. Biiometrika. 1978; 65(2): pp. 297-303. [ Links ]
[21] Bartlett M. On the Theoretical Specification of Sampling Properties of Autocorrelated Time series. Journal of the Royal Statistical Society. 1946; 27: pp. 27-41. [ Links ]
[22] Barnett W, Gallant R, Hinich M, Jungeilges J, Kaplan D, Jensen M. A Single-Blind Controlled Competition among Tests for Nonlinearity and Chaos. Journal of econometrics. 1997; 82(1): pp. 157-192. [ Links ]
[23] Tsay R. Analysis Of Financial Time Series: Editorial JHON WILEY & SON, INC; 2002. [ Links ]
J. B. Duarte-Duarte, received the Bs. Eng in Industrial Engineering in 1991 from the Universidad Industrial de Santander, Colombia. He received the MS degree in Corporate Finance in 2008, and the PhD degree in Corporated Finance in 2013 both from the Universidad Complutense de Madrid, España. Since 1994, he has worked as professor. Currently, he is a Full Professor in Finance in the Escuela de Estudios Industriales y Empresariales, Universidad Industrial de Santander. His research interest include: stock markets, financial theory and economic.
J. M. Mascareñas-Perés-Iñigo, is PhD in Economics and Business at the Universidad Complutense de Madrid (UCM) since 1984 and Grade in Economics and Business at UCM (1979). He is Full Professor in Financial Economics from 1992 (UCM) and Associated professor at IE Business School from 1998. He was also Vicedean at the Faculty in Economics and Business (UCM) 1990-1994. In South America he is Advisor in Ph D Program on Business (Universidad Nacional Autónoma de México) from 2005 and Advisor in PhD Program on Business (Universidad La Salle de México) from 2011. Specialized in Corporate Finance (Mergers & Acquisitions, Firm and Asset Valuation, and Real Options) and Financial Markets (Fixed Income, Variable Income, Derivatives), he has published more than 29 books, 65 research papers and 43 Monographs on Corporate Finance (http://www.juanmascarenas.eu/jm2pub.htm). He currently heads the Journal of IEAF Financial Analysis and serves on the Editorial Board of The Accounting and Administration Journal (Mexico), the Spanish Journal of Venture Capital and the European University Magazine.
K. J. Sierra-Suárez, received the Bs. Eng in Industrial Engineering in 2012 from the Universidad Industrial de Santander, Colombia. She is master candidate in Industrial Engineering from the Universidad Industrial de Santander. Currently, she is a professor in economics engineering in the Escuela de Estudios Industriales y Empresariales, Universidad Industrial de Santander. His research interest include: stock markets, financial theory and economic.


