


Serviços Personalizados
Journal
Artigo
 Inglês (pdf)
 Artigo em XML
 Referências do artigo
 Enviar este artigo por email
Indicadores
-
 Citado por SciELO
 -
 Acessos
Links relacionados
-
 Citado por Google
 -
 Similares em
SciELO
Similares em
SciELO -
 Similares em Google
Compartilhar

 Permalink
DYNA
versão impressa ISSN 0012-7353
Dyna rev.fac.nac.minas vol.81 no.185 Medellín maio/jun. 2014
https://doi.org/10.15446/dyna.v81n185.37700
http://dx.doi.org/10.15446/dyna.v81n185.37700
Hydro-meteorological data analysis using OLAP techniques
Análisis de datos hidroclimatológicos usando técnicas OLAP
Néstor Darío Duque-Méndez a, Mauricio Orozco-Alzate b & Jorge Julián Vélez c
a Departamento de Informática y Computación, Universidad Nacional de Colombia Sede Manizales, Colombia. ndduqueme@unal.edu.co
b Departamento de Informática y Computación, Universidad Nacional de Colombia Sede Manizales, Colombia. morozcoa@unal.edu.co
c Departamento de Ingeniería Civil, Universidad Nacional de Colombia Sede Manizales, Colombia. jjvelezu@unal.edu.co
Received: April 8th, 2013. Received in revised form: November 1th, 2013. Accepted: November 25th, 2013.
Abstract
The wealth of data recorded by meteorological networks provides a great opportunity for analyzing and discovering knowledge. However, efficient data storage and its effective handling are prerequisites for meteorological and hydro-climatological research and require strategies for capturing, delivering, storing and processing that guarantee quality and consistency of the data. The purpose of this work is to develop a conceptual model for a data warehouse in a star schema that allows the structured storage and multidimensional analysis of historical hydro-climatological data. Information registered by two telemetered networks of hydro-meteorological stations has been collected in the city of Manizales, Colombia. From the designed data warehouse schema, the data warehouse exploits the data (in some cases extending back more than 50 years) in order to apply online analytical processing (OLAP) techniques and discovery potential high-value hidden relationships, in a region particularly affected by climate change and climate variability phenomena. The core contribution of this paper encompasses the exploration of alternatives to the traditional storage and analysis methods and the presentation of a number of cases, showing the effectiveness of the proposed model in the evaluation of the data quality and the visualization of relationships among diverse variables in different scales and for specific cases.
Keywords: data mining; OLAP techniques; hydro-climatological data analysis.
Resumen
La riqueza de los datos registrados por las redes de estaciones hidrometeorológicas ofrece una gran oportunidad para analizar, conocer y entender mejor las variables hidroclimatológicas. Por lo tanto, el almacenamiento eficiente de los datos y su tratamiento eficaz son un requisito previo para la investigación meteorológica e hidrológica que requiere de estrategias para que la captación, transmisión, almacenamiento y procesamiento de datos que garanticen su calidad y consistencia. El propósito de este trabajo es desarrollar un modelo conceptual para una bodega de datos diseñada en un esquema en estrella que permita el almacenamiento estructurado y el análisis multidimensional de series históricas de datos hidroclimatológicos. La información registrada por las redes telemétricas de estaciones hidrometeorológicas existentes en Manizales y en el Departamento de Caldas son la fuente de información. El esquema de bodega de datos propuesto aprovecha los datos disponibles (en algunos casos más de 50 años) con el fin de aplicar procesamiento analítico en línea (OLAP) para analizar la calidad de la información y descubrir relaciones ocultas entre las variables, en una región particularmente afectada por el cambio climático y especialmente por fenómenos de variabilidad climática. La principal contribución de este documento abarca la exploración de alternativas a los métodos tradicionales de almacenamiento y análisis de información y la presentación de un número de casos que demuestran la eficacia del modelo propuesto en la evaluación de la calidad de los datos y de la visualización de las relaciones entre las diversas variables a diferentes escalas y para casos específicos.
Palabras clave: minería de datos; técnicas OLAP; análisis de información hidro-climatológica.
1. Introduction
The large amount of data collected at the hydro-meteorological stations, have previously only been used to describe the current or historical conditions of the variables. But, nowadays, exploiting the physical measurements is a high-interest issue [1, 2].
In order to profit from that high volume of data, coming from different hydro-climatological variables registered in real-time at small sampling periods, it is necessary to design and implement suitable storage schemata and apply tools that exploit the large amount of data, get information from them, discover hidden knowledge through their relationships and trends and, hopefully, allow the forecasting of future behaviors.
Since the last decades, multiple applications of artificial intelligence in hydrology and water resources research have been reported. All these approaches include different techniques such as autoregressive moving-average (ARMA) models [3], genetic algorithms [4], adaptive neural-based fuzzy inference system (ANFIS) techniques [5], artificial neural networks (ANNs) approaches [6], genetic programming (GP) models [7], support vector machine (SVM) methods [8] and, most recently, data mining techniques as On-Line Analytical Processing (OLAP) and data warehouses [9] which allow the users to organize and query large hydrological data collections.
Handling, analyzing and preparing climate and hydrological data as well as producing information are usually the most tedious stages of water resources management, but also the most important ones because they reduce the uncertainty associated with the data. This paper is aimed to tackle this problem through an appropriate data management tool.
Domiguez et al. [10] assessed the importance for society of being informed about the weather; in addition, temperature changes suffered at Coahuila state (Mexico) are shown in a graphical, measurable and detailed way by using a data warehouse containing information about the temperature, wind, hours and dates, which allows analyzing information by means of a tool called Power Play Transformer. Ma et al. [9] proposed the design and implementation of a meteorological data warehouse, along with a report schema based on Microsoft SQL server; their data warehouse is aimed at the meteorological analysis and research, it uses online analytical processing (OLAP) and multidimensional reports by analyzing the stored data, which is available online. Tan [11] described a data warehouse for climate forecasting and developed four analysis schemata based on multidimensional analysis, determining valid combinations between facts and dimensions. Bartok et al. [12] described a study on parameterized models and methods for the detection and forecasting of significant meteorological phenomena, including, firstly, methods for integration of distributed meteorological data required for the functioning of the prediction and model formation and, secondly, the data extraction aimed at achieving a fast and efficient prediction of the phenomena, even at random. Monitored data arranged in a consistently formatted database, from which the model could learn probabilistic relationships between model elements, is presented in Williams and Cole [13] demonstrated the use of Bayesian networks for data-mining and decision-making. Cortez and Morais [14] explored data mining techniques, supplied with meteorological data, to predict forest fires in areas of Portugal. Meanwhile, in Lemus et al. [15], a knowledge discovery in databases (KDD) process is presented in which attribute selection and regression tasks are performed in order to analyze dependencies between meteorological parameters and estimate secondary ones. In a previous work, Duque et al. [16] applied data mining techniques on historical data systematically collected by a network of telemetered hydro-meteorological stations. As a result, the authors have obtained a first approach to the understanding of trends in the behavior of some variables at the study site. Chen et al. [17] collected data in a comprehensive database built by a water information process in China; taking the decision support of water as an example, they discuss how to build a data warehouse system based on comprehensive database and designing a general structure of data warehouse. Wang et al. [18] have performed a comparison of several artificial intelligence methods for the monthly forecasting of discharge time series.
From the above review it can be determined that the central problems of these articles are the need to define schemas, models and mechanisms for organizing and storing the obtained physical data measurements; besides, another main interest includes the techniques for data processing, not only oriented to descriptive results, but also with the goal of discovering hidden knowledge.
The proposed data management tool allows data assimilation in order to understand and improve inputs and outputs in geoscience models. The data analysis typically performed depends on the type of information. In the case of discharge time series, homogeneity tests are performed; for precipitation time series, double mass analyses are proposed, as well as nonparametric statistical tests for independence analysis. In the case of temperature, its verification analysis is usually performed with other variables such as temperature vs. precipitation, also called climographs [19]. For climate variability studies, it is also interesting to understand the day/night variability patterns and cycles. This approach points to establish trends in the behavior of such variables and, insofar as possible, to predict them. The ultimate goal is building a data warehouse that allows organizing historical information, updating data with the measurements gathered at the stations and the application of OLAP techniques, allowing the generation of multidimensional reports and meteorological forecasts.
The remaining part of this paper is organized as follows. Section 2 presents the distribution of the deployed stations and describes the data collected. Related concepts and the description of the proposed model are presented in Section 3. Results are presented in the subsequent section and, finally, conclusions and future work are discussed in the last section.
2. Monitoring system and captured data
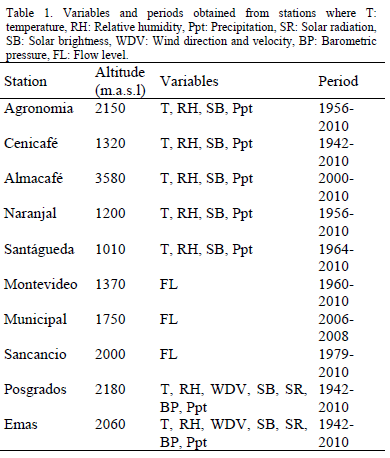
Currently, data from two telemetered networks of hydrometric and meteorological stations are available in Manizales and Caldas. Such stations transmit data, via radio and in real-time, to a receiving base station located in Manizales city at two specific places: the Corpocaldas headquarters and at Instituto de Estudios Ambientales (IDEA) of Universidad Nacional de Colombia - Sede Manizales. In Table 1, sampling periods and recorded variables are detailed; a number of them are recorded at a rate of 1 sample/5min. A more detailed description of this process can be found in Mejia and Botero [20], and Vélez at al. [21].
Due to the difficult climatic conditions in the monitoring zones, several setbacks have interrupted the continuous data acquisition. In 2009-2010, a total rehabilitation process for all the stations was started. Currently, IDEA is installing new stations at strategic places and agreements for the preventive maintenance and permanent surveillance of the data emission at the stations have been signed. Such endeavors are aimed to detect failures at the stations, in such a way that they can be repaired in time. Each station collects, in real time, information about temperature, relative humidity, rainfall, wind direction and speed, and solar radiation, all along with time stamps including hour and date of the last transmission, which can be constantly updated. These data and a Meteorological Bulletin can be accessed through the IDEA web site (http://idea.manizales.unal.edu.co/). Daily reports for each station, as well as monthly and annual ones, can be found.
The objective of this paper is building an integrated system that includes a data warehouse that allows historical information to be organized, updating data with the measurements gathered at the stations and applying KDD techniques in order to obtain underlying knowledge from the data.
3. KDD process for the hydro-climatological stations
Knowledge discovery in databases (KDD) is a field from computer science that tries to exploit the overwhelming amount of available information, extracting hidden knowledge that could assist humans to carry out tasks in an efficient and satisfactory way. KDD can be defined as a non-trivial process to identify valid, novel, potentially useful, and, ultimately, understandable patterns from the data [22]. It is a process that covers different stages as shown in Fig. 1.
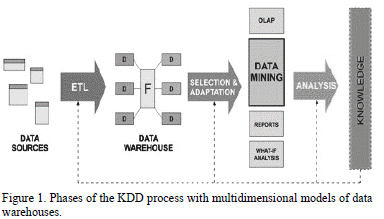
As seen in Fig. 1, building a data warehouse implies taking decisions about the architecture to be implemented and the previous process of Extract, Transform, Load (ETL) from the original data (operational) to the data warehouse. ETL operations are specific to the data set to be considered.
There are two modes to store data in data warehouses: relational databases and multidimensional databases. The efficient data storage and its correct manipulation are problems and prerequisites for success in meteorology and climatology [23]. The core of OLAP is the multidimensional analysis, where a dimension can be any aspect of the data and the main purpose is to explore the data in order to find relationships or patterns instead of just looking at its isolated behavior. In the business field data warehouse has shown great benefits exploiting volumes of data, so it is expected that also the application of data warehouse technologies in the domain of hydro-climatology is advantageous due to the manipulation of large amounts of data from different origins and the possibility of applying diverse data analysis techniques.
In this work, we will show the benefits from storing hydro-meteorological data in a multidimensional model and an application of OLAP techniques, allowing the generation of multidimensional reports and, therefore, obtaining relevant information for the historical analysis in real-time and meteorological forecasts.
3.1. Multidimensional model in star
The multidimensional model in data warehouses is a logical design technique that seeks to present data in an intuitive form and with high performance. Each multi-dimensional model is composed of a table having multiple foreign keys, called fact table, and a set of smaller tables called dimension tables. Attributes of the dimension table determine search restrictions in queries of the data warehouse and, typically, are used as row headings resulting from SQL queries. There are two approaches in the design: the star schema and the snowflake schema [24].
In the star schema, there is a fact table and, within it, foreign keys to each one of the dimension tables of the model. Each dimension table is directly related with the fact table. A simple structure in star has only one fact table. Facts are measurements of variables that are considered and often associated to numerical values that support calculations. Dimensions, or text-type attributes that describe things, are used to define restrictions and serve as headings in the reports. By adding restrictions to a search, a drilling down is carried out; that is, a higher level of detail is achieved. An efficient drilling down mixes attributes from
the different dimensions in order to make robust reports. Keys in data warehouses must be surrogate, that is, they do not mean anything about the system and keys from the original data sources are not used. Granularity represents the level of detail of the data units in the warehouse [24].
Fig. 2 graphically shows the design of the data warehouse and the components of the unique fact table as well as those of the dimensions involved.
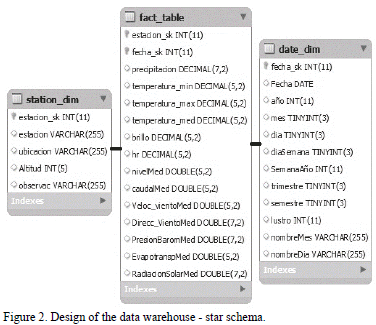
The core of the model is the fact table from which the dimensions depend on. In this case study, attributes of the fact table are: station_sk, date_sk, rainfall, temperature_min, temperature_max, temperature_med, brightness, hr, average flow, average level, wind speed and direction, barometric pressure, evapotranspiration and average solar radiation. The basic dimensions are station and time. There are several levels of granularity for the case of the time: year, month, day, trimester, semester, lustrum and decade; in such a way, multidimensional views can be extended. An identifier and the location (municipality and coordinates) are saved for the station dimension and the data granularity can be divided into specific areas, regions, latitude, longitude, etc.
3.2. ETL process
Due to the amount of data, the different schemata used to store them and the different periods to which they belong, it is common the presence of noise, inconsistent or redundant data and, for our particular case, a disturbing factor was the organization of the data acquired at the stations in spreadsheets in order to provide better visual formats. In order to store the data in the data warehouse, the application of a preprocessing techniques to the data sets is required; such a process is known as ETL. The objective of ETL is to obtain data sets such that, when applying OLAP techniques, results representing reality are generated and relevant views are delivered. It is implemented to reinforce quality and consistency of the data sets and to adapt them to the formats required for processing and analysis.
The source data for this study exhibited drawbacks regarding the organization and formats since they come from stations that have been working for many years. Those data had been saved in different files and adequate templates for human-based processing but inconvenient for an automatic one. This occurred in particular with the dates, because there are different administrators of the climate monitoring network. On the other hand, in that long period, transmission conditions suffered changes and, in some cases, there were no values for several variables under observation.
The free software Talend Open Studio was used to perform some of the extraction and load steps. Data in inappropriate forms were manually debugged in order to find data according to the reported variables. Missing data were treated as NULL values, in order to guarantee that they were not considered in the sum operations. For the case of inconsistent data, such as negative flows or excessive temperatures, values were either discarded or replaced by averages according to the opinion of the experts.
In order to obtain the dimension date, we generated a table including all the dates, from the older to the most recent one, within the given date intervals (e.g. day by day). The following queries were applied to generate values of the other fields having different granularity:
- update date_dim set trimester= 1 where month between 1 and 3;
- update date_dim set nameDay="Sunday" where dayWeek=1;
- update date_dim set nameMonth= "December" where month=12;
- update date_dim set lustrum=13 where year between 2010 and 2014;
The process of migrating the original data to the fact table is not trivial and requires that the respective dates are maintained and the measured values are updated according to the dimensions involved. This was achieved by using specialized SQL queries. At the end, the model shown in Fig. 2 was completely populated and enabled to apply OLAP techniques.
4. Application of OLAP tools
OLAP techniques have been widely used in finance, sales and marketing; nonetheless, their applications in scientific studies are relatively recent [25]. Consequently, the proposal presented here can be considered as a novelty. The application of multidimensional analysis techniques from different approaches oriented to different tasks, in addition to validation with real data is one of the contributions of this work.
Considering the proposal in Ma et al. [9], different multidimensional analyses were carried out, obtaining valuable results not just to assess the data quality but also to evaluate relationships among the variables.
Some examples are given below:
4.1. Data quality
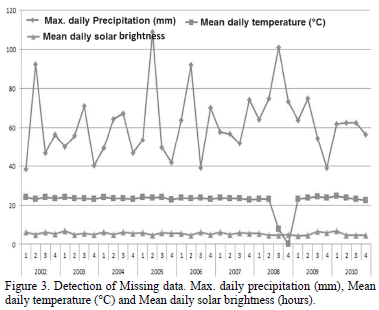
Fig. 3 easily reveals that there are missing data for temperature data at Santágueda station during the fourth trimester of 2008. Similarly, it shows the good behavior of the variables solar brightness and precipitation.
A similar situation is observed in Fig. 4, where there is a significant decrement in the average temperature during 2008, which demands a revision to determine whether the data are erroneous or it is a change due to a climatic phenomenon.
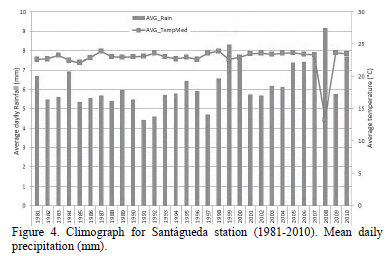
It is worth mentioning that this initial quality analysis of the information must be complemented with rigorous statistical tests that demonstrate correlations, changes in the average values, trends and data consistency, which are also available in the model.
4.2. Relationships
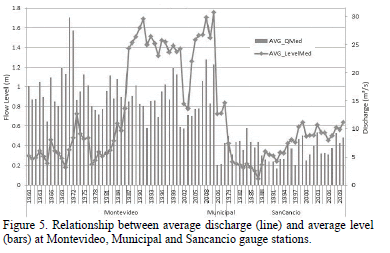
Fig. 5 exhibits the behavior of the average flow and average level for three gauge stations, with data for 50, 3 and 30 years for Montevideo, Municipal and Sancancio gauge stations, respectively. In this figure, the existent correlation between level and flow should be visible; thereby, a problem with the calibration of the Montevideo station is evidenced. It indicates that experts must check and correct this situation. Something similar happens with the other stations in the network.
On the other hand, Fig. 6 allows appreciating relationships and trends of flow and level during the last 15 lustra for three stations.
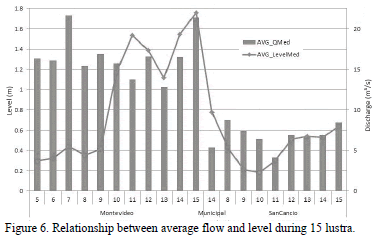
Temporal aggregation can be performed easily within the model as shown in Fig. 6, but it can affect the results and mask discontinuities and errors because of the aggregation process.
4.3. Multiscale analysis
Mutiple possibilities are offered by the model, from the different levels of granularity, which allows the analysis in different time scales ranging from every five minutes to every five years. All these advantages are available for users by just making a few selections. Fig. 7 is an example of data obtained for a single day, having measurements every five minutes for two different variables.
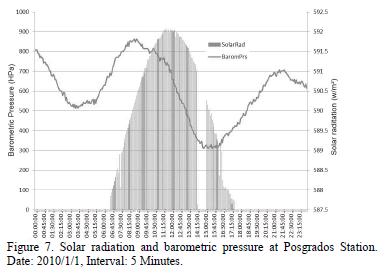
Fig. 7 extracts the best information related with day/night cycles observed in climatological data, which can be exploited by researchers.
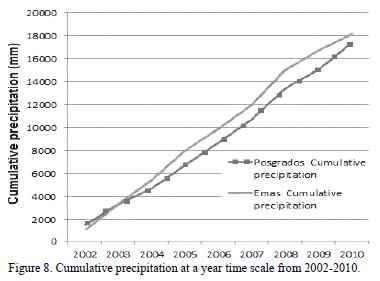
Moreover, it allows cumulative values from instantaneous data to be obtained. In Fig. 8, the behavior of the cumulative rainfall for two stations in the period 2002-2010 can be seen, it is called double mass curve and explains the continuity of registered data and its relationship between rain gauges.
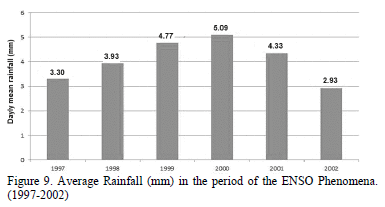
In order to obtain larger time periods of analysis, it is enough to group by larger time units as shown in Fig. 9. Where it is shown an increment in rainfall which is mainly caused by La Niña phenomenon, from 1999-2001. Therefore, climate variability analysis can be carried out satisfactorily.
4.4. Variability analysis
The possibilities offered to users and researchers that, with a few actions can change the type of the variables, the time scale, the stations and the visual display of the data, are an added value that turns this proposal into an important tool not just for the analysis in a given detail level but also
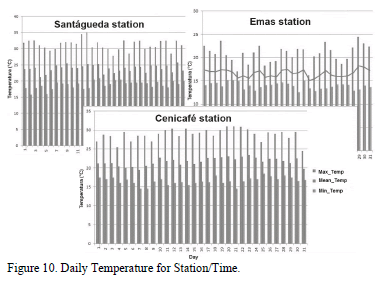
for the application of summary operations over the stored measurements. Fig. 10 is a mixture of results obtained by just changing the selection of the parameters for analysis. It demonstrates the versatility of the proposed model.
4.5. Trends
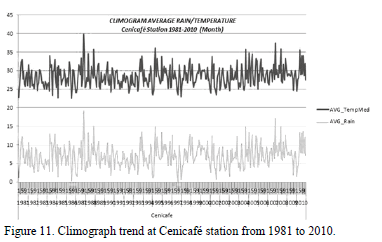
Fig. 11 registers, on a monthly basis, averaged values of temperature and precipitation at Cenicafé station during the last few years. The behavior, with a slight incremental trend in the temperature, can be seen.
The above-mentioned examples are just a sample of the possibilities offered with the implemented model. Practical results are already in use, they are a valuable tool for data cleaning and consistency assessment. Facilities included in the proposed model allows researchers to interact in an easy way and obtain immediate results. Operations such as roll up, slice, dice and rotation (pivot) provide a great versatility in the usage.
5. Conclusions
The existence of a large volume of hydro-climatological data with registers taken during many years is not a guarantee, by itself, of obtaining valuable results. For such a purpose, the application of storing and data analysis techniques is needed that exploit the registers in order to obtain information and knowledge.
The good results obtained in the validation of the proposed model are due to the proper design of a multidimensional warehouse in star schema, correctly defining the dimensions, facts and measures; as well as to the proper application of OLAP techniques, this is reflected in the data quality assessment processes, data aggregation for group analysis, temporal multi-scale analysis, for relationships among obtained measurements and as a first approach to the underlying trends.
The organization of the data in the data warehouse, by itself, is already an added value for the work of the researchers. Automated processes are being implemented in order to update measurements coming from the stations.
Data inconsistencies are currently being solved in order to get more reliable results, new stations are being installed and the model is going to be enlarged to receive different dimension scales. The research group, starting from the above-reported results, has included new variables and precise geographical coordinates of the stations, which will allow spatial analysis.
The climate and water resources data require the exploration of the quality of available data through data mining techniques, which allows the researcher to understand not only the quality of the data by itself but also different relationships with other variables that may explain the over-parameterization, the variable dependence and equifinality observed in geoscience conceptual models.
Acknowledgments
The authors would like to thank financial support from "Convocatoria Nacional de Investigación y de Creación Artística de la Universidad Nacional de Colombia 2010 - 2012" to the "Programa de Fortalecimiento de Capacidades Conjuntas para el Procesamiento y Análisis de Información Ambiental (code 12677)". The information and data were supplied by Cenicafé, IDEA-UNAL, Environmental Agency CORPOCALDAS and Alcaldía de Manizales (OMPAD).
References
[1] Puertas O., Carvajal, Y. and Quintero, M., Study of monthly rainfall trends in the upper and Middle Cauca River basin, Colombia. DYNA, vol. 169, pp. 112-120, 2011. [ Links ]
[2] Hernández Q., Espinosa, F., Saldaña R. and Rivera, C. Assessment to wind power for electricity generation in the state of Veracruz (Mexico). DYNA vol. 171, pp. 215-221, 2012. [ Links ]
[3] Carlson R.F., Maccormick, A.J.A. and Watts, D.G., Application of linear random models to four annual streamflow series. Water Resources Research, vol. 6 (4), pp. 1070-1078, 1970. [ Links ]
[4] Wang, Q.J., The genetic algorithm and its application to calibrating conceptual rainfall-runoff models. Water Resources Research, vol. 27 (9), pp. 2467-2471, 1991. [ Links ]
[5] Jang. J. S. R., ANFIS: adaptive-network-based fuzzy inference systems. IEEE Transactions on Systems, Man and Cybernetics, vol. 23 (3), pp. 665-685, 1993. [ Links ]
[6] ASCE Task Committee. Artificial neural networks in hydrology - I: preliminary concepts. Journal of Hydrologic Engineering. ASCE, vol. 5, pp. 115-123, 2000. [ Links ]
[7] Whigam, P.A. and Crapper, P.F., Modelling rainfall-runoff relationships using genetic programming. Mathematical and Computer Modelling, vol. 33, pp. 707-721, 2001. [ Links ]
[8] Dibike, Y.B., Velickov, S., Solomatine, D. and Abbott, M.B., Model induction with support vector machines: introduction and applications. Journal of Computing in Civil Engineering, vol. 15 (3), pp. 208-216, 2001. [ Links ]
[9] Ma, N., Yuan, M., Bao, Y., Jin, Z. and Zhou, H., The Design of Meteorological Data Warehouse and Multidimensional Data Report, Proceedings of Second International Conference on Information Technology and Computer Science, pp. 280-283, 2010. [ Links ]
[10] Domínguez, A. J., Torres, S.S, Alba, D. M., and Silva, A. E., Medición y Análisis de Datos Meteorológicos, utilizando Bodega de Datos, Proceedings of Simposio de Metrología, 2008. [ Links ]
[11] Tan, X., Data Warehousing and its Potential Using in Weather Forecast, Proceedings of 22nd International Conference on Interactive Information Processing Systems for Meteorology, Oceanography, and Hydrology, Atlanta, GA, 2006. [ Links ]
[12] Bartok, J., Habala, O., Bednar, P., Gazak, M. and Hluchý, L., Data Mining and Integration for Predicting Significant Meteorological Phenomena., Procedia Computer Science, pp. 37-46, 2012. [ Links ]
[13] Williams, B.J. and Cole, B., Mining monitored data for decision-making with a Bayesian network model. Ecological Modelling, vol. 249, pp. 26-36, 2013. [ Links ]
[14] Cortez, P. and Morais, A., A data mining approach to predict forest fires using meteorological data, New trends in artificial intelligence: proceedings of the 13th Portuguese Conference on Artificial Intelligence (EPIA 2007). [ Links ]
[15] Lemus, C., Rosete, A., Turtós, L., Zerquera, R. and Morales, A., Estimación de parámetros meteorológicos secundarios aplicando Minería de Datos. Instituto Cujae. Cuba, 2009. [ Links ]
[16] Duque, N.D., Orozco, M. and Hincapié, L., Minería de Datos para el Análisis de Datos Meteorológicos, Tendencias en Ingeniería de Software e Inteligencia Artificial, vol. 3, 2010. [ Links ]
[17] Chen, D.Q, Wang W.Y. and Yang, H.K., Application Research on Data Warehouse of Hydrological Data Comprehensive Analysis. Proceedings of 3rd IEEE International Conference. vol. 9. pp. 140-143, 2010. [ Links ]
[18] Wang W.C., Chau, K.W., Cheng, C.T. and Qiu, L., A comparison of performance of several artificial intelligence methods for forecasting monthly discharge time series. Journal of Hydrology, vol. 374, pp. 294-306, 2009. [ Links ]
[19] Oliver, J. 2007. The Thermohyet Diagram as a Teaching Aid in Climatology. Journal of Geography. Vol. 67 (9), 1968, pp. 554- 563. Available online: 02 Nov 2007. [ Links ]
[20] Mejía F. and Botero, B. A., Monitoreo Hidrometeoro-lógico de los glaciares del Parque Nacional Natural Los Nevados. Glaciares, Nieves y Hielos de América Latina. Cambio Climático y Amenazas. Colección Glaciares, Nevados y Medio Ambiente. Editores: C.D López y Ramírez J. Instituto Colombiano de Geología y Minería, Bogotá, 2009. [ Links ]
[21] Vélez, J. J., Mejía, F., Pachón A. and Vargas, D., An Operative Warning System of Rainfall-Triggered Landslides at Manizales, Colombia. Proceedings of World Water Congress and Exhibition IWA 2010, Montreal, Canada. Sept 19-24, 2010. [ Links ]
[22] Hernández, J., Ramírez, M.J. and Ramírez, C., Introducción a la Minería de Datos. Pearson, Prentice Hall, Madrid, 2004. [ Links ]
[23] Dimri, P. and Gunwant, H., Conceptual Model For Developing Meteorological Data Warehouse In UttaRakhand- A Review., Journal of Information and Operations management, vol. 3 (1), pp. 107–-110, 2012. [ Links ]
[24] Darmawikarta, D., Dimensional Data Warehousing with MySQL: A Tutorial. BrainySoftware, 448 p, 2007. [ Links ]
[25] Chaudhuri, S., Dayal, U. and Narasayya, V., An overview of business intelligence technology. Commun. ACM vol, 54, 8. pp. 88-98, 2011. [ Links ]
Néstor Darío Duque-Méndez, Associate Professor from Universidad Nacional de Colombia, Manizales and head from the Research Group in Adaptive Intelligent Environments GAIA. He develops his master studies in Systems Engineering, and his PhD in Engineering from Universidad Nacional de Colombia. His PhD thesis with Cum Laude honors. Author of a number of articles in scientific journals and book chapters including topics on their research and academic work, speaker at major national and international events; head in the development process of national and international research projects, member of academic committees of a dozen national and international journals, academic review in post-graduate academic programs and special events. Hi as received some meritorious distinction for researching and teaching in the Faculty of Administration from Universidad Nacional de Colombia at Manizales.
Mauricio Orozco-Alzate received his undergraduate degree in Electronic Engineering, his M.Eng. degree in Industrial Automation and his Dr.Eng. degree in Automatics from Universidad Nacional de Colombia - Sede Manizales, in 2003, 2005 and 2008 respectively. Since August 2008, he has been with the Department of Informatics and Computing, Universidad Nacional de Colombia - Sede Manizales. His main research interests encompass pattern recognition, digital signal processing and their applications to analysis and classification of seismic, bioacoustic and hydro-meteorological signals.
Jorge Julián Vélez, received the Bs. Eng in Civil Engineering in 1993, the Ph.D. degree in Water Resources Management in 2003, he worked in hydrology, hydraulics and hydro-climatological projects with emphasis on hydrology and environmental issues. His research interests include: hydrological modelling, distributed models, flood forecasting, water balance, rainfall-runoff process, GIS, flood analysis, fluvial analysis, climate change and ecohydrology. He is currently in charge of the Hydraulic Laboratory at Departamento de Ingeniería Civil of the Facultad de Ingeniería y Arquitectura, Universidad Nacional de Colombia Sede Manizales.
