


Services on Demand
Journal
Article
 English (pdf)
 Article in xml format
 Article references
 Send this article by e-mail
Indicators
-
 Cited by SciELO
 -
 Access statistics
Related links
-
 Cited by Google
 -
 Similars in
SciELO
Similars in
SciELO -
 Similars in Google
Share

 Permalink
DYNA
Print version ISSN 0012-7353
Dyna rev.fac.nac.minas vol.82 no.190 Medellín Mar./Apr. 2015
https://doi.org/10.15446/dyna.v82n190.43286
DOI: http://dx.doi.org/10.15446/dyna.v82n190.43286
Classification of voltage sags according to the severity of the effects on the induction motor
Clasificación de los huecos de tensión de acuerdo a la severidad de los efectos en el motor de inducción
Adolfo Andrés Jaramillo-Matta a, Luis Guasch-Pesquer b & Cesar Leonardo Trujillo-Rodríguez c
a Facultad de Ingeniería, Universidad Distrital Francisco José de Caldas, Bogotá, Colombia. ajaramillom@udistrital.edu.co
b Departamento de Ingeniería Eléctrica, Universidad Rovira i Virgili, Tarragona, España. luis.guasch@urv.cat
c Facultad de Ingeniería, Universidad Distrital Francisco José de Caldas, Bogotá, Colombia. cltrujillo@udistrital.edu.co
Received: May 2th, de 2014. Received in revised form: September 30th, 2014. Accepted: October 21th, 2014
This work is licensed under a Creative Commons Attribution-NonCommercial-NoDerivatives 4.0 International License.
Abstract
In this paper, symmetrical and unsymmetrical voltage sags are classified according to the severity of the effects produced on the behavior of induction motors, using the double-cage rotor model. The analyzed variables are: current and torque peaks, and speed loss in transient and steady states. The severity of these effects is analyzed with 14640 voltage sags, both at the beginning of the voltage sag and when the voltage is recovered, by changing the type, magnitude, duration, and initial-point-of-wave. Four mechanical torque loads were used for the analysis, three with constant behavior and one with quadratic behavior. The results show the durations and initial-point-of-wave with more severe effects for each type of voltage sag. Finally, a classification that depends on the type of voltage sag and the variable of interest is obtained.
Keywords: double-cage model; induction machine; sensitivity curves; symmetrical and unsymmetrical voltage sags.
Resumen
En este artículo se clasifican los huecos de tensión simétricos y asimétricos de acuerdo a la severidad de sus efectos sobre el comportamiento de los motores de inducción, utilizando el modelo de doble jaula. Las variables analizadas son: picos de corriente y par, y pérdida de velocidad en régimen transitorio y en estado estable. La severidad de estos efectos se analiza con 14640 huecos, tanto al inicio del hueco como cuando se recupera la tensión, cambiando su tipo, magnitud, duración y punto de onda inicial. Para el análisis se utilizaron tres cargas de par mecánico con comportamiento constante y una carga con comportamiento cuadrático. Los resultados muestran las duraciones y los puntos de la onda inicial que tienen efectos más severos para cada tipo de hueco. Finalmente se obtiene una clasificación que depende tanto del tipo de hueco como de la variable de interés.
Palabras clave: Curvas de sensibilidad; huecos de tensión simétricos y asimétricos; máquina inducción; modelo de doble jaula.
1. Introduction
A voltage sag is a reduction in the rms voltage of between 0,1 and 0,9 pu of the operating voltage [1, 2]. Typically the duration of a voltage sag is from 0,5 to 1 minute [3]. A three-phase fault produces symmetrical sags. Single-line-to-ground, phase-to-phase or two-phase-to-ground faults cause unsymmetrical sags. Voltage sags can be caused by many events, e.g. short circuit, storms, overloads, insulation failures, poor maintenance, and starting of large loads at neighboring facilities, among others.
The voltage sags cannot always be predicted and are recorded in large numbers each year, adversely affecting the power quality and causing severe damage in power devices, particularly in motors, transformers, process control equipment, and computers [4-7].
Induction motors are most commonly used in the industry and when subjected to voltage sags may be damaged or their service life may decrease. Their reaction to voltage sag may generate speed loss, high current peaks or high torque peaks, which produce unwanted activations in the electrical protection system in production plants, stopping the processes and causing major economic losses. As for power quality, if the motors are high power, the consequences of the current peaks and torque produced by voltage sags may cause other electromagnetic disturbances at the nearest point of common connection (PCC) such as swells, fluctuations or even other voltage sags.
Many industrial applications require the determination of the effect of different types of voltage sags in induction motors as this information allows us to design electrical protection systems for specific cases, auto-tuning protection systems or protective relay coordination (system protection calibration), among others, in order to ensure a running motor in good condition or to maintain a minimum level of power quality.
Therefore, some research studies have focused on determining the consequences of voltage sags in the behavior of the induction motors. This is the case in [8, 9], where the single-cage model is used for the analysis (widely used to represent the behavior of low and medium power motors, e.g. [8, 10, 11]). In [10, 12, 13], the symmetrical voltage sags are analyzed depending on both the initial voltage angle and load influence, [14] shows an experimental study of the effect of voltage sags in the characteristics of a three-phase squirrel-cage induction motor. In [15, 16], the consequences of voltage sags are analyzed, by using the double cage model, showing that the torque and current peaks have a periodical dependence on the sag duration, and a linear dependence on depth.
Some of these studies have examined the effects of the parameters of duration and depth of the voltage sag in the induction motor independently for each type of sag, and a small amount of voltage sags, producing significant results. However, the effects of other parameters of voltage sags have not been studied, nor has their codependence or the effect of a massive amount of sags for each variable. Other studies have omitted the effect of loads and transients generated when the voltage sag starts and when it returns to its initial value. This is because the model of the motor used is a single-cage rotor, which is only suitable for analysis at points close to the rated operating point of the motor.
Using a double-cage model, this paper analyzes and classifies the severity of the effects of symmetric and asymmetric voltage sags in a three-phase induction motor. The following procedure analyzes the current and torque peaks, and the speed loss in the induction motor, in transient and steady states, for 14640 different cases of voltage sags, taking into account the parameters of the sags: type, magnitude, duration and initial point-on-wave, and thus codependence, and the effects produced when the sag starts (ds-zone) and when it ends (as-zone). These data generate matrices that are represented in 3D surfaces, which are studied by means of corresponding sensitivity curves, and lead to the classification of voltage sags according to their severity on torque and current peaks, and speed loss in the three phase induction motor.
2. Induction motor
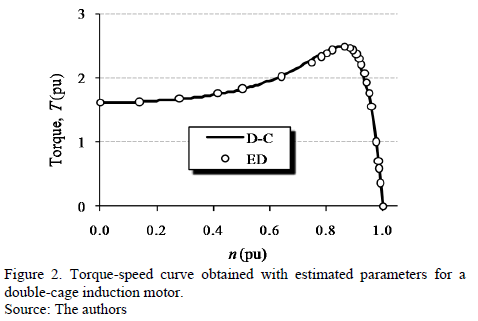
The motor selected for analysis is a 75 kW three-phase induction motor, with squirrel cage rotor, 3300 V supply (isolated delta), 50 Hz, rated current = 13,62 A, rated torque = 401,5 Nm, moment of inertia = 1,2 kg×m2 and rated speed = 1464 rpm. In order to prove that the model represents a suitable behavior of the motor, the behavior obtained with the estimated parameters is validated with experimental data of the torque-speed curve of motor.
2.1. Induction motor model
The model selected for analysis is a double-cage rotor (D-C) since the voltage sags can cause the motor to run at speeds far from the nominal operating point, where a single-cage model does not properly represent the behavior of the motor.
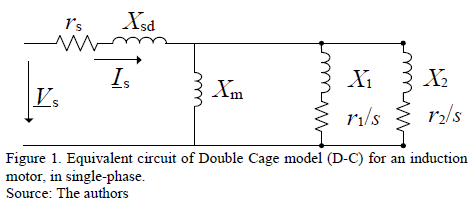
The equivalent circuit of the D-C model is shown in Fig. 1 [17-19], where the parameters r and X are the resistance and reactance, respectively, the subscript s corresponds to the stator, the subscripts 1 and 2 correspond to the two cages of rotor, Xm is the reactance of magnetization between stator and rotor, and s is the motor slip: s = 1- (nm/nS), where nm is the motor speed and nS is the synchronous speed.
2.2. Electrical and mechanical equations of D-C model
The electrical equations of the D-C model are shown in matrix form in (1).
Where the derivative of the flux with respect to time (df/dt) is the induced voltage. Solving (1), the electrical and mechanical equations of the model (2) are found.
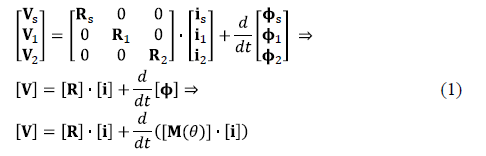
Where w is the motor speed, T(t) is the motor torque, Tres is the load torque, J is the moment of inertia, and M(q) is the matrix of magnetic coupling between stator and rotor, which depends on the angle of rotation q.
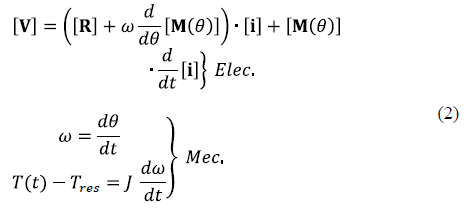
In order to eliminate this dependency, the Ku transform is used, which results in a system of differential equations with constant coefficients, allowing us to mathematically find the solution in the new system transformed. Subsequently, the solution in the original variables is obtained by applying the inverse Ku transform to the found solution. The Ku transform matrix is given by the eq. (3).
is an arbitrary angle used to eliminate the dependence of M(q) with the angular position of the rotor, q, and  .
.
The new transformed variables are called Homopolar (subscript 0), Forward (subscript f) and Backward (subscript b). In induction motors with squirrel-cage rotor, the windings of the rotor are shorted, so the Homopolar current in the rotor is zero. The Forward and Backward voltages (both stator and rotor) are complex conjugated with each other; this implies that only the Forward equations of the rotor and stator are necessary for the resolution of the system.
Applying the Ku transform to the equations system (2), the equations system (4) is obtained.
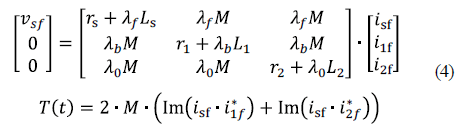
Where lf = (j×ws+p), lb= l0= (j×s×ws+p), ws is the synchronous angular speed, s is the slip, wm is the mechanical angular speed, M is the coupling constant between the stator and each of the two rotor cages, and p is the motor pole pairs. The parameters of the equivalent circuit in Fig. 1 are related with the dynamic equations system in (4) through the equations system (5).
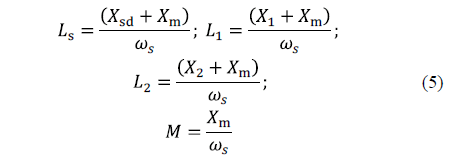
2.3. Electric parameters of the D-C model
After determining the electrical and mechanical equations of the system, the values of the parameters of the model of Fig. 1 must be properly estimated.
The parameters for the D-C model were estimated by using the "Torque Speed tracking" technique described in [20] and are recorded in Table 1, where the values have been normalized with ZN = 242,29 W.
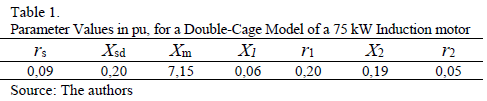
Fig. 2 illustrates 25 experimental data (ED) for the induction motor and the simulation of behavior obtained with the estimated parameters (D-C).This validation shows that the selected parameters generate a very accurate behavior throughout the motor operating range. All values are normalized to the rated value of each variable and the values are presented per unit (pu).
3. Voltage sags
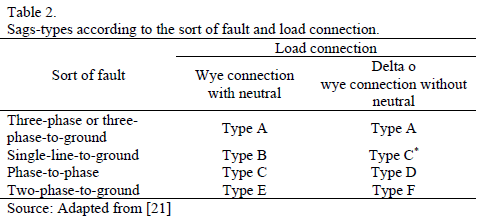
In [21], the types of voltage sags are classified according to the sort of faults that occur. A three-phase fault produces symmetrical sags (type A); single-line-to-ground, phase-to-phase or two-phase-to-ground faults cause unsymmetrical sags (types from B to G). The voltage sag type G is a special case, and is obtained when a sag type E is transferred to other voltage levels through a transformer type II [22]. However, when the connection of the load is not grounded, voltage sags type G have identical equations and behavior as voltage sags type E. Table 2 illustrates the sag-types according to the sort of fault and load connection.
3.1. Sags characterization
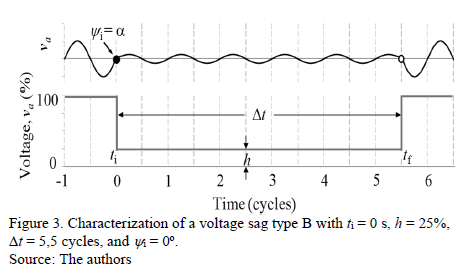
In this paper, the shape of voltage sags has been defined as rectangular, with initial time ti and recovery time tf, no phase jump occurs, and the voltage recovery is produced at the same time in the three phases.
The voltage sags are characterized by four parameters: type (From A to G), magnitude (h = residual phase voltage, measured in percentage), duration (Dt = tf - ti, measured in cycles) and initial point-on-wave (yi = angle of the phase at ti = 0, measured in degrees). As an example, Fig. 3 illustrates a voltage sag type B in phase a, with ti = 0 s, h = 25%, Dt = 5,5 cycles, and y i = 0º.
4. Characteristics of analysis
The transient effects of voltage sags on three-phase induction motors are analyzed in current and torque peaks, and speed loss. In this paper, the effects are analyzed in two zones: during sag (ds-zone) and after sag (as-zone).
Initially Dtmu and yimu are determined, which are the values most unfavorable of duration and initial point-on-wave of the sag, respectively. Later, by using Dtmu and yimu, the effect of the duration and magnitude of the voltage sags is analyzed codependently, by simulating 14640 different cases of voltage sags, thus selecting 6 types of sags (A-F), 61 durations and 40 magnitudes. For each voltage sag, the values of current and torque peaks, and speed loss are obtained. These data generate 3D surfaces for each variable, which are analyzed with their respective sensitivity curves. Finally, the analysis of the sensitivity curves leads to the classification of the voltage sags according to the severity of the effect on the induction motor.
The figures in this paper do not illustrate the effects of sags type G, because the motor used is not grounded. Sags type E have identical effects as sags type G.
The analysis has been undertaken with constant loads of 12,5%, 50% and 100% of rated torque in order to analyze the motor with low, middle and full load, and finally with a quadratic load (k = 0,01708), because it is the most commonly found load in the industry (typical torque-speed characteristic of centrifugal pumps and fans). The figures shown in this paper correspond to quadratic load.
5. Results
5.1. Most unfavorable values of sags duration
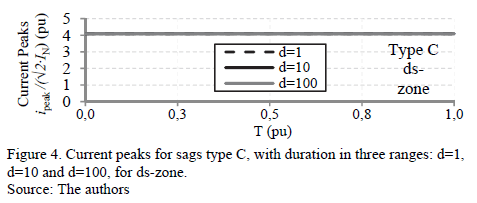
The duration of the voltage sags (Dt) was analyzed in three ranges: d = 1 (from 1 to 2 cycles), d = 10 (from 10 to11 cycles) and d = 100 (from 100 to101 cycles). Each range has been divided into 33 equidistant parts, obtaining 99 durations.
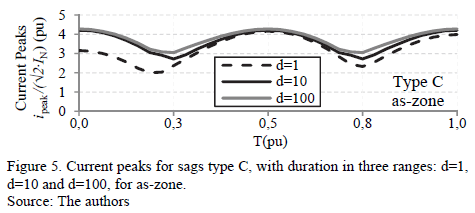
The values of current and torque peaks present the same behavior for all sag types, and show no significant changes across the ds-zone (no influence of Dt). For example, Fig. 4 shows the current peaks for sags type C. Instead, in the as-zone, the most severe values of current and torque peaks for all sag types are in Dt = kT + 0,5T, with k ∈ N (where T is the period, and Dt is measured in cycles). For example, Fig. 5 shows the current peaks for sags type C in the as-zone.
The value of Dt allows us to indirectly analyze the final point-of-wave (modifying the duration of the sag is equivalent to modifying the point-on-wave when the sag ends). These results are summarized in Table 3.
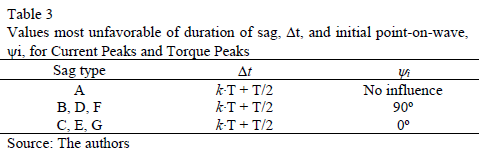
5.2 Most unfavorable values of sags initial point-on-wave
Fig. 6 and Fig. 7 show the current and torque peaks (y-axis), respectively with respect to the initial points-on-wave (x-axis) varying from 0º to 180º. Each sag has been simulated with Dt = 5,5 cycles (according to Table 3), and h = 0,1. These peaks are analyzed in both ds-zone (from ti to tf) and as-zone. In this case, the maximum current peaks are presented in the as-zone for all sags-types, except for type C, where the maximum current peaks were similar in both zones. The maximum torque peaks were presented in the ds-zone for all sags-types.
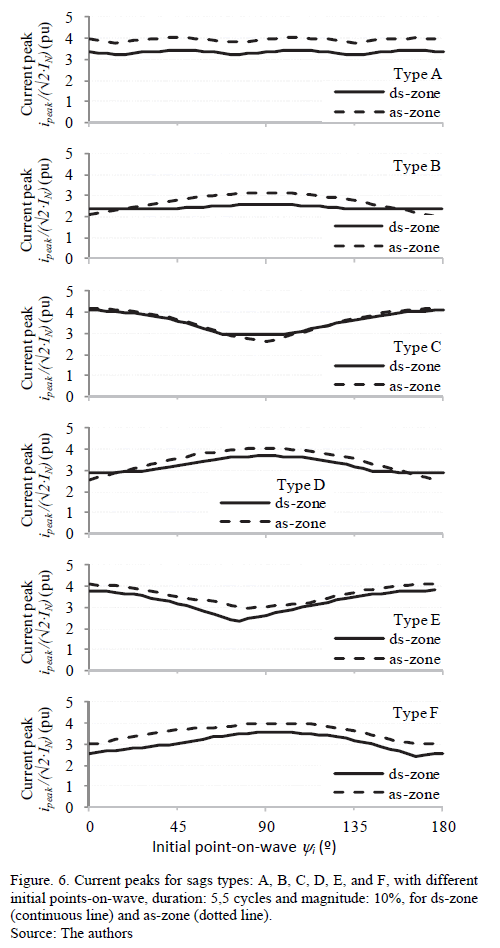
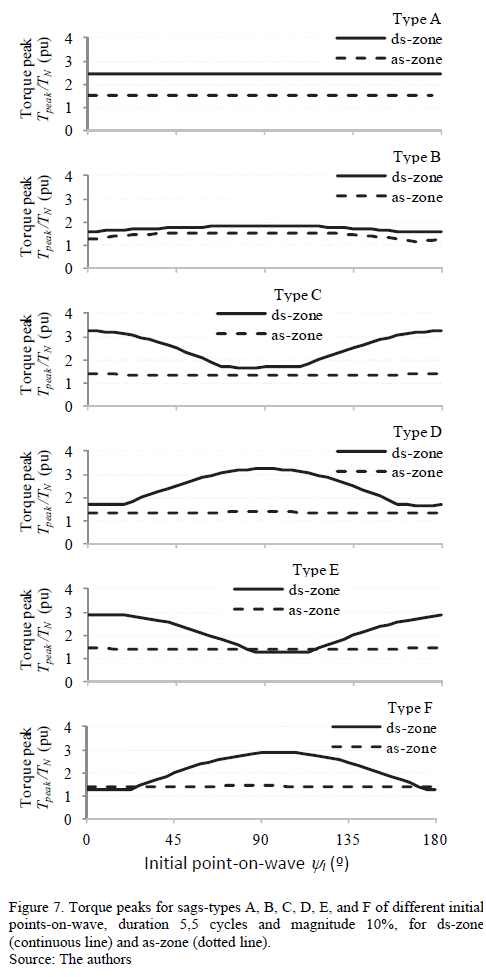
For sags type A, the initial point-on-wave yi has little influence on the current peaks (Fig. 6), and no influence on torque peaks (Fig. 7) or speed loss. For unsymmetrical sags, yi has a big influence on the current and torque peaks, but small influence on speed loss. The voltage sags type B, D, and F produce maximum current and torque peaks when yi = 90º, and the sags type C and E (and G) when yi = 0º. These results are summarized in Table 3.
5.3. Effects of the magnitude and duration of voltage sags by using simulation of extensive ranges
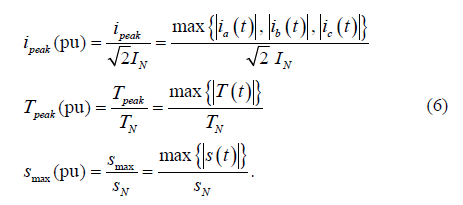
For this analysis, each sag type has been simulated with 61 durations (0,5 ≤ Dt ≤ 150,5 cycles) and 40 magnitudes (0% ≤ h ≤ 97,5), obtaining 2440 variations for each type of sag, and a total of 14640 sags. The values selected for yi and Dt, are the most unfavorable in each case, according to Table 3. For each simulated sag, the algorithm calculates the values per unit of the transient variables: current peaks (ipeak), torque peaks (Tpeak) and speed loss (smax) of the motor by using eq. (6). The speed loss is calculated using the slip s.
The results of the simulations are stored in matrices for: current peaks: IX(h, Dt), torque peaks: TX(h, Dt), and maximum speed loss: SX(h, Dt), for each zone (ds-zone and as-zone), where X is the type of the simulated voltage sag.
5.3.1. Analysis of sensitivity curves
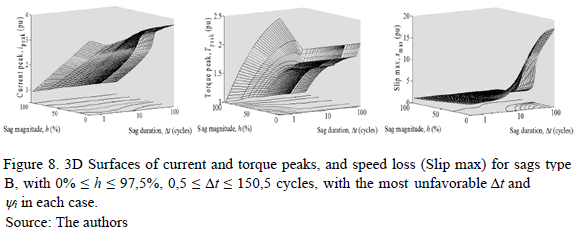
For each sag type, the matrices IX, TX, and SX can be represented as 3D surfaces. For example, Fig. 8 shows the 3D surfaces [IB, TB and SB] for sag type B. However, the analysis of the 3D surfaces is not trivial; therefore Sensitivity Curves are used [8-10] given that these curves contain the same information on a 2D plane.
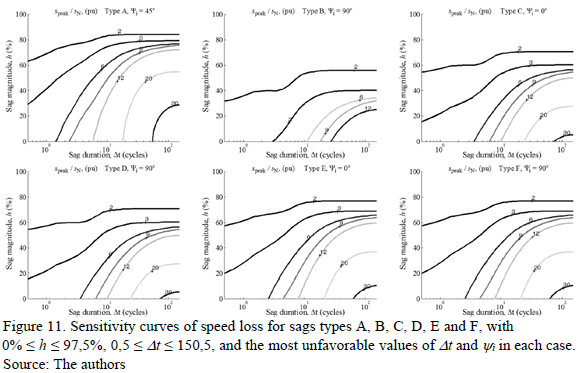
In this case, the Sensitivity Curves are the projection of the values of IX, TX, and SX on the plane h-Dt, and represent the severity of the effects of voltage sags on the induction motor. Fig. 9-11 show the obtained sensitivity curves of the surfaces: IX, TX, and SX, respectively.
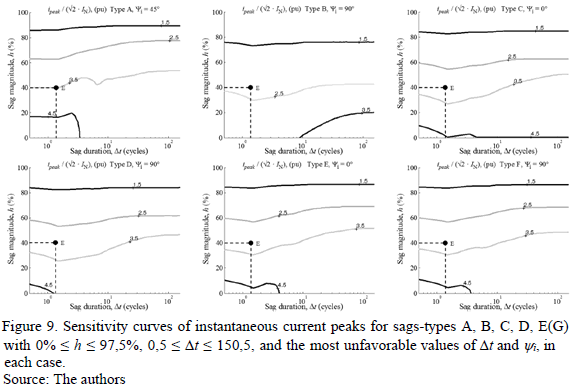
Fig. 9 shows the sensitivity curves of IX, and highlights two results: first, sags type B are the least severe sag since, with the same magnitudes and durations, all other types of sags generate higher current peaks. Second, sags type A have higher current peaks compared to the other types of sags, for example: with h = 40% and Dt = 1,5 cycles (point E in Fig. 9), the value of current peaks of sags type B is 2,3 pu approximately; while for sags types C, D, E, and F, this value is close to 3,0 pu, and for sags type A is 3,5 pu.
The sensitivity curves of TX are shown in Fig. 10. In this case, the types of sags can be grouped into four groups: Sags types C and D show the highest torque peaks, followed by sags type E and F, then sags type A, and finally sags type B. For example, for h = 20% and Dt = 5,5 cycles (point E in Fig. 10), the torque peak value for sags types C and D is 2,8 pu approximately; for sags types E and F, it is 2,4 pu; for sags type A, it is 2,1 pu; and for sags type B, it is 1,9 pu.
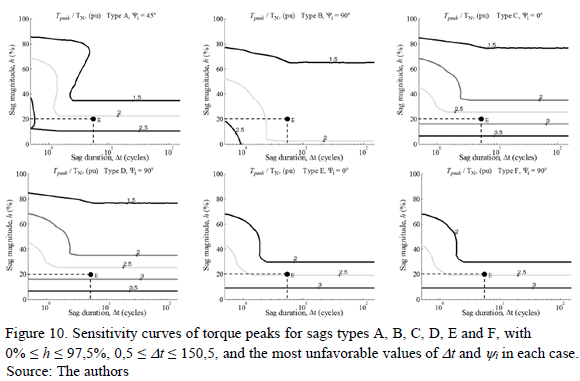
Fig. 11 shows the sensitivity curves of SX. In this case, sags type A have higher speed loss in most cases, followed by sags types E and F, and sags types C and D. Sags type B are the least severe and clearly differentiated from the other types. The results were the same with all the loads analyzed.
6. Classification of the severity of voltage sags on the induction motor
In order to classify the sags with respect to the severity of the effects on the induction motor, the distance (d) between each surface (IX, TX, and SX) and a reference surface was calculated, by using the Euclidean distance method [8].
The reference surface corresponds to the surface of maximum values of peaks for each variable. For example, for current peaks IMAX(h, Dt) = max {IA(h, Dt), IB(h, Dt), IC(h, Dt), ID(h, Dt), IE(h, Dt), IF(h, Dt)}. To calculate the normalized d between each surface IX and IMAX, in percentage, eq. (7) is used.
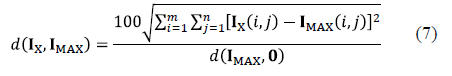
Thus, the surface IX with the smallest distance to IMAX is the surface with the most severe effects.
Table 4 shows the distance d(IX, IMAX), which is d between IX (the surfaces of current peaks for the sags type A to type G) and IMAX (reference matrix), normalized.
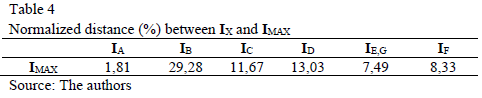
The analysis illustrated in Table 4 leads to three severity groups of current peaks: Group 1 "High-severity", conformed by sags type A, with d(IA, IMAX)=1,81%; Group 2 "Middle-severity", for sags types C, D, E, F and G, with 7,49% ≤ d(IC,D,E,F,G , IMAX) ≤ 13,03%; and Group 3 "Low-severity", for sags type B, with d(IB, IMAX)=29,28%.
Table 5 shows the d(TX, TMAX). Four severity groups of torque peaks are identified: Group 1 "High-severity", for sags types C and D, with d(TC,D, TMAX)=0,44%; Group 2 "High-middle-severity", for sags types E and F, with d(TE,F, TMAX)=12,37%; Group 3 "Low-middle-severity", for sags type A, with d(TA, TMAX)=24,15%; and Group 4 "Low-severity", for sags type B, with d(TB, T MAX)=32,97%.
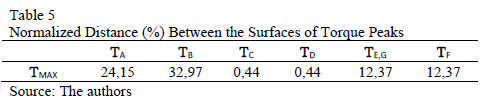
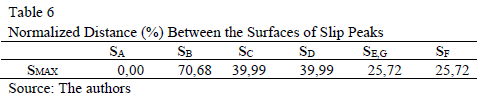
Table 6 shows the d(SX, SMAX). Four severity groups of speed loss are identified: Group 1 "High-severity", for sags type A, with d(SA, SMAX)=0,00%; Group 2 "High-middle-severity", for sags types E, F and G, with d(SE,F,G , SMAX)=25,72%; Group 3 "Low-middle-severity", for sags types C and D, with d(SC,D , SMAX)=39,99%; and Group 4 "Low-severity", for sags type B, with d(SB, SMAX)=70,68%.
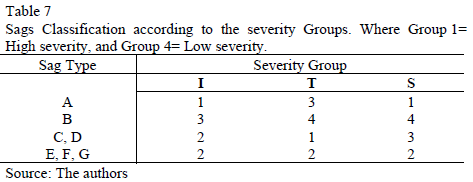
Thus, the severity of the sags can be easily identified through the proposed nomenclature: X[GI, GT, GW]; where X is the type of sag, and [GI, GT, GW] represent the severity group for each variable.
For example, A[131] means that the sags type A have the following effects on the induction motor: the current peaks are very high (Group 1), the torque peaks are low-middle (Group 3) and the speed loss is high (Group 1).
Table 7 shows this classification, highlighting that the severity of the sags' effect on the induction motor depends on the type of sag (X), but it also depends on the variable of interest: current, torque or speed.
7. Conclusions
Using the double cage model, in this study, we analyzed the effects of voltage sags types A, B, C, D, E, F, and G on the variables: current and torque peaks, and speed loss in the induction motor. Each variable was analyzed using 14640 sags, for different magnitudes, durations and initial point-on-wave. The severity of each type of sag was obtained by calculating the distance between the 3D surface of peaks and the 3D surface of maximum peaks, for each analyzed variable.
The results show the importance of analyzing the transients produced by voltage sags, not only when the sag starts but also when the sag ends, and the voltage is recovered. In both circumstances a sudden change in voltage occurs. In fact, the most unfavorable values of duration of sags analyzed, have an effect on torque and current peaks when the voltage sag ends.
The results obtained show that the transient effects due to voltage sags, depend on the type, magnitude, and duration of the sag. Unsymmetrical sags, also depend on the initial point-on-wave.
The classification of sags according to the severity of their effects on the induction motor depends on the type of sag, but also on the variable of interest: current, torque or speed, because each type of sag has a different effect on each variable.
Acknowledgment
The authors acknowledge the support of the "Facultad de Ingeniería" and the "CIDC, Centro de Investigaciones y Desarrollo Científico" of the Universidad Distrital Francisco José de Caldas, Colombia, with project 1105, conv. 08-2013. They also acknowledge to the Rovira I Virgili University, Spain, and the support of the "Ministerio de Economía y Competitividad de España" under Project DPI2013-47437-R.
References
[1] AENOR., Voltage characteristics of electricity supplied by public distribution systems, European Standard UNE-EN 50160. Madrid, 2001. [ Links ]
[2] AENOR., Características de la tensión suministrada por las redes generales de distribución, Vol. III UNE-EN 50160:2008 AENOR. Madrid, 2008. [ Links ]
[3] IEEE., Recommended practice for monitoring electric power quality, IEEE 1159. North America 1995. [ Links ]
[4] Dugan, R.C., McGranaghan, M.F., Santoso, S. and Beaty, H.W., Electrical power systems quality, 2nd ed., New York, McGraw-Hill, 2003, pp. 41-61. [ Links ]
[5] Hedayati, M. and Mariun, N., Assessment of different voltage sags on performance of induction motors operated with shunt FACTS, in Power electronics and drive systems technology (PEDSTC), Tehran, IEEE, 2012, pp. 483-489. http://dx.doi.org/10.1109/PEDSTC.2012.6183378 [ Links ]
[6] Fernandez-Comesana, P., Freijedo, F.D., Doval-Gandoy, J., Lopez, O., Yepes, A.G. and Malvar, J., Mitigation of voltage sags, imbalances and harmonics in sensitive industrial loads by means of a series power line conditioner. Electric Power Systems Research, 84, pp. 20-30, 2012. http://dx.doi.org/10.1016/j.epsr.2011.10.002. [ Links ]
[7] Blanco, J., Leal, R., Jacome, J., Petit, J.F., Ordonez, G. and Barreras, V., The influence of transformers, induction motors and fault resistance regarding propagation voltage sags. Revista Ingenieria E Investigacion, 31 (2SUP), pp. 139-147, 2011. [ Links ]
[8] Guasch, L., Corcoles, F. and Pedra, J., Effects of symmetrical and unsymmetrical voltage sags on induction machines. IEEE Transactions on Power Delivery, 19 (2), pp. 774-782, 2004. http://dx.doi.org/10.1109/TPWRD.2004.825258 [ Links ]
[9] Guasch, L., Corcoles, F. and Pedra, J., Effects of unsymmetrical voltage sag types E, F and G on induction motors, in Ninth International Conference on Harmonics and Quality of Power, Orlando, FL, IEEE, 2000, pp. 796-803. http://dx.doi.org/10.1109/ICHQP.2000.896831 [ Links ]
[10] Corcoles, F. and Pedra, J., Algorithm for the study of voltage sags on induction machines. IEEE Transactions on Energy Conversion, 14 (4), pp. 959-968, 1999. http://dx.doi.org/10.1109/60.815014 [ Links ]
[11] Gomez, J.C., Morcos, M.M., Reineri, C.A. and Campetelli, G.N., Behavior of induction motor due to voltage sags and short interruptions. IEEE Transactions on Power Delivery, 17 (2), pp. 434-440, 2002. http://dx.doi.org/10.1109/61.997914 [ Links ]
[12] Hardi, S., Hafizi, M., Pane, Z. and Chan, R., Induction motors performance under symmetrical voltage sags and interruption - Test result, in Power Engineering and Optimization Conference (PEOCO), Malaysia, IEEE, 2013, pp. 630-635. http://dx.doi.org/10.1109/PEOCO.2013.6564624 [ Links ]
[13] Elena, H., Ionel, L. and Anca, C., Impact of three-phase voltage dips on the induction motors - An experimental study, in 4th International Symposium on Electrical and Electronics Engineering (ISEEE), Galati, IEEE, 2013, pp. 1-6. http://dx.doi.org/10.1109/ISEEE.2013.6674352 [ Links ]
[14] Ota, T., Hirotsuka, I., Tsuboi, K., Kanda, J., Suzuki, Y. and Ueda, F., Experimental study for the effect of the voltage dip on the characteristics of a three-phase squirrel-cage induction motor, in Electrical Machines and Systems (ICEMS), 2013 International Conference on, Busan, IEEE, 2013, pp. 2060-2065. http://dx.doi.org/10.1109/ICEMS.2013.6713168 [ Links ]
[15] Pedra, J., Sainz, L. and Corcoles, F., Effects of symmetrical voltage sags on squirrel-cage induction motors. Electric Power Systems Research, 77 (2) pp. 1672-1680, 2007. http://dx.doi.org/10.1016/j.epsr.2006.11.011 [ Links ]
[16] Pedra, J., Sainz, L. and Corcoles, F., Effects of unsymmetrical voltage sags on squirrel-cage induction motors. IET Generation Transmission & Distribution, 1 (5) pp. 769-775, 2007. http://dx.doi.org/10.1049/iet-gtd:20060555 [ Links ]
[17] Chapman, S.J., Máquinas Eléctricas, 2 ed., Mexico, McGraw-Hill, 1997, pp. 556-576 . [ Links ]
[18] Fraile-Mora, J., Máquinas eléctricas, 5 ed., España, Mc Graw Hill, 2003, pp. 325-327. [ Links ]
[19] Krause, P.C., Wasynczuk, O., Sudhoff, S.D. and Pekarek, S., Analysis of electric machinery and drive systems, Portland, Wiley-IEEE Press, 2013, pp. 215-345. [ Links ]
[20] Jaramillo-Matta, A., Guasch-Pesquer, L., Martinez-Salamero, L. and Barrado-Rodrigo, J.A., Operating points estimation of three-phase induction machines using a torque-speed tracking technique. Electric Power Applications, IET, 5 (3) pp. 307-316, 2010. http://dx.doi.org/10.1049/iet-epa.2010.0091 [ Links ]
[21] Bollen, M.H.J., Understanding power quality problems:Voltage sags and interruptions, New York, IEEE Press, 1999, pp. 190-210. [ Links ]
[22] NFPA., National Electrical Code (NEC). NEC Code Book vol. Article 725-41a. North America: NFPA, 2002. [ Links ]
A.A. Jaramillo-Matta, received a BSc. in Electronics Engineering and a MSc. degree in Engineering and Automation from the Universidad del Valle, Cali, Colombia, the MSc. in Engineering and the PhD. in Electronic Engineering from the Universitat Rovira i Virgili, Tarragona, Spain. Currently, he is a full professor in the Department of Electrical Engineering, Universidad Distrital Francisco José de Caldas, Bogotá, Colombia. His main research interests include: modeling and simulation of induction motors, power quality and control systems.
L. Guasch-Pesquer, received the BSc. in Industrial Engineering and the PhD. degree in Engineering from the Universitat Politècnica de Catalunya (UPC), Barcelona, Spain. Currently, he is a full professor in the Electrical Engineering Department of the URV, where he has been since 1990. His research interests include electric machines and power system quality.
C.L. Trujillo Rodríguez, received the BSc. in Electronics Engineering from the Universidad Distrital Francisco José de Caldas, Bogotá, Colombia, the MSc. in Electrical Engineering from the Universidad Nacional de Colombia, Bogotá, Colombia, and the PhD. in Electronics Engineering from the Universidad Politécnica de Valencia, Valencia, Spain. He is a full professor in the Department of Electrical Engineering, Universidad Distrital Francisco José de Caldas, where he currently teaches courses on analog circuits and power electronics. His main research interests include: modeling and control of power converters applied to the distributed generation and microgrids.
