Services on Demand
Journal
Article
Indicators
-
 Cited by SciELO
 -
 Access statistics
Related links
-
 Cited by Google
 -
 Similars in
SciELO
 -
 Similars in Google
Share
DYNA
Print version ISSN 0012-7353
Dyna rev.fac.nac.minas vol.82 no.192 Medellín July/Aug. 2015
https://doi.org/10.15446/dyna.v82n192.48588
DOI: http://dx.doi.org/10.15446/dyna.v82n192.48588
Measurement-based exponential recovery load model: Development and validation
Modelo de carga de recuperación exponencial basado en mediciones: Desarrollo y validación
Luis Rodríguez-García a, Sandra Pérez-Londoño b & Juan Mora-Flórez c
a Programa de Ingeniería Eléctrica, Universidad Tecnológica de Pereira, Pereira, Colombia. luferodriguez@utp.edu.co
b Programa de Ingeniería Eléctrica, Universidad Tecnológica de Pereira, Pereira, Colombia. saperez@utp.edu.co
c Programa de Ingeniería Eléctrica, Universidad Tecnológica de Pereira, Pereira, Colombia. jjmora@utp.edu.co
Received: April 29th, 2014. Received in revised form: February 20th, 2015. Accepted: July 3nd, 2015.
This work is licensed under a Creative Commons Attribution-NonCommercial-NoDerivatives 4.0 International License.

Abstract
Load modeling is an important task in power system stability analysis and control. Taking this into account, the development of dynamic load models using a measurement-based load modeling strategy and an improved particle swarm optimization algorithm is presented in this paper. To accomplish this objective, a measurement-based parameter estimation method is used for identification of an exponential recovery load model. Measurements are obtained performing dynamic simulation of an IEEE 30-bus test system under several disturbances, and, additionally, a cross validation technique is applied for an analysis of load model generalization capability. An adequate load modeling improves the comprehension of load behavior and the capability of reproducing transient events on power systems.
Keywords: Measurement-based load modeling, particle swarm optimization, parameter estimation, exponential recovery load model.
Resumen
El modelado de carga es una tarea importante en el análisis de estabilidad y el control de un sistema de potencia. Teniendo en cuenta esto, en este artículo se presenta el desarrollo de modelos dinámicos de carga empleando una estrategia basada en mediciones y un algoritmo mejorado de optimización por enjambre de partículas. Para lograr este objetivo, se emplea un método de estimación de parámetros basado en mediciones para la identificación de un modelo de carga de recuperación exponencial. Las mediciones se obtienen mediante simulación dinámica de un sistema de prueba IEEE de 30 barras ante diferentes perturbaciones y se realiza adicionalmente un análisis mediante la técnica de validación cruzada para estudiar la capacidad de generalización del modelo de carga. Un modelado de carga adecuado mejora la comprensión del comportamiento de la carga y la capacidad de reproducir eventos transitorios en los sistemas de potencia.
Palabras clave: modelado de carga basado en mediciones, optimización por enjambre de partículas, estimación de parámetros, modelo de carga de recuperación exponencial.
1. Introduction
Adequate planning and safe operation of power systems are strongly related with the adequate knowledge of all of the elements connected to the network. The model quality of each component in the power system considerably affects the simulation veracity. Specifically, the load model represents a continuous challenge to the power system analysis, due to its stochastic and time-varying characteristics [1].
Load characteristics play an important role in determining the voltage stability of a power system. For this reason, the selection of appropriate load models is one of the most challenging tasks in these studies. Different alternatives, such as static or dynamic loads models can be obtained using a component-based approach, by gathering information of individual load characteristics and then aggregating them in one single load. Another strategy, known as the measurement-based approach, uses measurements acquired from the load substation (such as voltage, active and reactive power measurements), when the power system is under a disturbance [2-3]. These measurements are used to tune the parameters of a model structure, to reduce the mismatch between the real power system and the model response to a minimum [3-4].
Over recent years, research has been focused on measurement-based load modeling, due to the availability of monitoring devices connected in the power systems. To develop a load model based on measurements, two requirements must be defined: a structure to represent load characteristics and a strategy to estimate the model parameters. Several authors have proposed different strategies for load parameter estimation, where search algorithms have been used [5-9]. Examples of these include Search algorithms based on statistical techniques such as Least Square (LS) based parameter estimation [5] and Weighted Least Square (WLS) based parameter estimation [6]. One of the difficulties of these methods consists on the convergence into a local minimum and its high sensitivity to the initial value of the parameters (e.g. proper weights). In other categories the following are included: the search algorithms that use metaheuristic techniques such as Simulated Annealing [7], Genetic Algorithms [8], and Neural Networks [9], among others. Particle swarm optimization (PSO) algorithm is an evolutionary technique for optimization that has been used in several applications related to power systems [10-13]. An application for measurement-based load modeling is shown in [14], where a parameter estimation process is solved using a standard (PSO) algorithm for a composite load with a high penetration of distributed generation.
Related to load characteristics, the use of dynamic load models has become increasingly popular compared to static load models, but sometimes the computational cost required for its development is higher and reduces the model applicability. Although static load models, such as ZIP or exponential, are widely used for power systems stability analysis, those models are unable to reproduce the dynamic response of load in the case of transient events and often show deviation from field measurements [15]. This indicates the inefficiency of static load models, due to characteristics such as under-voltage motor protection, thermostatic control, under-load tap changers or slow voltage recovery, which require of dynamic models to have an adequate representation [16]. One of the dynamic load models that have been used in the literature is the Exponential Recovery Load (ERL). This model is mostly used to approximate loads that recover slowly over a time period, from several seconds to tens of minutes, and it has been adopted in some papers for voltage stability analysis [17-18]. Another structure used to represent load dynamic behavior is the Composite Load (CL) model [19]. However, this structure has a disadvantage compared to ERL model, relating to the number of parameters to be estimated when the measurement-based approach is applied. The ERL model has less parameters to estimate.
Although defining a load model structure and an estimation method is enough to obtain a load model, it is very important to determine its generalization capability. A load model built from specific data measurements may not be adequate, since it may lack the ability to fit new data measurements. Therefore, it is necessary to validate the load model adaptability. However, this analysis is not fully addressed in most of the papers that use the ERL model. According to the above, this paper is focused on developing a methodology for dynamic load modeling, with which results may be applied for voltage stability studies. This methodology is founded in measurement-based load modeling, and determines a load representation using exponential recovery load models, whose parameters are estimated using load measurements and an improved PSO algorithm. Finally, the generalization capability of such load model is analyzed by applying a modification of cross validation technique.
This paper is organized as follows: first, the load model is described in Section 2. A measurement-based approach for load modeling is presented in Section 3. Next, the optimization technique for the parameter estimation process is presented in Section 4. Section 5 contains the proposed methodology for the development of load models based on measurements. Simulation results, validation and discussion are presented in Section 6, and finally, conclusions are given in Section 7.
2. Dynamic load modeling
Several dynamic load model structures have been proposed and most of them were only applicable to a particular system or for a specific study case [2]. Two of the most widely used dynamic load models are the Exponential Recovery Load (ERL) model [4] and the Composite Load (CL) model [19], which are specially designed for specific applications. For example, the ERL model is commonly used to approximate loads that slowly recover over a time period, which varies from several seconds to tens of minutes. Meanwhile, the CL model is employed in cases where Induction Motors (IM) are a dominant component. According to [2], due to the fact that the IM are responsible for consumption of approximately 60% to 70% of the total energy supplied by a power system, the CL model will quite often be applicable, but this is not a mandatory condition. Other characteristics must be evaluated in the load model selection, such as low computational effort, availability of measurements and comparison to determine if the model structure selected is better than others, in the case of a specific set of measurements.
2.1. Composite load model
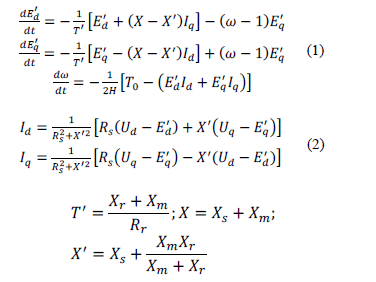
This structure is proposed in [19] and has been the object of many studies, where load is represented as a combination of a static load ZIP for the representation of load static behavior, and a third-order induction motor model for the representation of load dynamic behavior. The dynamic part of the load model is represented using third-order induction motor equations, as is shown in (1) and (2).
Where  is the d-axis internal EMF,
  is the q-axis internal EMF, w is the mechanical speed,
  and
and  are the d-axis and q-axis stator currents, respectively,
  are the stator resistance, stator reactance, magnetizing reactance, rotor resistance and rotor reactance, respectively;
  is the inertia constant and
  is the mechanical load torque.
The static part of the load model is represented using a static ZIP load model, where load is modeled as a combination of constant impedance, constant current and constant power loads, as is presented in (3).

Where PbaseZIP,QbaseZIP are steady state ZIP load active and reactive power,  are the constant power, constant current and constant impedance coefficients for active power, respectively, and
  are the constant power, constant current and constant impedance coefficients for reactive power, respectively. A detailed description of this model is presented in [19].
Using this load model structure, there are eleven parameters to be estimated:  . The first seven parameters correspond to induction motor parameters, and the last four parameters correspond to static load parameters.
2.2. Exponential recovery load model
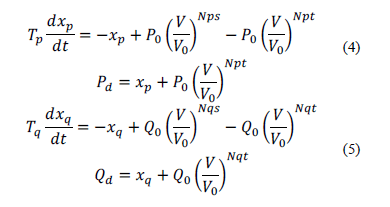
An exponential recovery load model, proposed in [17], is based on active and reactive power exponential response after a step disturbance at the bus voltage. Non-linear first-order equations are deployed for the representation of load response, which are shown in (4) and (5).
Where  are the nominal bus voltage, active power and reactive power at the load bus respectively,
  are state variables related to active and reactive power dynamics,
  are time constants of the exponential recovery response,
  are exponents related to the steady state load response,
  are exponents related to the transient load response.
Based on (4) and (5), there are six parameters in total for the ERL model that must be estimated:  . In the next section, the measurement-based load approach to derive these load parameters is presented.
3. The Measurement-based load modeling approach
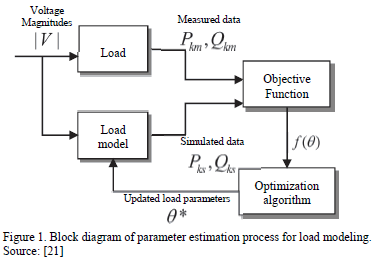
The Measurement-based load modeling approach has been developed in a two-stage procedure. Once measurements are obtained, a model structure is selected to represent the load behavior. Next, a parameter estimation method is applied, to determine a set of parameters that minimizes the difference between measured data from the power system, and simulated data from the load model [16][20], as shown in Fig. 1.
After an event occurs in the power system, a dataset of voltage  , active power
  and reactive power
  is acquired from load response. Voltage measurements can be used to calculate the load model response for active and reactive power, denoted as
  and
and  , respectively. Both measured and calculated values are used to evaluate the objective function of the optimization problem. Using this value, the optimization algorithm updates the load parameters
  , to minimize the objective function [21]. In this paper, the PSO algorithm was used for this purpose.
4. Particle Swarm Optimization (PSO)
The PSO algorithm is a meta-heuristic optimization technique based on the behavior of birds and fish. Individuals of the population (particles) move around in a multidimensional search space, combining local search methods and global search methods as the particles position is adjusted according to its experience and the experience of its neighboring particles, tending to the best position encountered by itself or its neighbors [22-23].
The initial population for the optimization algorithm is generated randomly or heuristically. Each particle is represented by a position vector, a speed vector and fitness value. Initial speeds are generated randomly, and each speed vector is updated at every iteration, using the information about the relative position of the particles with respect to the best position found by itself and the best position found by the swarm, as represented in (6).

Where  is the speed of particle
  at current iteration,
  is the speed of particle
  at previous iteration,
  is the best position found by the particle
  until the current iteration,
  is the best position found by the swarm until the current iteration and
  is the position of particle
  at current iteration. Then, particle speed is calculated as a function of the speed of the previous iteration, the relative position of the particle with respect to the best position found by itself, and the relative position of the particle with respect to the best position found by the swarm, where each of these components is weighted with the inertia weighting factor
  , the cognitive coefficient
  and the social coefficient
  . Variables
  and
and  are uniformly distributed random numbers.
5. Proposed methodology
The methodology used in this paper is described below.
5.1. Selected load model
As was previously mentioned, to obtain a load model using measurements require, as initial step, the definition of the model structure. When the CL model is used to represent the load dynamic characteristics under system disturbances, it is necessary to estimate eleven parameters of the model, according to the model described in Section 2.1. Instead, when the ERL is used, only six parameters must be estimated. This represents a considerable difference in computational time. For this reason, an ERL model is used in this paper for the representation of the dynamic load response.
Later, a parameter estimation method is applied as a second stage. For this case, an improved PSO algorithm was used.
5.2. Improved PSO algorithm
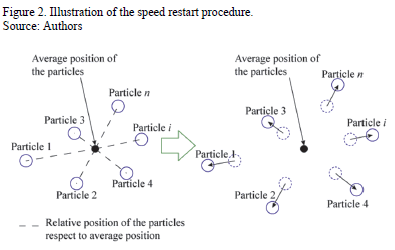
It is observed that during PSO evolution, the particle speeds start with a high value to improve the exploration of the search space. Later, as the evolution process continues, the speeds of the particles decrease as these move towards the optimal solution. However, the magnitudes of the speed vectors may decrease in such a way that particles remain static in the search space [24]. This implies that a lot of computational time is required but the solutions may not improve after some iterations. For this reason, a speed restart mechanism is applied to generate a new set of speed vectors when the particle speeds reach low values.
If the maximum of all the speed vectors components is lower than a tolerance, the particles are moved around their current average position, using the vectors of the relative position of each particle with respect to the average position as the new set of speeds. By means of this mechanism, particles are moved based on the calculated speed vectors, so better solutions may be found because of the exploration of new areas in the search space. Fig. 2 illustrates the speed restart procedure.
The PSO algorithm implemented in this paper, featuring the speed restart mechanism explained above, is presented below:
Initial adjusts: define the number of particles N, inertia weighting factor  , cognitive coefficient
  and social coefficient
  .
.
Step 1: Generate a set of initial of N particles and speeds.
Step 2: Evaluate the fitness function of each particle at their current position and initialize the information of the best particle position and the best swarm position.
Step 3: Move the particles using the speed vectors generated in Step 1.
Step 4: For the new position, evaluate fitness function. If a particle finds a better solution than the value stored in its own memory, the best value and position of the particle are updated. If the swarm finds a better fitness function than the best value stored in the swarm memory, the best value and position of the swarm are updated.
Step 5: Check the speed restart criterion. If true, go to step 6; otherwise, go to step 7.
Step 6: Determine the average position of the particles, calculate the vectors of relative position of the particles with respect to the average position and move the particles using the calculated vectors. Go to step 8.
Step 7: Calculate a new set of speeds using (6) and move the particles.
Step 8: Check the stopping criterion. If the stopping criterion is satisfied, stop. Otherwise, go to Step 4.
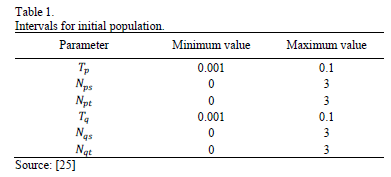
Considering the PSO algorithm, the initial population is generated using uniformly distributed random numbers in specified intervals, as is recommended in [25] and also adjusted experimentally. The parameters are shown in Table 1.
5.3. The objective function and stopping criterion
The objective for the optimization process is aimed to minimize the sum of the square difference of the measured data and the simulated data. The objective function is shown in (7).

Where N is the numbers of samples. A penalty factor is added to the fitness function if any component of the particle vector is lower than zero. The stopping criterion for the optimization process is based on monitoring the evolution of the best solution of the swarm; if this solution does not improve after a specified number of iterations, the algorithm stops. Moreover, the algorithm is stopped if a maximum number of iterations are reached.
5.4. Initialization of the PSO algorithm
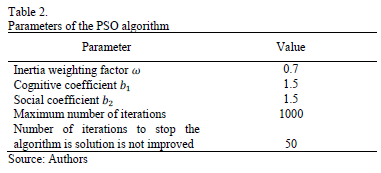
The parameters of the PSO algorithm were determined by exhaustive testing, where the parameters that presented the best performance are summarized in Table 2. Inertia weighting factor  was changed from 0.5 to 1.0, cognitive coefficient
  and social coefficient
  were changed from 1.0 to 2.0 [12].
For the purpose of this paper, parameters of different load models are identified using the PSO algorithm and measurements of voltage, active and reactive power after a disturbance. Once the models are estimated, a validation test is carried out, in order to analyze the model response using datasets that were not included in the estimation process.
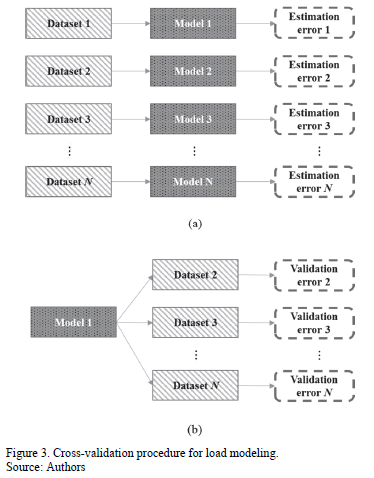
5.5. The cross validation technique for load model validation
Once the parameters of the exponential recovery load model are estimated with the above-proposed methodology, it is necessary to validate its capability to fit new measurements, obtained under other perturbations. At this point, the cross validation technique is adopted.
The cross-validation method is the most commonly used technique to determine errors in classification problems [26-27]. A modification of cross-validation procedure is used in this paper to analyze the load model response, using disturbances that were not considered during its development. The algorithm is described below:
Step 1: Simulate
disturbances and for each case, store voltage, active power and reactive power measurements at study bus. Let
.
Step 2: Use the-th disturbance data as the training dataset, and develop a load model.
Step 3: Validate the load model response using theremaining datasets and obtain a fitting error.
Step 4: If each set of measurements has been used for training, stop. Otherwise,and go to Step 2.
Figs. 3(a) and 3(b) summarizes Step 2 and Step 3 of the algorithm, respectively.
6. Results and discussion
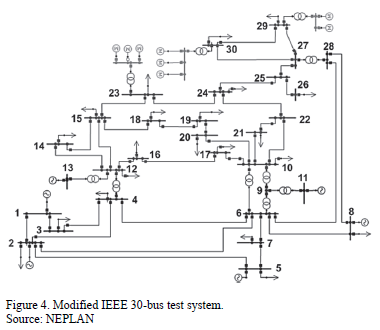
Tests were carried out in the modified IEEE 30-bus test system shown in Fig 4. In order to simulate load dynamic behavior, induction motors are included at buses 23, 29 and 30. Simulations are performed using NEPLAN®. The purpose is to represent each of those composite loads using exponential recovery load model, which are estimated using the methodology above exposed.
The results are organized as follows: Initially, parameters of ERL models are estimated at study buses (23, 29 and 30) for a specific perturbation. Then, the validation of each one of the load models is presented for other perturbation. Finally, to check out the generalization capability of the ERL model obtained for bus 30, the cross-validation method is applied.
6.1. Estimation of load models at study buses
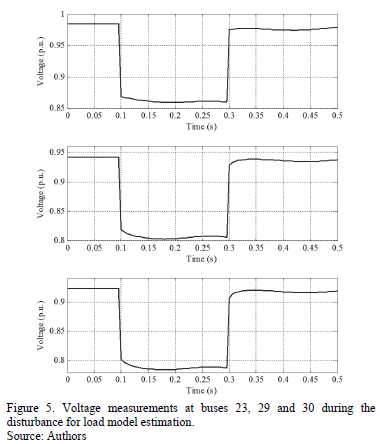
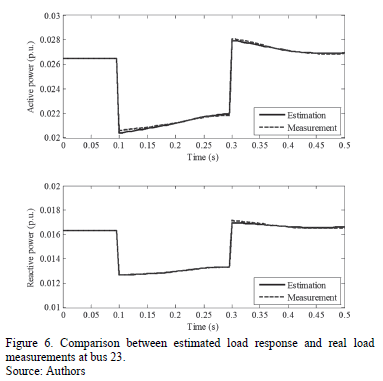
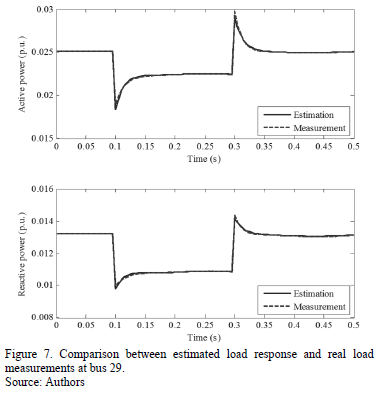
Initially, parameters of exponential recovery load models are estimated for each load using measurements after a three-phase fault at line 24-25, having duration of 200ms and a fault resistance of 0.5W;. Voltage measurements at buses 23, 29 and 30 during the disturbance are depicted in Fig. 5.
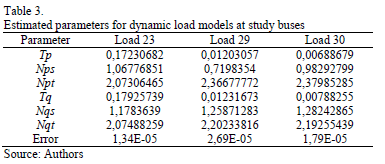
The estimated parameters using the proposed methodology are summarized in Table 3. Estimation error is also included as an indicator of estimation accuracy.
Using the load model parameters of Table 3, a comparison between real load measurements and estimated load responses are shown in Figs. 6, 7 and 8 for load 23, 29 and 30, respectively.
From the results obtained, it can be seen that the developed load models fit accurately with the measurements obtained from the power system, for both steady state and transient conditions. For the cases considered, the optimization procedure was successful, even when study buses are located near or far from the disturbance location.
6.2. Validation test of the developed load models
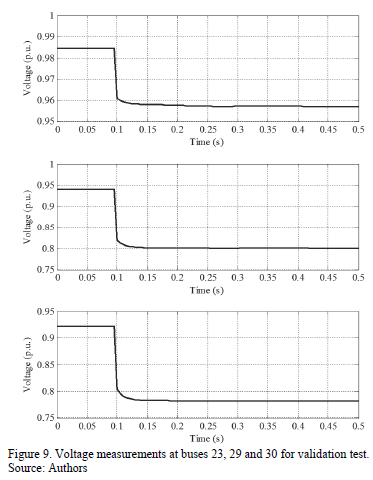
A validation test is carried out, in order to check load model responses under a different disturbance. An outage is simulated for a transformer connected between buses 27 and 28. Voltage measurements at study buses during this disturbance are depicted in Fig. 9.
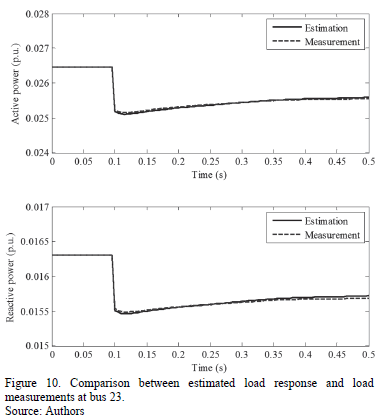
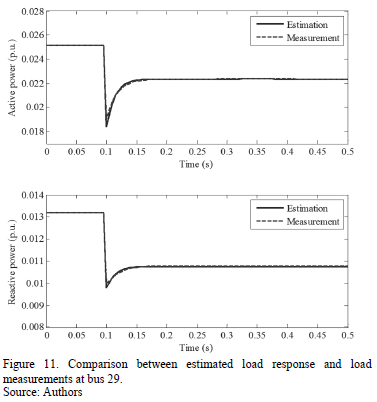
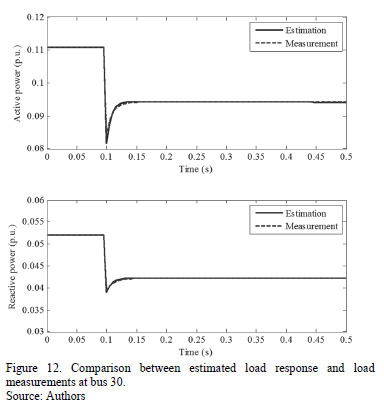
Using the parameters calculated in Section 6.1, load model responses and their comparisons to the real load behavior are given in Figs. 10, 11 and 12.
From Figs. 10 to 12, load model responds adequately for active and reactive power of each load. Table 4 summarizes the validation fitting errors for each load. Considering the nature and characteristics of the load response, it was expected that the exponential recovery load model accurately adjusted to load response under a different disturbance scenario.
6.3. Generalization capability analysis
One important aspect related to load modeling is the model generalization capability. After a load model is obtained, it is expected to obtain low estimation errors, which indicates that load model accurately fits to the measurements used for the model development. Nevertheless, it is necessary to analyze the capabilities of the load model to represent load behavior under disturbances that were not considered during the estimation process. A specific validation test was carried out in Section 6.2; however, an analysis of generalization is required for different sets of disturbance measurement data.
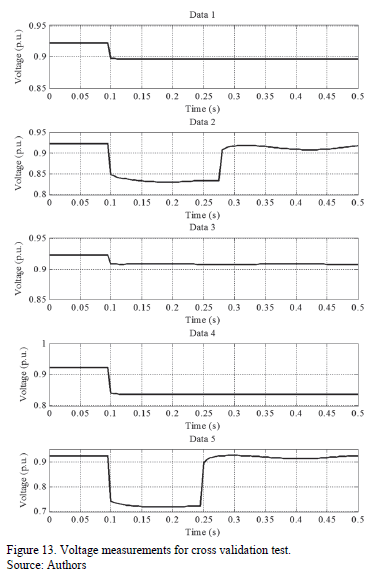
A cross validation test is carried out to verify generalization capabilities of developed load models. Data of five disturbances are simulated and voltage, active and reactive power measurements at bus 30 are stored:
Data 1 Outage of line 29-30
Data 2 Three-phase fault at bus 14, duration of 180ms, fault resistance of 2W;.
Data 3 Excitation loss of a synchronous motor at bus 5.
Data 4 Transformer tap change of transformer connecting buses 27 and 28.
Data 5 Three-phase fault at bus 25, duration of 150ms, fault resistance of 5W;.
Voltage measurements at bus 30 for the simulated disturbances are depicted in Fig. 13.
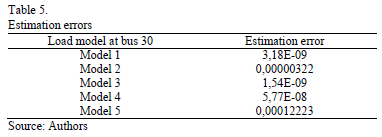
The cross validation process is described below. Initially, a load model is obtained using the measurement set Data 1. Posteriorly, using the parameters obtained by means of Data 1, load model response is validated using the other measurement sets and an error index is calculated for each validation test. The procedure is repeated obtaining a new load model using the measurement set Data 2, validating the model using the other measurement set, and successively for each data set. Table 5 contains the error estimation for each of the obtained models using the test datasets.
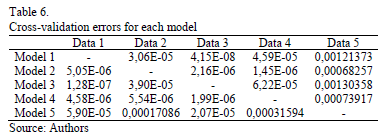
The highest error estimation is obtained for Model 5, which is the scenario where with the greatest voltage variation. In this case, it has to be considered that exponential recovery load model has limitations representing load response after considerable voltage variations. Table 6 summarizes the cross validation errors. Each model is validated with the remaining data and a validation error is calculated (rows represent the studied load model, and columns represent the dataset used for validation).
From Table 6, it is clear that load model response in a validation test is accurate in most cases. A higher error occurs in the case of using Data 5 to validate; this represents that a load model obtained using small disturbance data may not be accurate enough to represent load behavior for disturbance where voltage variations are greater. On the other hand, as Model 5 presents the highest error during estimation stage, it can be seen that high validation errors are obtained in comparison with the other models. It implies that load models developed using considerable voltage variation disturbance data are not necessary more accurate and its generalization capability may be limited for these disturbances.
7. Concluding remarks
The Measurement-based load modeling approach has certain advantages over component-based approaches, because the first strategy allows a more accurately representation of the electrical load characteristics. For this reason, a methodology for dynamic load modeling based on measurements, which uses ERL model and an improved PSO algorithm, is developed and additionally, its generalization capabilities are also studied.
Furthermore, ERL models can be developed using a set of measurements obtained at one specific operating condition and can be applied to other power system operating conditions with satisfactory results. This is an important advantage, because measurements for load modeling can be obtained from normal operational disturbances, and then additional and harmful disturbances are not strictly required for the development of accurate load models. However, it is important to highlight that this is a partial conclusion, because the generalization capability of the load model for system configuration or load composition changes are not analyzed in this paper and are proposed as future research.
Another major contribution of this paper is to demonstrate that an exponential recovery load model can be satisfactorily used when a specific bus has a considerable number of induction motors. This represents an advantage compared to the CL model, which has a high number of parameters to be estimated.
In general terms, exponential recovery load models are accurate in representing load response at different operating scenarios; however, this response is limited when voltage variations are considerable (greater than 20% with respect to nominal voltage).
References
[1] Morison, K., Hamadani, H. and Wang, L., Practical issues in load modeling for voltage stability studies, Proceedings of IEEE Power Engineering Society General Meeting, pp. 1392-1397, 2003. DOI: 10.1109/pes.2003.1267355 [ Links ]
[2] Kundur, P., Power system stability and control, 1ra Ed., USA, Mc. Graw Hill, 1994. [ Links ]
[3] IEEE, Task force on load representation for dynamic performances, Load representation for dynamic performance analysis (of power systems), IEEE Transactions on Power Systems, 8 (2), pp. 472-482, 1993. DOI: 10.1109/59.260837 [ Links ]
[4] Choi, B.-K., Chiang, H.-D., Li, Y., Li, H., Chen, Y.-T., Huang, D.-H., and Lauby, M., Measurement-based dynamic load models: Derivation, comparison and validation. IEEE Transactions on Power Systems, 21 (3), pp. 1276-1283, 2006. DOI: 10.1109/TPWRS.2006.876700 [ Links ]
[5] Liu, Q.S., Chen, Y.P., and Duan, D.F., The load modeling and parameter identification for voltage stability analysis, International Conference of Power System Technology, pp. 2030-2033, 2002. [ Links ]
[6] Hiskens, I.A., Nonlinear dynamic model evaluation from disturbance measurements, IEEE Transactions on Power Systems, 16 (4), pp. 702-710, 2001. DOI: 10.1109/59.962416 [ Links ]
[7] Knyazkin, V., Cañizares, C. and Söder, L., On the parameter estimation and modeling of aggregate power system loads. IEEE Transactions on Power Systems, 19 (2), pp. 1023-1031, 2004. DOI: 10.1109/TPWRS.2003.821634 [ Links ]
[8] Ju, P., Handschin, E. and Karlsson, D., Nonlinear dynamic load modeling: model and parameter estimation. IEEE Transactions on Power Systems, 11 (4), pp. 1689-1697, 1996. DOI: 10.1109/59.544629 [ Links ]
[9] Hiyama, T., Tokieda, M. and Hubbi, W., Artificial neural network based dynamic load modeling. IEEE Transactions on Power Systems, 12 (4), pp. 1576-1583, 1997. DOI: 10.1109/59.627861 [ Links ]
[10] Del Valle, Y., Venayagamoorthy, G.K., Mohagheghi, S., Hernandez, J.C. and Harley, R.G., Particle swarm optimization: Basic concepts, variants and applications in power systems. IEEE Transactions on Evolutionary Computation, 12 (2), pp. 171-195, 2008. DOI: 10.1109/TEVC.2007.896686 [ Links ]
[11] Yoshida, H., Kawata, K., Fukuyama, Y., Takayama, S. and Nakanishi, Y., A particle swarm optimization for reactive power and voltage control considering voltage security assessment. IEEE Transactions on Power Systems, 15 (4), pp. 1232-1239, 2000. DOI: 10.1109/59.898095 [ Links ]
[12] Huang C.-M., Huang C.-J. and Wang M.-L. A particle swarm optimization to identifying the ARMAX model for short-term load forecasting. IEEE Transactions on Power Systems, 20(2), pp. 1126-1133, 2005. DOI: 10.1109/TPWRS.2005.846106 [ Links ]
[13] Panigrahi, B.K., Ravikumar-Pandi, V. and Das, S., Adaptive particle swarm optimization approach for static and dynamic economic load dispatch. Energy Conversion and Management, 49 (6), pp. 1407-1415, 2008. DOI: 10.1016/j.enconman.2007.12.023 [ Links ]
[14] Rodriguez-Garcia, L., Perez-Londono, S. and Mora-Florez, J., A methodology for composite load modeling in power systems considering distributed generation, Proceedings of IEEE/PES Transmission and Distribution: Latin America Conference and Exposition (T&D-LA), pp. 1-6, 2012. DOI: 10.1109/tdc-la.2012.6319122 [ Links ]
[15] Kosterev, D.N., Taylor, C.W. and Mittelstadt, W., A. model validation for the August 10, 1996 WSCC system outage, IEEE Transactions on Power Systems, 14 (3), pp. 967-979, 1999. DOI: 10.1109/59.780909 [ Links ]
[16] Concordia, C. and Ihara, S., Load representation in power system stability studies. IEEE Transactions on Power Apparatus and Systems-PAS, 101 (4), pp. 969-977, 1982. DOI: 10.1109/TPAS.1982.317163 [ Links ]
[17] Karlsson, D. and Hill, D.J., Modelling and identification of nonlinear dynamic loads in power systems. IEEE Transactions on Power Systems, 9 (1), pp. 157-166, 1994. DOI: 10.1109/59.317546 [ Links ]
[18] Zeng, Y.G., Berizzi, G. and Marannino, P., Voltage stability analysis considering dynamic load model, in Proceeding of the 4th International Conference on Advances in Power System Control, Operation and Management, APSCOM-97, Hong Kong, 1, pp. 396-401, 1997. DOI: 10.1049/cp:19971866 [ Links ]
[19] He, R.M., Ma, J., and Hill, D., Composite load modeling via measurement approach. IEEE Transactions on Power Systems, 21 (2), pp. 663-672, 2006. DOI: 10.1109/TPWRS.2006.873130 [ Links ]
[20] IEEE, Task force on load representation for dynamic performance. Standard load models for power flow and dynamic performance simulation. IEEE Transactions on Power Systems, 10 (3), pp. 1302-1313, 1995. DOI: 10.1109/59.466523 [ Links ]
[21] Bai, H., Zhang, P. and Ajjarapu, V., A novel parameter identification approach via hybrid learning for aggregate load modeling. IEEE Transactions on Power Systems, 24 (3), pp. 1145-1154, 2009. DOI: 10.1109/TPWRS.2009.2022984 [ Links ]
[22] Olariu, S. and Zomaya, A., Handbook of bioinspired algorithms and applications, Chapman and Hall/CRC, 2005. DOI: 10.1201/9781420035063 [ Links ]
[23] Gómez-González, M., Sistema de generación eléctrica con pila de combustible de óxido sólido alimentado con residuos forestales y su optimización mediante algoritmos basados en nubes de partículas, Ph.D. Tesis, Universidad Nacional de Educación a Distancia, España, 2008. [ Links ]
[24] Abdelhalim, M.B. and Habib, S.E., -D. Particle swarm optimization [online]. 2009 [consulta, 11 de abril de 2014]. Available at: http://www.intechopen.com/books/particle_swarm_optimization/particle_swarm_optimization_for_hw_sw_partitioning [ Links ]
[25] Navarro, I.R., Dynamic power system load -estimation of parameters from operational data, PhD. Thesis, Lund University, Sweden, 2005. [ Links ]
[26] Yang, K., Wang, H., Dai, G., Hu, S., Zhang, Y. and Xu, J., Determining the repeat number of cross-validation, Proceedings of International Conference on Biomedical Engineering and Informatics (BMEI), pp.1706-1710, 2011. DOI: 10.1109/bmei.2011.6098566 [ Links ]
[27] Webb, A.R., Statistical pattern recognition, 2nd Ed., England: John Wiley & Sons, 2002. DOI: 10.1002/0470854774 [ Links ]
L. Rodríguez-García, received his BSc. in Electrical Engineering from the Universidad Tecnológica de Pereira (UTP), Pereira, Colombia, in 2011 and his MSc. in Electrical Engineering at the Universidad Tecnológica de Pereira (UTP), Pereira, Colombia, in 2014. His areas of interest include power system analysis, load modeling, voltage stability analysis and application of optimization techniques for electrical engineering studies. Mr. Rodríguez-García is a member of ICE3 (Col) Research Group on Power Quality and System Stability.
S. Pérez-Londoño, received her BSc. in Electrical Engineering from the Universidad Tecnológica de Pereira (UTP), Pereira, Colombia, in 2000, her MSc. in Electrical Engineering from UTP in 2005, and her PhD. degree in Engineering from the Universidad Nacional de Colombia in 2014. Currently, she is an associate professor at the Electrical Engineering School, Universidad Tecnológica de Pereira, Pereira, Colombia. Her areas of interest include electric machines, power system stability, fault analysis and soft computing techniques. Mrs. Pérez-Londoño is a member of ICE3 (Col) Research Group on Power Quality and System Stability.
J. Mora-Flórez, received his BSc. in Electrical Engineering from the Universidad Industrial de Santander (UIS), Colombia, in 1996, his MSc. in Electrical Power from UIS in 2001, his MSc. in Information Technologies from the University of Girona (UdG), Spain, in 2003, and his PhD. in information technologies and electrical engineering from UdG in 2006. Currently, he is an associated professor at the Electrical Engineering School at the Universidad Tecnológica de Pereira, Colombia. His areas of interest include power quality, transient analysis, protective relaying and soft computing techniques.


