Services on Demand
Journal
Article
Indicators
-
 Cited by SciELO
 -
 Access statistics
Related links
-
 Cited by Google
 -
 Similars in
SciELO
 -
 Similars in Google
Share
DYNA
Print version ISSN 0012-7353
Dyna rev.fac.nac.minas vol.82 no.192 Medellín July/Aug. 2015
https://doi.org/10.15446/dyna.v82n192.48591
DOI: http://dx.doi.org/10.15446/dyna.v82n192.48591
The impact of supply voltage distortion on the harmonic current emission of non-linear loads
Efecto de la distorsión de tensión sobre la emisión de armónicos de corriente de cargas no lineales
Ana Maria Blanco a, Sergey Yanchenko b, Jan Meyer a & Peter Schegner a
a Institute of Electrical Power Systems and High Voltage Engineering, Technische Universität Dresden, Dresden, Germany. ana.blanco@tu-dresden.de
b Moscow Power State Institute, Moscow, Russia. yanchenko_sa@mail.ru
Received: April 29th, 2014. Received in revised form: February 13th, 2015. Accepted: July 17th, 2015.
This work is licensed under a Creative Commons Attribution-NonCommercial-NoDerivatives 4.0 International License.

Abstract
Electronic devices have a non-linear characteristic and emit harmonics into the low voltage grid. Different harmonic studies analyze their impact on the grids based on different types of harmonic models. The most used model is the constant current source.
Measurements have shown that the harmonic currents emitted by electronic devices depend on the circuit topology and the existing supply voltage distortion. This paper quantifies the impact of supply voltage distortion on the harmonic current emission of individual devices and the summation of multiple devices.
After a classification of the commonly used circuit topologies, a time-domain model is developed for each of them. Then the individual and combined impact of voltage harmonics on the harmonic current emission of the modeled devices is analyzed based on simulations. Finally the impact of voltage distortion on the summation of multiple devices is analyzed and the accuracy of constant current source models is evaluated.
Keywords: power quality; nonlinear loads; harmonics; cancellation effect; diversity factors.
Resumen
Los dispositivos electrónicos son cargas no lineales que inyectan armónicos a las redes de baja tensión. Existen varios estudios que analizan el impacto de estos dispositivos sobre la red basados en diferentes tipos de modelos, siendo el más común la fuente de corriente.
Mediciones han demostrado que la emisión de armónicos de dispositivos electrónicos depende de la topología del circuito y la distorsión de la señal de tensión. Este artículo cuantifica el impacto de la distorsión de la señal de tensión sobre la emisión de armónicos de diferentes dispositivos y grupos de ellos.
Primero se desarrollan modelos eléctricos de las topologías más comunes. Luego se analiza el efecto individual y combinado de las armónicos de tensión sobre la emisión de armónicos de los dispositivos seleccionados. Finalmente se analiza el impacto de la distorsión de tensión sobre un grupo de dispositivos y se evalúa la precisión de la fuente de corriente.
Palabras clave: calidad de la potencia; cargas no lineales; armónicos; effecto de cancelación; factor de diversidad.
1. Introduction
The amount of electronic devices used by residential, commercial and industrial customers is continuously increasing. These devices are nonlinear loads that inject harmonic currents into low voltage grids, which could lead to increased voltage distortion levels, additional loading of neutral conductor, overheating or damage of capacitors for reactive power compensation and equipment malfunction (e.g. [1]).
Most of the studies that analyze the impact of these technologies on power quality are based on simulations that use an ideal current source to represent these loads (e.g. [2,3]). The parameters of the current source (magnitude and angle of the current harmonics) are usually obtained from measurements of the respective devices based on the specifications of international standards, like IEC 61000-3-2 [4]. These standards define a nearly undistorted voltage for the measurement of current harmonics.
However, in the low voltage grids the voltage distortion is much greater, usually with THD (Total harmonic distortion) values between 3% and 5%, which change continuously during the day. This voltage distortion affects the current harmonics emitted by the electronic loads. Depending on the voltage waveform characteristics (magnitude and phase angle of the harmonics), harmonic emission of electronic loads can increase or decrease [5-9]. Therefore the current source may not be an adequate model for these kinds of loads.
The main aim of this paper is to analyze the effect of supply voltage distortion on the harmonic emission of the main household electronic devices and determine the usefulness of a current source to model non-linear loads. In the first part, time-domain models of generic electronic devices are developed. The generic models correspond to single-phase switch mode power supply (SMPS) without power factor correction (PFC), with passive PFC and with active PFC, which are the main electronic topologies available in the market [10].
In the second part, models are used to make several simulations in order to analyze the variation of the current harmonics emitted by single electronic devices when the magnitudes and angles of the voltage harmonics change. Finally, the results of simulations of a mixture of loads with distorted and undistorted voltage supply are analyzed to determine the impact on the cancellation effect.
2. Overview of Electronic loads
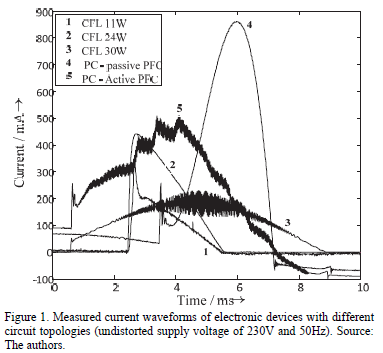
The electronic loads available on the market have different circuit topologies which lead to different current waveforms. Fig. 1 shows some current waveforms of different electronic devices that are measured under sinusoidal supply voltage.
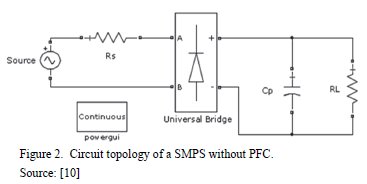
Electronic devices usually have a SMPS. Simple SMPS without PFC have a two stage topology, consisting of rectifying and inverting stages. Rectifying stage includes capacitor-fed diode bridge rectifier and provides smoothed DC voltage to inverter stage, which converts this DC voltage to a stabilized voltage/current signal of certain shape and level required by the load. Examples of this kind of load are the Compact Fluorescent Lamps (CFLs) with rated power below 25W (see Fig. 1).
Depending on the existence of standardized limits (e.g. IEC 61000-3-2 [4]), some devices also implement a PFC. PFC methods can be classified as passive and active according to the utilized components. Passive PFC methods imply adding components like capacitors or inductors either to the input or the output of the rectifying stage or imply using a valley-fill circuit in order to improve the shape of the current pulse.
Being a cost-effective and reliable way to lower current distortion, passive PFC methods nevertheless increase the size and weight parameters of SMPS by using bulky capacitors and inductors as low frequency filters. These drawbacks are not present in active PFC topologies, which utilize various DC-DC converters (boost, flyback, SEPIC) that shape the input current waveform by HF-switching and control circuit.
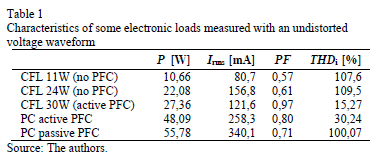
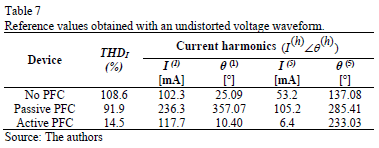
Fig. 1 compares the current waveforms of some electronic loads without PFC (CFLs < 25W), with active PFC (CFL of 30W and one desktop computer) and passive PFC when they are supplied with an undistorted voltage waveform. Table 1 contains some characteristics of the devices obtained when an undistorted voltage waveform was used for the measurements. Active PFC topologies have the lowest distortion and the best power factor; however the almost sinusoidal waveform is superimposed with a high frequency component. This high frequency emission can also cause considerable network disturbances, but is not in the focus of this paper.
3. Modeling of Electronic Loads
In order to analyze the effect of voltage distortion on the harmonic emission of electronic devices, the three main topologies were simulated in the Time-Domain. The Time-Domain modeling was selected because it allows a most detailed modeling of the device's behavior in terms of harmonic emission. The models were designed to accurately represent the low-order harmonic emission. As mentioned above, the high frequency components were not taken into consideration by this analysis. Each topology was simulated in Matlab® with the Simulink® package. To verify the models, several measurements with random voltage waveforms were made.
3.1. SMPS without PFC
The simulated circuit is shown in Fig. 2. The rectifying stage has a resistor (RS) to limit the current peak, a full diode bridge and a smoothing capacitor (CP). The inverting stage has only a resistance (RL) which represents the resonant inverter and the load (the tube in case of CFLs). This simplification does not affect the harmonic analysis because the resonant inverter normally runs at 10 - 40 kHz and this appears as a constant load from the source [11,12].
The values of resistance RL and the capacitance Cp depend on the active power of the lamp, while Rs is fixed to about 10W;. The value of RL decreases and the value of Cp increases with the power of the lamp. Several ways exist to determine the value of RL. More information can be found e.g. in [8, 10]. The value of Cp is found using an iterative process until the error between the measured values and the simulations reaches a minimum. The values of RL and Cp for two CFLs of 11W and 24W are presented in Table 2.
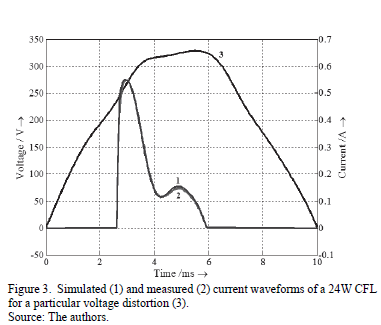
The model was verified using measurements of both lamps under different voltage distortions. Fig. 3 shows the voltage and current waveforms of the 24W CFL obtained in one measurement (curve no. 2) and the corresponding simulation (curve no.1). As can be seen, the simulation properly represents the current waveform of the lamp.
3.2. Passive PFC
There are different ways to improve the power factor using passive elements, so there is no unique configuration that can represent these kinds of devices. Reference [13] presents a survey of most popular passive PFC methods, showing their great topological diversity. For this study only one configuration was implemented corresponding to a PC source.
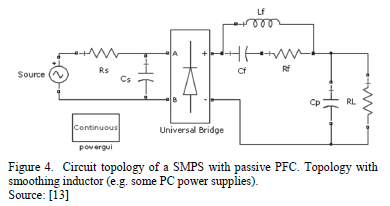
PCs with passive PFC tend to have one common circuit consisting of a capacitor-filtered diode bridge rectifier and a smoothing inductor acting as a passive harmonic filter. The inductor widens the current pulse, thus improving its distortion. Depending on usage behavior, the power consumption of a PC can vary in large ranges. To include this in the analysis, 2 load levels (50W and 100W) were considered. The first corresponds to normal mode of editing documents or browsing the internet, the second is dedicated to more power consuming applications, like games or video rendering [14]. The topology of PC power supply under study is shown in Fig. 4. The values of the model parameters for two load states are depicted in Table 3.
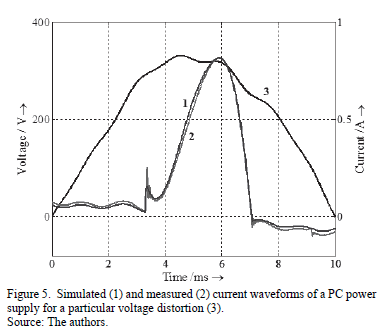
Input current waveform of considered PC power supply presents a step at the beginning of the conduction interval due to parallel resonant circuit (Cf and Lf), which is used to widen current pulse at higher loads. Moreover, the current waveform of Fig. 5 is non-zero when diodes are reverse biased because of the presence of EMI filtering small capacitor CS.
Superimposing simulated and experimental waveforms (Fig. 5) proves a good quality of developed model for PC power supply with passive PFC.
3.3. Active PFC
The general idea of active PFC methods implies shaping the input current to resemble the waveform of the sinusoidal line voltage by means of HF switching of the boost DC-DC converter. Nevertheless, there is a certain level of current distortion inherent for all active PFC circuits [15] that involve zero-crossing distortion and non-sinusoidal shaping of the current waveform. It can be claimed that the control system of active PFC circuits defines on the whole its current harmonic spectrum.
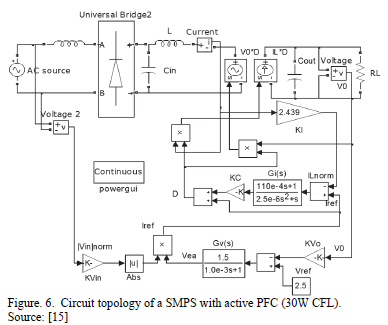
In terms of the present paper, only an active PFC circuit of a 30W CFL was considered. Active PFC topology utilized in 30W CFL consists of diode bridge rectifier, boost converter and control circuit, made up of voltage and current control loops (Fig. 6).
To simplify and speed up simulation the operation of boost DC-DC converter was modeled via averaging approach. HF switching was neglected and transistor and diode were replaced with so called "DC transformer", involving voltage and current sources, subsequently, V0D and ILD, controlled by duty cycle D. Voltage control stabilizes the output voltage by means of transfer function GV(s):

where Ar is the low frequency gain of the voltage controller and wc = 2pfc the corner frequency in rad/sec.
Current shaping is guaranteed by current control loop that compares the reference signal from voltage loop Iref with inductor current with the following transfer function GI(s):

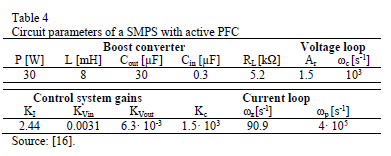
where Kc is the integrator gain and wp and wz are the HF pole and zero of the transfer function. Parameter calculation procedures for boost converter, voltage and current control loops (Table 4) are provided by [16].
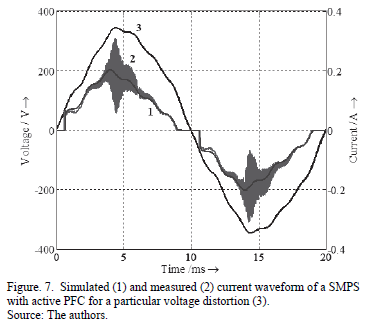
The comparison of simulated and measured current waveforms for active PFC 30W CFL presented in Fig. 7 shows that modeled curve closely follows the average measured waveform. As already mentioned, the models are focused on low order harmonic emission and therefore high frequency emission is not reflected by the model.
4. Analysis of individual electronic devices
The effect of supply voltage distortion on the current harmonic emission of the major circuit topologies was analyzed with the models developed in Simulink. The model of the 24W CFL, the PC source (50W load) and the 30W CFL were selected for the simulations because they represent the major circuit topologies, namely the SMPS without PFC, the SMPS with passive PFC and the SMPS with active PFC respectively.
4.1. General framework
In order to obtain a comprehensive overview of the possible impact of voltage distortion on current harmonic emission, systematic simulations based on a set of synthetic waveforms with well-controlled variations of magnitude and phase angle of 3rd, 5th and 7th voltage harmonics were carried out. The mentioned harmonics were added to the test voltage individually as well as in several combinations.
Usually the voltage distortion in public low voltage grids contains a characteristic set of harmonics. The harmonics often have prevailing values for magnitude and a phase angle that does not follow a completely random behavior as is assumed in the generic study based on synthetic waveforms. Therefore in a second step harmonic measurements in public low voltage grids were analyzed to quantify the typical harmonic content of supply voltage. These waveforms are used for a second set of simulations, which are finally compared with the simulations based on synthetic waveforms.
The following subsections describe the different waveform sets in detail and how they were obtained.
4.1.2. Synthetic waveforms
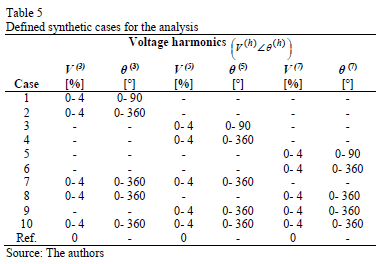
The synthetic waveforms were created in order to identify the effect of the 3rd, 5th and 7th voltage harmonics only, which are the dominating harmonic orders in most of the low voltage grids. Ten cases with different variations of these voltage harmonics were defined (see Table 5). The first 6 cases consider the effect of each voltage harmonic individually, when the magnitude varies between 0 and 4% and the angle varies between 0 and 90° or between 0 and 360°. Other cases consider the effect of two or three voltage harmonics at the same time.
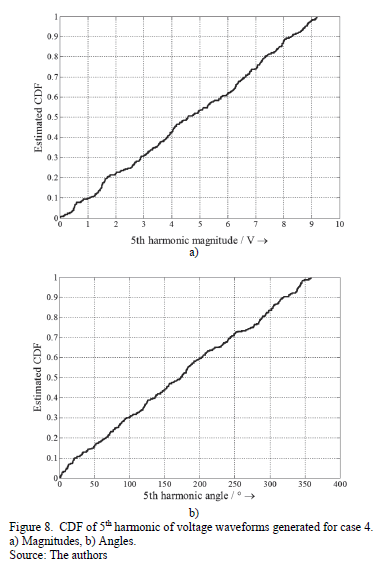
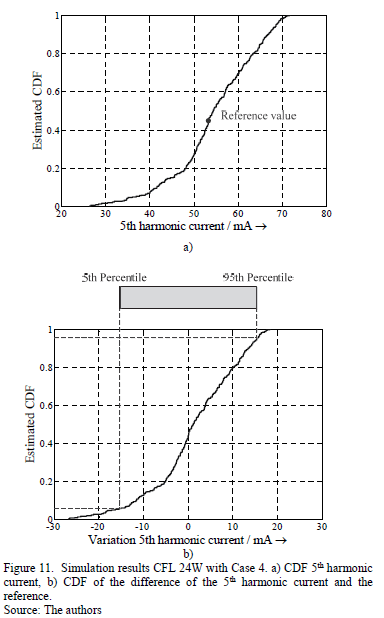
Sets of 300 different voltage waveforms were generated for each case. Magnitudes and angles of the voltage harmonics were drawn from uniform distributions and within the ranges given in Table 5. As an example, Fig. 8 shows the cumulative distribution of the 5th harmonic magnitudes and angles of the voltage waveforms sampled for case 4. To ensure comparability each device was simulated for each case with the same set of voltage waveforms and the THDi and the first odd current harmonics were recorded. Fig. 11a exemplarily shows the cumulative distribution of 5th harmonic current magnitude that is obtained for case 4. It can be seen that the uniformly distributed 5th harmonic voltage magnitudes and angles result in a distribution of a 5th harmonic current magnitude, which is unsymmetrical and non-uniform.
4.1.3. Real waveforms
The real voltage distortions were obtained from 3-phase measurements at the PCC of two houses with residential customers located in different low voltage grids in Germany. Magnitude and phase angle of the first 50 voltage harmonics were recorded for each site and one week every 30 minutes. The selected measurement period considers the daily and weekly variations of the voltage distortion in residential areas.
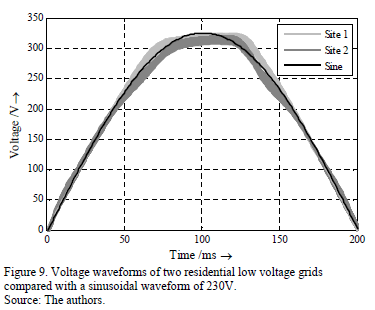
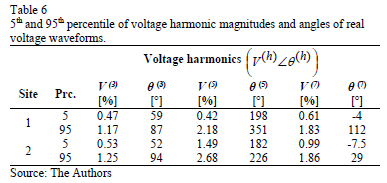
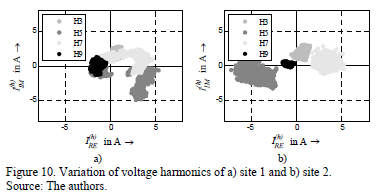
Fig. 9 shows the variation range of voltage waveforms for both sites, which are calculated based on the measured complex harmonic voltage spectra. Compared with the sinusoidal waveform (black) the measured waveforms show a flat top characteristic, which is common for most residential low voltage grids. However, the sites have slightly different behavior. Fig. 10 shows the variation of the first odd harmonics in the complex plane and Table 6 quantifies the 5th and 95th percentile of the respective magnitudes and phase angles. Both sites show, in most cases, distinctive regions (clouds) for the harmonics, which confirm their non-random behavior. Site 1 shows a higher variation of harmonic angles, especially for the 3rd and 5th harmonics. These differences produce the variations in the voltage waveforms.
The complete set of measurements was used in the simulations. It should be noted that the focus of this study is residential grids and the results only apply for public networks with residential customers. Industrial grids, especially, can have significant different waveform characteristic (e.g. pointed top) and subsequently different variation ranges of the harmonic emission at different supply voltage distortion.
4.1.4. Analysis methodology
For further analysis, the difference between simulation results and a reference case is calculated in order to represent the impact of voltage distortion clearly and to compare the results of the different topologies. The simulation with an undistorted voltage waveform was selected as a reference (see Table 7). Fig. 11b exemplarily shows the distribution function of this difference for one of the synthetic cases. Finally, the 5th to 95th percentile range is obtained for each data set to quantify the variation of the THDI and the current harmonics by respective boxes (c.f. Fig. 11b). It has to be noted, that absolute magnitude of harmonic and magnitude related to fundamental lead to different interpretations. Both have advantages and disadvantages. Refer to next subsection for more details.
4.1.5. Analysis of THD
The total harmonic distortion THDI applied in this paper is defined as:

where I(h) are the magnitudes of the current harmonics, IHAR is the total rms harmonic current and IFUN is the rms fundamental current.
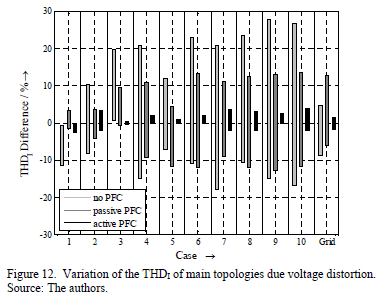
Fig. 12 shows the variation of the THDI for the different cases. The THDI varies for all the topologies and this variation increases for cases with higher voltage distortion. Moreover the THDI variation is larger if the voltage harmonic angles vary in a larger range (0° .. 360° compared to 0° .. 90°). This clearly shows the significant effect of voltage harmonic angles on the harmonic emission of electronic devices.
The real waveforms (referred to as grid in the figures), have lower harmonic magnitudes compared to the synthetic waveforms, but produce significant changes in the current distortion of the three topologies as well.
Between the topologies, the SMPS without PFC is more sensitive to the voltage distortion than the other topologies. The THDI of this topology varies in the range of 12% to 40%, the current distortion of the SMPS with passive PFC in the range of 5% to 25% and the active PFC device in the range 1% to 5%. The topology without PFC behaves most sensitive while the active PFC seems to be the most robust topology in terms of supply voltage distortion. It should be noted that, for the real waveforms, the variation is slightly lower than for most of the cases with synthetic waveforms. However the equipment with passive PFC behaves more sensitively than the equipment without PFC, which is in contrast to the simulations with synthetic waveforms.
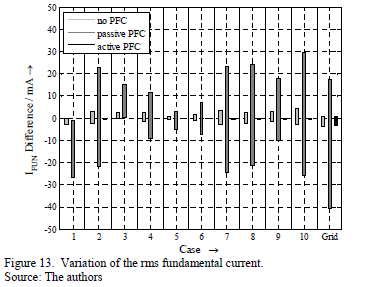
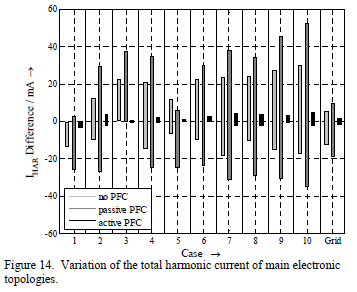
The THDI is related to the fundamental and provides a good index for comparing the sensitivity between the different equipment. However, the THDI may not only result from variation of harmonic currents but also from variation of fundamental current. To avoid any misinterpretation, Fig. 13 and 14 present the variation of total harmonic current IHAR and fundamental current IFUN separately. They show that the variation of fundamental current of passive PFC device is much more affected by the different voltage distortions than by the other equipment, while the fundamental current for active PFC device is almost independent from it. The total harmonic current of the passive PFC device has the highest variation, which is at least partly caused by its higher absolute current emission compared to the other devices.
In the case of the limited phase angle variation of 3rd harmonic voltage (case 1), fundamental current and total harmonic current decrease, while the case with the same variation of phase angles for the 5th harmonic (case 3) shows an increase of fundamental and harmonic current.
However, for the simulations with real waveforms, the total harmonic current tends to be smaller when compared to sinusoidal case, especially for the equipment without PFC and with passive PFC. This effect e.g. proves the common hypothesis of a "saturation" effect for harmonic emission of electronic equipment.
4.2. Analysis of harmonic emission
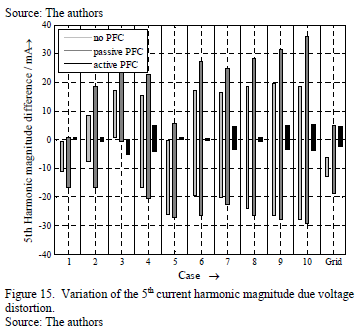
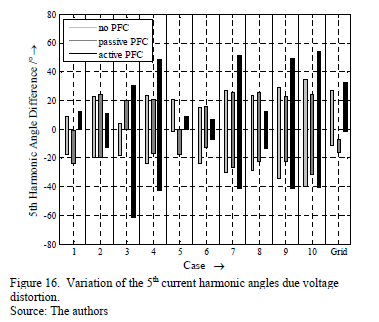
The impact of voltage distortion on the individual harmonics is exemplarily discussed for the 5th harmonic current. Due to its dominance, the behavior of 5th harmonic currents in Fig. 15 is almost similar to the total harmonic current in Fig. 14. The variation of current harmonic magnitudes is higher for no PFC and passive PFC technologies. Moreover, the variation of 5th harmonic phase angle (Fig. 16) is higher for the active PFC device, while devices without PFC and with passive PFC behave almost similarly and show lower variation range. Generally there is no linear link between variation of voltage harmonic phase angle and current harmonic phase angle.
Another interesting aspect is the cross-interference between the harmonics. A zero cross-interference means that the nth harmonic voltage will only result in a variation of the nth harmonic current. All other harmonic currents are not affected [6]. Consequently Fig. 15 and 16 would show harmonic current variation only for the cases 3, 4, 7, 9 and 10. However, this is only satisfied for the harmonic current magnitudes of the active PFC device, which mainly results from the internal PFC control of the device. The simple SMPS without PFC as well as the passive PFC device show a significant cross interference, which complicates the development of accurate but simple models further.
4.3. Summary
With these results it is clear that the traditional modeling of electronic devices with a constant current source may result in significant inaccuracies in the frequency domain. This applies not only for the synthetic waveforms, but also for the real waveforms based on measurements in public LV grids. The current harmonic emission depends on the voltage harmonics magnitudes and angles. Most dependencies are not linear. All topologies show more or less distinctive cross-interference, which means that independent consideration of harmonic orders and superposition are only limited applicable.
If a quick harmonic study is needed, current source models, maybe taking typical voltage distortion into account, could be sufficient. However, depending on the particular situation in terms of voltage distortion in the grid, significant errors of several ten percent have to be expected. For accurate and reliable analysis it is better to use the time domain models.
5. Analysis of a group of electronic devices
The presence of different devices with different topologies at one connection point can cause a diversity of current harmonic phase angles and subsequently may lead to a lower magnitude of vector sum than the arithmetical sum of the harmonic currents [12, 17]. This is known as cancellation effect and has a high influence on the total harmonic distortion emitted by larger groups of electronic devices into the grid.
The cancellation effect is quantified by the phase angle diversity factor  individual for each harmonic [18]:

where  represents the harmonic current vector of the device i, n is the number of devices and h is the order of the harmonic. The diversity factor varies between 0 (perfect cancellation) and 1 (no cancellation). This study tries to give an idea on accuracy and representativeness of diversity factors calculated based on individual harmonic currents measured at a particular voltage distortion [e.g. 18].
To analyze the effect of voltage harmonics on the cancellation between individual harmonic currents within a group of electronic devices, the time domain models of two devices without PFC (CFLs with 11W and 24W), one passive PFC device (PC power supply at 50W) and one active PFC device (CFL with 30W) are connected together to the same point. The diversity factor KP is calculated for each case (synthetic and real waveforms) using the same sets defined in the previous section. Analog to section 4, the 5th to 95th percentile range is calculated and presented as a box. The reference case at undistorted supply voltage is indicated by a black line.
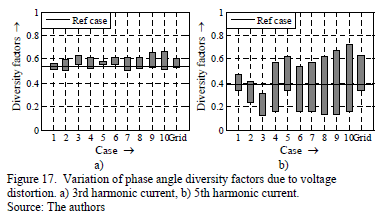
Fig. 17 shows the variation of the diversity factor of the 3rd and 5th current harmonics for each of the cases. The diversity factor of the 3rd harmonic shows only a very low variation. Moreover, the level of cancellation of this harmonic is almost independent from the voltage distortion. The diversity factor remains close to the one obtained at undistorted voltage (reference case).
For the 5th harmonic (Fig. 17b) the variation is significant. Without voltage distortion the cancellation for the 5th harmonic current is very effective (0.38). In case of a 5th voltage harmonic varying in the range 0° ... 90° the efficiency increases, but for most of the other cases, a partial decrease of the diversity can be observed.
The cancellation effect in case of the real waveforms is usually lower than for the sinusoidal case. Therefore, an accurate and reliable study of cancellation effect for 5th harmonic current in low voltage grids should take the voltage distortion into account. This can be achieved e.g. by introducing probabilistic aspects to the device modeling.
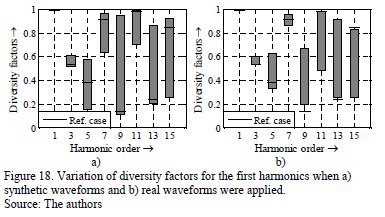
The combination of the results of all synthetic waveforms (about 3000) into one box for each odd harmonic up to 15th is presented in Fig. 18a, while Fig. 18b shows the results obtained with the real waveforms (about 2000). The reference case (undistorted supply voltage) is indicated by the back line. As expected, the fundamental adds up arithmetically independent of voltage harmonics. For harmonic orders 7 and above the variation of diversity factor becomes very high. Even situations without any cancellation may occur.
The real voltage distortions also produce high variations of the diversity factors, and for some harmonics (3rd, 9th and 13th) the cancellation decreases significantly. On the other hand the voltage distortion of real waveforms has a positive impact on the diversity for 11th and 15th harmonic.
Therefore, studies of the cancellation effect based on equipment measurements under undistorted supply voltage should always be interpreted with care.
6. Conclusions
Most electronic household devices can be divided into three main circuit topologies: SMPS without PFC, SMPS with passive PFC and SMPS with active PFC. All the topologies produce current harmonics which depend strongly on the distortion of the supply voltage.
The application of the current source model is limited and can result in errors of several ten percent if supply voltage is distorted. The current emission depends not only on the magnitude of the voltage harmonics, but also on the angles, and in most of the cases these relations are not linear. Most of the analyzed cases show a significant cross-interference. This means that changes in one voltage harmonic lead to changes in multiple current harmonics. Introducing probabilistic aspects into the current source model can improve the quality and reliability of results. For accurate harmonic studies the use of time domain models is highly recommended.
The cancelation effect of current harmonics of order 5 and higher is highly affected by the presence of voltage harmonics. Therefore the cancellation of current harmonics not only depends on the number and type of connected devices, but also on the voltage distortion in the low-voltage grid. Subsequently harmonic studies about the impact of electronic mass market equipment on the grid should also take the voltage distortion into account.
References
[1] Bollen, M.H.J. and Gu, I.Y.H., Signal processing of power quality disturbances. USA: John Wiley & Sons, 2006. DOI: 10.1002/0471931314 [ Links ]
[2] Koch, A., Myrzik, J., Wiesner, T., and Jendernalik, L., Harmonics and resonances in the low voltage grid caused by compact fluorescent lamps. Proceedings of the 14th International Conference on Harmonics and Quality of Power - ICHQP, pp. 1-6, 2010. DOI: 10.1109/ichqp.2010.5625425 [ Links ]
[3] Korovesis, P., Vokas, G., Gonos, I. and Topalis, F., Influence of large-scale lamps on the line voltage distortion of a weak network supplied by photovoltaic station. IEEE Transactions on Power Delivery, 19 (4), pp. 1787-1793, 2004. DOI: 10.1109/TPWRD.2004.835432 [ Links ]
[4] Electromagnetic Compatibility (EMC) - Part 3-2: Limits - Limits for harmonic current emissions (equipment input current ≤16A per phase), IEC Standard 61000-3-2, Mar. 2009.
[5] Mansoor, A., Grady, W.M., Thallam, R.S., Doyle, M.T., Krein, S.D. and Samotyj, M.J., Effect of supply voltage harmonics on the input current of single-phase diode bridge rectifier loads. IEEE Transactions on Power Delivery, 10 (3), pp. 1416-1422, 1995. DOI: 10.1109/61.400924 [ Links ]
[6] Cobben, S., Kling, W. and Myrzik, J., The making and purpose of harmonic fingerprints. Proceedings of the 19th International Conference on Electricity Distribution (CIRED), pp. 1-4, 2007. [ Links ]
[7] Nassif, A. and Acharya, J., An investigation on the harmonic attenuation effect of modern compact fluorescent lamps. Proceedings of the 13th International Conference on Harmonics and Quality of Power, pp. 1-6, 2008. DOI: 10.1109/ICHQP.2008.4668759 [ Links ]
[8] Collin, A., Cresswell, C. and Djokic, S., Harmonic cancellation of modern switch-mode power supply load. Proceedings of the 14th International Conference on Harmonics and Quality of Power - ICHQP, pp. 1-9, 2010. DOI: 10.1109/ichqp.2010.5625422 [ Links ]
[9] Müller, S., Meyer, J. and Schegner, P., Characterization of small photovoltaic inverters for harmonic modeling. Proceedings of the 15th International Conference on Harmonics and Quality of Power - ICHQP, pp. 659-663, 2014. DOI: 10.1109/ichqp.2014.6842929 [ Links ]
[10] Creswell, C., Steady state load models for power system analysis, PhD. Thesis, Department of Electrical Engineering, The University of Edinburgh, Edinburgh, 2009. [ Links ]
[11] Wei, Z., Watson, N.R. and Frater, L.P., Modeling of compact fluorescent lamps. Proceedings of the 13th International Conference on Harmonics and Quality of Power, pp. 1-6, 2008. DOI: 10.1109/ICHQP.2008.4668833 [ Links ]
[12] Blanco, A., Stiegler, R. and Meyer, J., Power quality disturbances caused by modern lighting equipment (CFL and LED). Proceedings of the IEEE Powertech, pp. 1-6, 2013. DOI: 10.1109/ptc.2013.6652431 [ Links ]
[13] Redl, R. and Balogh, L., Power-factor correction in bridge and voltage-double rectifier circuits with inductors and capacitors. Proceedings of the Applied Power Electronics Conference and Exposition, pp. 466-472, 1995. [ Links ]
[14] Ibrahim, K.F., Newnes guide to television and video technology. Fourth Edition. Oxford: Elsevier, 2007. [ Links ]
[15] Basso C.P., Switch-Mode power supplies spice simulations and practical designs. New York: McGraw Hill, 2008 [ Links ]
[16] ON Semiconductor, Power factor correction (PFC) handbook. Choosing the right power factor controller solution. Denver: ON Semiconductor, 2011. [ Links ]
[17] Cuk, V., Cobben, J., Kling, W.L. and Timens, R., An analysis of diversity factors applied to harmonic emission limits of energy saving lamps. Proceedings of the 14th International Conference on Harmonics and Quality of Power - ICHQP, pp. 1-6, 2010. DOI: 10.1109/ichqp.2010.5625406 [ Links ]
[18] Meyer, J., Schegner, P. and Heidenreich, K., Harmonic summation effects of modern lamp technologies and small electronic household equipment. Proceedings of the 21st International. Conference on Electricity Distribution (CIRED), pp. 1-4, 2011. [ Links ]
A.M. Blanco, finished her BSc. and MSc. studies at the Departamento de Ingeniería of the Universidad Nacional de Colombia. Currently she is developing a PhD in Electrical Engineering at the Technische Universität Dresden, Germany. Her research interests are power quality analysis, modeling and simulation and probabilistic aspects of power quality.
S. Yanchenko, received his MSc. in Electric Engineering from Moscow Power State Institute, Moscow, Russia in 2010. Since then he has been working as a researcher at the Department of Electric Supply of Industrial Enterprises, MPEI. His main research interests involve harmonic modeling of residential nonlinear loads including active power factor correction devices and renewables.
J. Meyer, studied Electrical Power Engineering at Technische Universität Dresden, Dresden, Germany, where he received the Dipl.-Ing. He completed his PhD. with a thesis on the statistical assessment of power quality in distribution networks. Since 1995 he has been working with the Institute of Electrical Power Systems and High Voltage Engineering at the same university. He is a member of several working groups. His fields of interest are all aspects of design and management of large power quality monitoring campaigns and theory of network disturbances, especially harmonics.
P. Schegner, studied Electrical Power Engineering at the Darmstadt University of Technology, Germany, where he received the Dipl.-Ing. After that he worked as systems engineer in the field of power system control and became a member of the scientific staff at the Saarland University, Germany, completing his PhD. with a thesis on the earth-fault distance protection. He then worked as head of the development department of protection systems at AEG, Frankfurt A.M., Germany. Currently he is a professor of Electrical Power Systems at the Technische Universität Dresden, Germany.


