Services on Demand
Journal
Article
Indicators
-
 Cited by SciELO
 -
 Access statistics
Related links
-
 Cited by Google
 -
 Similars in
SciELO
 -
 Similars in Google
Share
DYNA
Print version ISSN 0012-7353
Dyna rev.fac.nac.minas vol.82 no.194 Medellín Nov./Dec. 2015
https://doi.org/10.15446/dyna.v82n194.44147
DOI: http://dx.doi.org/10.15446/dyna.v82n194.44147
The effect of crosswinds on ride comfort in high speed trains running on curves
Influencia del viento lateral en el confort de vehículos ferroviarios de alta velocidad circulando en curvas
Miguel Aizpun-Navarro a & Ignacio Sesma-Gotor b
a Escuela de Ingeniería Mecánica, Pontificia Universidad Católica de Valparaíso, Valparaíso, Chile. miguel.aizpun@ucv.cl
b Departamento de Mecánica Aplicada, CEIT, Donostia San Sebastián, España. nacho.sesma@me.com
Received: July 25th, 2014. Received in revised form: March 15th, 2015. Accepted: November 8th, 2015
This work is licensed under a Creative Commons Attribution-NonCommercial-NoDerivatives 4.0 International License.
Abstract
The effect of crosswinds on the risk of railway vehicles overturning has been a major issue ever since manufacturers began to produce lighter vehicles that run at high speeds. However, ride comfort can also be influenced by crosswinds, and this effect has not been thoroughly analyzed. This article describes the effect of crosswinds on ride comfort in high speed trains when running on curves and for several wind velocities under a Chinese hat wind scenario, which is the scenario recommended by the standard. Simulation results show that the combination of crosswinds and the added stiffness of the lateral bumpstop on the secondary suspension can become a significant source of instability, leading to flange-to-flange contact and greatly jeopardizing ride comfort. Moreover, this comfort problem is an issue even when the wheel unloading ratio is well below the standard's limits and vehicle safety can be guaranteed.
Keywords: Rail vehicle models; crosswind stability; ride quality.
Resumen
La influencia del viento lateral en el descarrilamiento de los vehículos ferroviarios es un factor crítico desde que se comenzaron a producir vehículos ligeros que circulan a altas velocidades. Además, el confort del pasajero también puede verse afectado por el viento lateral. Sin embargo, este efecto todavía no ha sido investigado en profundidad en la literatura ferroviaria. Este artículo describe el efecto del viento lateral en el confort para trenes de alta velocidad que circulan en curvas para diferentes velocidades de viento, utilizando un escenario de viento tipo sombrero chino. Las simulaciones muestran que la combinación del viento lateral y la rigidez del tope de la suspensión secundaria pueden suponer una fuente importante de inestabilidad, produciendo contacto pestaña-pestaña y disminuyendo significativamente el confort. Además, este efecto se produce cuando el índice de descarrilamiento está muy por debajo del límite según la norma de seguridad ferroviaria.
Palabras clave: modelos de vehículos ferroviarios; estabilidad con viento lateral; confort.
1. Introduction
Nowadays, rolling stock manufacturers are reducing the weight of railway vehicles while progressively increasing vehicle speed. This tendency has promoted research into the effect of crosswinds on high-speed railway vehicles due to the risk of overturning and issues relating to ride comfort.
The study of crosswinds on railway vehicles can be divided into two separate but complementary issues: the effect of crosswinds on the dynamic behavior of the vehicle; and the aerodynamics, which requires the study of steady and unsteady aerodynamic forces and their interaction with the vehicle system [1].
One of the main concerns in crosswind research has been the study of the risk of overturning due to high wheel unloading. Andersson et al. [2] showed that crosswinds are the main cause of wheel unloading, with a relative importance of 64%. Moreover, several other authors have studied the effect of crosswinds from a safety point of view. Sesma et al. [3] showed how this process could be analyzed by using a simple 2D model, whereas Carranini [4] focused instead on the parameters that should be included in car models to simulate crosswind effects on the vehicle. Thomas et al. made a major contribution to the state of the art in terms of vehicle dynamics when exposed to crosswinds. Their research in [5] compared different types of wind gusts in order to determine which one produces the highest wheel unloading value. Additionally, in [6] they compared on-track tests with 2D and 3D models of the real car, showing that although it is difficult to carry out on-track tests with high wind speed values, it is possible to reproduce those tests with computational models.
Even though safety is one of the most critical issues when studying crosswinds, it is also true that crosswinds are on most occasions a comfort issue rather than a safety issue. This is because once the safety standards are met there is a guarantee that those vehicles can run without being at risk of overturning. Some authors, such as Alfi et al. [7], Conde et al. [8] and Baker et al. [9] have approached this issue from this perspective. The first two articles deal with the improvement of ride comfort when using active secondary suspension, whereas the third article details a comfort test procedure in which a several kilometer track is simulated.
This article continues with the research on the effect of crosswinds on vehicle comfort by analyzing the behavior of a railway vehicle under a Chinese hat wind scenario [10] while running on a curve using a full multibody model. The aim of this work is to show the instability effects that can be caused by crosswinds, which directly influence passenger comfort. The lateral bumpstop effect of the secondary suspension is also analyzed in order to assess its importance on ride comfort.
The article is organized as follows. First the vehicle model, the wind and track scenarios, and the process of how vehicle comfort is analyzed are described. Then the main body of the article presents the analysis of vehicle comfort while running on a curve under the effects of the wind scenario. In addition, the influence that the lateral bumpstop has on curve ride comfort is presented in the last part of the article.
2. Definition of a multibody model and wind/track scenario for comfort analysis
Prior to analyzing ride comfort on a curved track, the multibody model of the vehicle and the chosen wind and track scenario must be described.
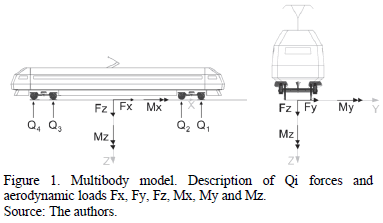
Analyzing a vehicle running on a curve requires the problem to be studied in 3D, so only a full multibody model can be used (see [11] for another example). The model has 23 bodies and 44 degrees of freedom. The aerodynamic forces, which are represented in Fig. 1, have been computed by taking into account the coefficients provided by the annex of standard EN 14067-6 for an ICE3 train. The carbody, bogies and wheelsets each have six degrees of freedom. The primary suspension consists of vertical and lateral linear springs and dampers. The secondary suspension was built in vertical, lateral and longitudinal directions, and linear and non-linear springs and dampers were taken into account. In addition, torsion springs were added to the full model. However, the model parameters were estimated in order to have a "generic high speed vehicle", and they do not correspond exactly to any existing train.
The model includes the standard S1002 wheel profile, and the rail profile is UIC60 with an inclination of 1:40. The wheel-rail forces were calculated by means of Kalker's FASTSIM algorithm. Multibody simulations with a multibody model were run with the commercial MBS SIMPACK code [12].
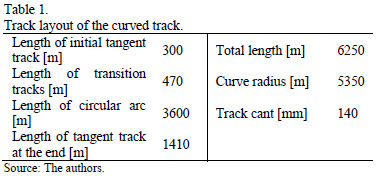
The track used in the model is fully described in Table 1. The curve radius and the cant in the curve were chosen according to the regulation provided by the Spanish railway administrator ADIF. The values selected are the minimum established by ADIF for the case of a new line and have a nominal speed of 300 km/h, which is the vehicle velocity used to study vehicle dynamics.
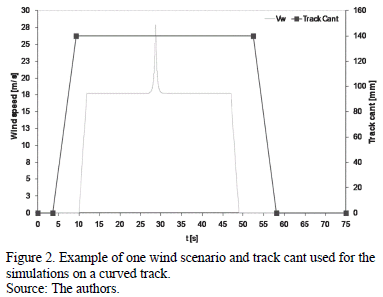
The scenario begins and ends with a tangent track. In between, there is the curved track with a constant 5350 m radius and a cant height of 140 mm. The curved section is connected to the tangent tracks by a transition track, where both the cant and the radius increase linearly. In terms of wind direction, in order to create the most critical loading case the wind attack angle was set to 90 degrees along the whole scenario. Because wind forces act in the same direction of the centrifugal force, the effects of both the wind and the curve were added. Finally, the Chinese hat wind scenario begins and ends when the vehicle runs on the constant radius curve (see Fig. 2). The standard [10] defines this gust model as an input for multibody model simulations. The full wind scenario includes a linear rise to the base level of wind (18m/s in Fig. 2) when the train is loaded in steady state. The rise of the wind speed corresponds to the Chinese hat scenario that represents the wind gust. After reaching the maximum wind speed, it decreases again to the previous base level, also following the Chinese hat function. We then use another time period with constant wind loads. Lastly, we make a linear decrease to zero wind speed in order to complete the scenario.
The wind scenario was considered a 'discrete event'. Time signals of the non-compensated acceleration were extracted from the simulations. Two sensors provided the signals; one was located at the front-end of the passenger compartment above the bogie, and the other was located in the geometric center of the same car. Time signals were filtered using a low-pass 2nd order Butterworth filter with an upper corner frequency of 2.52 Hz.
The results presented in the following sections compare three load cases created by three different wind velocities: 20 m/s, 25 m/s and 30 m/s. These wind scenarios are compared to a fourth scenario with no wind. The purpose of the experiment is to check the stability and comfort of the vehicle running on the curve with no wind and to show that the hunting oscillation does not appear until the crosswinds reach a certain speed.
3. Vehicle comfort while running on a curve when there are crosswinds
Although the aim of the article is to analyze the effects of crosswinds on vehicle comfort, it seems logical to first check the value of the wheel unloading ratio in order to dismiss the possibility of reaching the maximum value set by the safety standards.
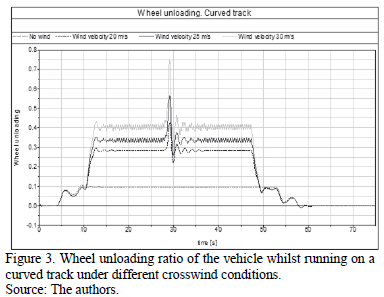
Fig. 3 shows the time signal of the wheel unloading ratio. The value of this ratio was close to 0.1 when the vehicle ran with no wind. This measurement seems reasonable since the value of the curve radius was set to keep the vehicle stable, with low values for the wheel unloading ratio and the derailment factor. Obviously, wheel unloading increases with wind speed, with 0.75 being the maximum value; therefore, there is still certain margin until the limit value (0.9) is reached. The vehicle is stable with a wind speed of 20 m/s; however, it is somewhere near 22 m/s when the instability becomes noticeable (not represented in the figure). The time signal already indicates the instability with a wind speed of 25 m/s, which only increases when the speed is 30 m/s. A Fast Fourier Transform (FFT) of the signals reveals that the frequency matches the natural frequency of the vehicle's hunting oscillation.
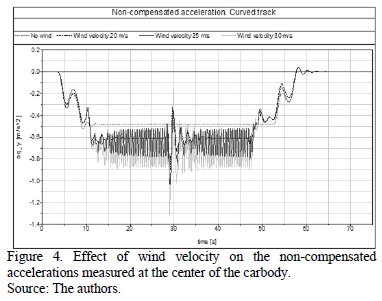
Comfort is qualitatively assessed by using the information from the lateral non-compensated accelerations represented in Fig. 4, setting the no-wind scenario as a reference. Both the track layout and the vehicle satisfy the standards for maximum lateral accelerations since the restriction from the ride comfort standard is to keep accelerations below 0.6 m/s2 for high-speed vehicles when there is no wind scenario.
The 20 m/s wind speed case increases the acceleration value, but it is still within the limits, even though the maximum value is 0.9 m/s2 when the gust of wind hits the vehicle. However, this acceleration is not considered since instant values do not fall within the scope of comfort standards. The 25 m/s and 30 m/s wind speed cases cause the average value of the accelerations to be above the limits, and they also result in high peak-to-peak acceleration values. Leaving aside the influence of frequencies on comfort, peak-to-peak values are significant since passengers feel both the average value and the amplitude of accelerations. This means that the worst comfort indexes are reached, not only because of higher average values, but also as a result of having higher acceleration amplitudes. Since the peak-to-peak values increase by 0.3 m/s2 and 0.4 m/s2 in the 25 m/s and 30 m/s wind speed cases, the comfort index will be substantially worse in comparison with the 20 m/s wind speed case.
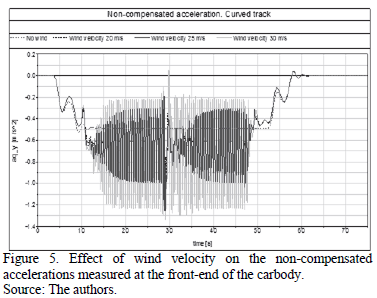
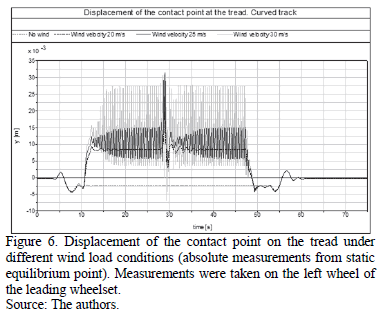
Thus, according to the results in Fig. 4, we can conclude that crosswinds can also become a source of instability that significantly reduces ride comfort. Fig. 5 and Fig. 6 provide more information about vehicle instability by analyzing the signals from two different vehicle points and the displacement of one wheel-rail contact point.
When the vehicle runs on tangent track, the sensor located in the front-end records the same acceleration level as the center sensor. However, on curved tracks, passengers located near the front-end of the compartment always have worse ride comfort (see Fig. 5). The reason for this behavior is that the leading bogie is always more unstable, which means that positions near the front-end lead to higher peak-to-peak values. Taking the 30 m/s wind speed scenario as an example, the peak-to-peak value at the front-end of the carbody increases up to 1 m/s2, which is 0.6 m/s2 higher than the value measured at the center of the carbody. This means that the increase of the peak-to-peak acceleration value equals the limit value of the non-compensated acceleration given by the CEN standard. Nevertheless, as expected, the average acceleration value does not change between the front-end and the center of the carbody.
The increase in instability can be easily observed in Fig. 6, which represents the displacement of the contact point at the wheel's tread. The coordinate system is defined with the Y-axis pointing to the flange, i.e. positive values denote that the contact point is moving towards the flange.
The contact point moves towards the interior of the curve when there is no wind loading the vehicle. Once crosswinds begin to load the vehicle, the contact point changes direction, moving towards the flange. As previous figures showed, the 20 m/s wind speed case showed no hunting oscillation, and, in fact, the contact point describes a stable movement along the whole scenario. Fig. 6 shows that the larger the loads, the more unstable the contact point movement along the tread becomes, with amplitudes increasing as the wind loads increase.
In the 30 m/s wind speed case, the contact point moves up to the limit of the thread, reaching flange contact in the instant when the gust of wind appears (around second 28). Since the wheel unloading ratio limit was not reached in any of the presented load cases, we expect to have severe flange contact during the times when wind loads are constant (between 12 s to 28 s and from 32 s to 47 s), if larger loads are introduced in the model. When the wind speed is 30 m/s, the contact point already reaches the limit of the wheel's tread, and since there is still room to increase the wind loads until the wheel unloading reaches 0.9; the instability of the vehicle will also increase. The leading wheelset will then describe an unstable movement in which the wheels' flanges at both sides will make contact with the rail.
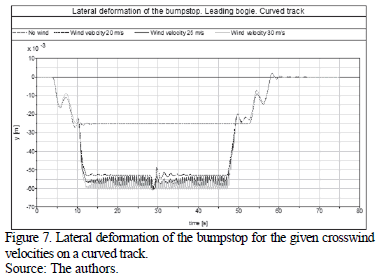
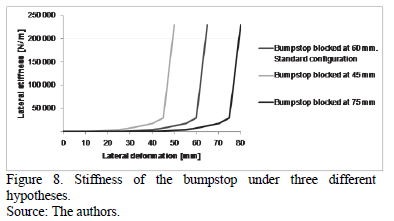
Simulations showed that the vehicle instability explained above is caused by the effect of the added stiffness of the lateral bumpstops of the secondary suspension. These components have a non-linear stiffness characteristic, so the value of the stiffness depends on the lateral deformation of the suspension element. In addition, these bumpstops have a +/- 25 mm clearance (stiffness 0 N/m). The element begins to introduce stiffness to the model for displacements larger than 25 mm, and the bumpstop reaction force progressively increases until the suspension is blocked (limit of bumpstop deformation). The suspension cannot be deformed by more than 60 mm (lateral deformation from a centered position) since the lateral stiffness introduced by the element is very high (stiffness 230 000 N/m).
Fig. 7 shows that in the case of a vehicle running on a curve without wind, the lateral displacement of the bumpstop is 25 mm, which means that the element is not yet working. For low wind speeds, such as 20 m/s, the vehicle does not hunt even though the lateral deformation of the bumpstop is quite high (52 mm) and the bumpstop is already increasing the overall lateral stiffness of the vehicle. By increasing the wind speed up to 25 m/s, the vehicle is already hunting when the wind loads are constant and the lateral suspension is not blocked. For this wind speed, the bumpstop only gets blocked with the wind gust. However, the suspension is blocked during the whole wind scenario when the wind speed is 30 m/s.
3.1. Influence of lateral bumpstop on vehicle comfort under crosswinds
This sub-section deals with the effect of one specific vehicle component, the lateral bumpstop of the secondary suspension on the vehicle comfort under different crosswinds scenarios.
The standard configuration of this component sets the maximum deformation of the vehicle's lateral bumpstop at 60 mm. If wind loads are high enough, the limit can be reached and cause passengers to feel unexpected discomfort. A suitable solution for this problem could be to increase the maximum deformation of this component. If this change is made, comfort improves but the downside is that the lateral displacement of the carbody increases and gauge problems can appear. Consequently, the solution should meet both gauge and bumpstop deformation requirements.
The multibody model had four lateral bumpstops: two on each bogie. The results presented here refer to the bumpstop located on the front bogie as simulations showed that it was the most critical. The sensitivity analysis discussed herein consisted of modifying the available lateral deformation and clearance but not modifying the stiffness of the bumpstop. This led to three different hypotheses, named by referring to the value of maximum deformation before blocking (see Fig. 8): the standard configuration (bumpstop blocked at 60 mm), bumpstop blocked at 45 mm and bumpstop blocked at 75 mm. By increasing the maximum lateral deformation of the element to 75 mm for example, the displacement where the lateral stiffness is zero (clearance) was also increased by 15 mm.
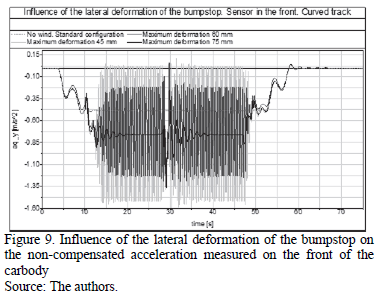
Fig. 9 shows a comparison of the non-compensated acceleration signals obtained when the vehicle runs on a curve. The chart compares the scenario where there are no crosswinds with the results of the scenario where the stiffness of the bumpstop was modified for the 30 m/s wind speed case. In the latter case, the accelerations obtained with the nominal value (suspension blocked at 60 mm of lateral deformation) are compared with the effect of reducing the maximum deformation to 45 mm, and also when the bumpstop blocks are at 75 mm.
By decreasing the allowed deformation of the bumpstop, the element operates at deformations corresponding to higher stiffness values, which indirectly increases the overall lateral stiffness of the vehicle. Results show that comfort is drastically reduced when the bumpstop blocking is set to 45 mm, since the peak-to-peak acceleration values increase, with the maximum amplitude being almost 1.6 m/s2. In this case, the element operates with the suspension blocked during the whole scenario, increasing the amplitude of the hunting oscillation in comparison to the 'standard configuration' hypothesis. Conversely, by allowing the bumpstop to become deformed up to 75 mm, the bumpstop operates at deformation values where the lateral stiffness is lower and the vehicle stops describing the hunting oscillation.
Simulations were also performed in order to account for the variation of the wheel unloading ratio after modifying the maximum deformation of the bumpstop from its nominal value (60 mm). The variations are small for both the tangent track and the curved track. However, the wheel unloading ratio is slightly more sensitive to variations when the vehicle runs on tangent track, although the differences do not seem very important and can be considered irrelevant.
By increasing the maximum displacement of the bumpstop, the vehicle's behavior in crosswinds improves and the hunting oscillation is most likely avoided. Simulations showed that the maximum percentage of the lateral displacement of the carbody's CoG is less than 10 per cent, which could be considered safe enough to avoid exceeding the gauge limits stated by the standards.
4. Conclusions
This article shows that crosswinds can have an effect on passenger comfort as well as on the risk of the vehicle overturning when running on curves. The lateral non-compensated accelerations were used to assess the vehicle comfort levels for the Chinese hat wind scenario for three different wind velocities-20m/s, 25m/s and 30m/s-which were then compared with the no-wind scenario. The vehicle shows stable behavior on curves at 20m/s, although for a 25m/s wind velocity value the vehicle is already unstable.
Results show that crosswinds can become a source of instability, which significantly reduces ride comfort, even when the wheel unloading ratio is well below the limits set by the safety standards. Thus, there can be comfort problems before there is any risk of overturning. Moreover, when running on curved tracks, positions near the leading end of the carbody always have worse ride comfort. Simulations confirm that this vehicle instability is also caused by the effect of adding the stiffness of the lateral bumpstop from the secondary suspension to the lateral stiffness of the whole vehicle, since the grouping effect of curve and crosswinds led to the activation of the most rigid part of the lateral bumpstop.
In addition, by changing the deformation/stiffness characteristics of the bumpstop the hunting oscillation can be avoided, although this might involve gauge problems. Thus, other options such as increasing the lateral stiffness of the secondary suspension, modifying the stiffness characteristics of the first part of the bumpstop curves, or including active secondary suspensions devices (centering systems), could be analyzed in order to deal with this drawback.
References
[1] Baker, C., The flow around high speed trains. J. Wind Eng. Ind. Aerodyn., 98, pp. 277-298, 2010. DOI: 10.1016/j.jweia.2009.11.002 [ Links ]
[2] Andersson, E., Häggströn, J., Sima, M. and Stichel, S., Assessment of train overturning risk due to strong cross-winds. Proc. IMechE, Part F: J. Rail and Rapid Transit, 218, pp. 213-223, 2004. DOI: 10.1243/0954409042389382 [ Links ]
[3] Sesma, I., Vinolas, J., San Emeterio, A. and Gimenez, J.G., A comparison of crosswind calculations using a full vehicle and a simplified 2D model. Proc. IMechE, Part F: J. Rail and Rapid Transit, 226, pp. 305-317, 2012. DOI: 10.1177/0954409711424094 [ Links ]
[4] Carrarini, A., Efficient models and techniques for the computational analysis of railway vehicles in crosswinds. Vehicle System Dynamics, 46, pp. 77-86, 2008. DOI: 10.1080/00423110701882322 [ Links ]
[5] Thomas, D., Diedrichs, B., Berg, M. and Stichel, S., Dynamics of a high-speed rail vehicle negotiating curves at unsteady crosswind. Proc. IMechE, Part F: J. Rail and Rapid Transit, 224, pp. 567-579, 2010. DOI: 10.1243/09544097JRRT335 [ Links ]
[6] Thomas, D., Berg, M. and Stichel, S., Measurements and simulations of rail vehicle dynamics with respect to overturning risk. Vehicle System Dynamics, 48, pp. 97-112, 2010. DOI: 10.1080/00423110903243216 [ Links ]
[7] Alfi, S., Bruni, S., Diana, G., Facchinetti, A. and Mazzola, L., Active control of airspring secondary suspension to improve ride quality and safety against crosswinds. Proc. IMechE, Part F: J. Rail and Rapid Transit, 225, pp. 1-15, 2010. DOI: 10.1243/09544097JRRT392 [ Links ]
[8] Conde-Mellado, A., Casanueva, C., Vinolas, J. and Gimenez, J.G., A lateral active suspension for conventional railway bogies. Vehicle System Dynamics, 47, pp. 1-14, 2009. DOI: 10.1080/00423110701877512 [ Links ]
[9] Baker, C.J., Hemida, H., Iwnicki, S., Xie, G. and Ongaro, D., Integration of crosswind forces into train dynamic modelling. Proc. IMechE, Part F: J. Rail and Rapid Transit, 225, pp. 154-164, 2011. DOI: 10.1177/2041301710392476 [ Links ]
[10] CEN. EN 14067-6 Railway Applications - Aerodynamics - Part 6: Requirements and test procedures for cross wind assessment, 2010. [ Links ]
[11] Lagos-Cereceda, R.F., Alvarez-C, K.L., Vinolas-Prat, J. and Alonso-Pazos, A., Rail vehicle passing through a turnout: Influence of the track elasticity. DYNA, 81(188), pp. 60-66, 2014. DOI: 10.15446/dyna.v81n188.40047 [ Links ]
[12] SIMPACK AG. SIMPACK Reference Guide - SIMPACK, 2008. Available from: www.simpack.de. [ Links ]
M. Aizpun-Navarro, received his MSc. in Mechanical Engineering in 2009, and his PhD in Mechanical Engineering (railway dynamics) in 2013, both from Tecnun-University of Navarra, San Sebastian, Spain. From 2008 to 2013 he worked at both the CEIT research centre on European research projects and for the Spanish railway manufacturer CAF while carrying out his PhD. Currently, he is an associate professor in the School of Mechanical Engineering, Facultad de Ingeniería, Pontificia Universidad Católica de Valparaíso, Chile. His research interests include: simulation, modeling and experiments concerning railway vehicle dynamics; noise and vibration in mechanical systems; and optimization of railway vehicle testing. ORCID: 0000-0003-1154-9659
I. Sesma-Gotor, received his MSc. in Mechanical Engineering in 2009, and his PhD in Mechanical Engineering (railway crosswinds) in 2013, both from Tecnun-University of Navarra, San Sebastian, Spain. From 2009 to 2013 he worked at the CEIT research centre on Spanish research projects while carrying out his PhD. Currently he is Operations Services Manager in Doppelmayr Cable Car. His research interests include: simulation and modeling concerning railway vehicle dynamics; simulation and modeling of railway vehicle aerodynamics; and analysis and design of railway wind fences. ORCID: 0000-0002-1881-493X


