Serviços Personalizados
Journal
Artigo
Indicadores
-
 Citado por SciELO
 -
 Acessos
Links relacionados
-
 Citado por Google
 -
 Similares em
SciELO
 -
 Similares em Google
Compartilhar
DYNA
versão impressa ISSN 0012-7353
Dyna rev.fac.nac.minas vol.83 no.195 Medellín jan./fev. 2016
https://doi.org/10.15446/dyna.v83n195.44519
DOI: http://dx.doi.org/10.15446/dyna.v83n195.44519
Implementation of a non-conventional method to characterize voltage sags and swells
Implementación de un método no convencional para caracterizar hundimientos y elevaciones de tensión
Jorge Enrique Celis-Montero a, Diego Fernando-Navas b & Ferley Castro-Aranda c
a Facultad de Ingeniería, EIEE, GRALTA, Universidad del Valle, Cali, Colombia. jorge.celis@correounivalle.edu.co
b Facultad de Ingeniería, EIEE, GRALTA, Universidad del Valle, Cali, Colombia. diego.navas@correounivalle.edu.co
c Facultad de Ingeniería, EIEE, GRALTA, Universidad del Valle, Cali, Colombia. ferley.castro@correounivalle.edu.co
Received: July 21th, 2014. Received in revised form: March 14th, 2015. Accepted: December 15th, 2015.
This work is licensed under a Creative Commons Attribution-NonCommercial-NoDerivatives 4.0 International License.

Abstract
Voltage sags and swells are among the power quality disturbances that represent the biggest economic losses for affected users. It is therefore necessary to undertake a suitable characterization of those events to conduct studies that permit the causes and possible mitigation techniques to be identified. This work describes the development of monitoring modules to characterize voltage sags and swells that could be used in Electromagnetic Transients Programs - EMTP (for example the ATP - Alternative Transients Program). The implemented module uses a novel method to characterize these disturbances. The results of the implementation show that the voltage sags and swells are appropriately characterized; furthermore, less sampled data is required from a voltage signal with respect to the conventional RMS voltage method. This could optimize the capture and analysis process of information in power quality monitoring.
Keywords: Electromagnetic transient analysis, parameter estimation, power distribution faults, power quality, power system modeling, simulation, simulation software, time-domain analysis.
Resumen
Dentro de los problemas de calidad de potencia que acarrean mayores pérdidas económicas sobre los usuarios afectados se encuentran los hundimientos y elevaciones de tensión. Debido a ello, se hace necesario caracterizarlos adecuadamente para emprender estudios que permitan identificar sus causas y posible formas de mitigación. En el presente trabajo se describe el desarrollo de un módulo de monitoreo para caracterizar hundimientos y elevaciones de tensión, el cual se puede usar en el Programa de Transitorios Electromagnéticos - EMTP (como ATP - Programa Alternativo de Transitorios). El módulo implementado usa un novedoso método para la caracterización de estos disturbios. Los resultados de la implementación muestran que los hundimientos y elevaciones son caracterizados adecuadamente, además, que el método requiere menos muestras de la señal de tensión respecto al método convencional de tensión RMS, lo cual podría optimizar el proceso de captura y análisis de la información durante el monitoreo de calidad de potencia.
Palabras clave: Análisis de transitorios electromagnéticos, análisis en el dominio del tiempo, calidad de potencia, estimación de parámetros, fallas en sistemas de distribución, modelado de sistema de potencia, simulaciones, software de simulación.
1. Introduction
For the development of smart grids, efficiency in detecting events of power quality is an important task in monitoring the power system.
The power quality disturbances that currently cause the greatest damage to industrial and commercial users are voltage sags [1-3]. A voltage sag is the sudden reduction of voltage at a particular point in an electricity supply system below a specified threshold, followed by its recovery after a brief interval between half cycle and 1 min [3].
When these disturbances are manifested, many industrial processes are halted because of inadequate operation of electronic equipment [4] like programmable logic controllers (PLC), computers and variable speed drives [6], as well electric induction motors [7]. Furthermore, controlled bridge rectifiers, generally used in DC motor speed controls, as well as in HVDC links, are also affected by voltage sags [8].
Sags are usually accompanied by voltage swells, which are sudden voltage increases above a threshold, between 110% and 180% of nominal voltage [3]. Both are caused by faults in electrical supply lines and are produced either by short circuits or by insulation faults due to lightning strokes [9], the starting up of large induction motors [10], operation of arc furnaces, or the load transfer between power supplies [11].
Current standards of power quality are quite precise in defining the necessary parameters to characterize voltage sags and swells [12]. The IEC 61000-4-30 standard [13] defines magnitude and duration as the sole parameters to characterize these disturbances.
Nevertheless, magnitude and duration are not the only parameters of voltage sags and/or swells that influence equipment behavior. The imbalance of sag and/or swell based on the type of fault (single-phase, phase-to-phase, or three-phase), the missing voltage, phase angle or point-on-wave, and phase shift are other parameters that also differentiate one event from another and that have a distinct impact on susceptible equipment [13,14].
Therefore, there is a needed to employ additional methods that characterize non-standard parameters of voltage sags and swells in order to evaluate other effects. There are other non-conventional methods that have been used to characterize some voltage sags and swells parameters.
The fundamental voltage component uses the Sliding Discrete Fourier Transform (SDFT) method to analyze non-stationary signals including voltage sags and swells [15,16].
The DQ transformation, also known as Park's transformation, is commonly used when modeling synchronous and induction motors. This transform has been used to study several power quality disturbances [17,18]..It is possible given that the three-phase AC voltages can be represented as DC voltages when applying the DQ transformation through which any disturbance in AC voltage is reflected as a disturbance in DQ values.
The Waveform Envelope method [19], is an approximate alternative that seeks to determine the initial and final times of a voltage sag, as of the waveform of the instantaneous voltage. However, other characteristics such as magnitude or phase shift cannot be obtained by this method.
The Kalman Filter is a method based on models that has been used in power systems to trace harmonics in real time [20], to estimate voltage and current parameters in protection systems and to estimate transient parameters [21]. There are at least two models to analyze voltage sags and swells with this method [22]: the linear model, which considers the magnitudes and angles of each harmonic component as state variables, and the extended model, which considers the frequency and the state variables of the linear model as its state variables.
The Wavelet Transform (WT) is a useful mathematical tool to analyze non-stationary signals [23]. It has been used to analyze electrical signals in power systems [24]. To study the voltage sags and swells, the multi-resolution analysis (MRA) is quite useful. The detail components provide information about the beginning and end of the said disturbances while the magnitude can be determined by two methods: the Discrete Wavelet Transform (DWT) coefficients method and the phasor method [22].
The Numerical Matrix method is generally used as a voltage sag detection technique for a Dynamic Voltage Restorer (DVR) [25]; however, the method is so adaptable and easy to apply that it could be used to characterize voltage sags and swells parameters.
This paper presents the implementation of Numerical Matrix method to characterize voltage sags and swells in EMTP.
This document is organized as follows. In Section II, the Numerical Matrix method is explained. In Section III, standard voltage sag signals are used to compare the performance of some characterization methods, including the Numerical Matrix method. Section IV describes the method implementation in EMTP and its performance in analyzing some events that were simulated in the IEEE 13-node test feeder. Finally, Section V presents this paper's conclusions.
2. Numerical Matrix
This method has been used as part of the DVR's control system [25]. It has small response times and yields results that can be directly interpreted. As such, the method is applied to each phase independently and it, monitors the start and end of the voltage sag, the remaining voltage and the phase shift.
The method involves sampling the voltage signal and storing it in matrix format. Whenever the dominant frequency components from the source are known, the following equations may be used:
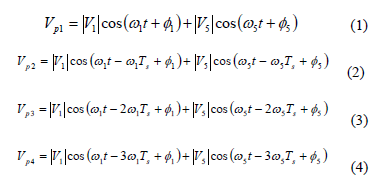
where Vp1 is the current sample of the voltage; Vp2, Vp3, and Vp4 are the samples of the voltage in prior sampling periods, |V1| and |V5| are the magnitudes of the fundamental and 5th harmonic, F1 and F5 are the corresponding phase angles, w1 and w5 are the angular frequencies of the fundamental and 5th harmonic, and Ts is the signal's sampling period.
Depending on the number of harmonics detected in the voltage signal, the number of equations to be solved can decrease or increase so that the number of simultaneous equations required to find a solution is always double the total number of frequencies considered.
If the dominant harmonics are not included in the equations, or if they are unknown, the solution can contain errors. This denotes the sensitivity of the matrix, which is related to the size of the error [25]. This is how the sensitivity of the matrix increases with the order of the unknown harmonics. It has also been found that the sensitivity increases if the sampling period (Ts) is very small.
If we reorganize (1), (2), (3) and (4) in matrix format, we obtain:

Knowing the voltage data (Vp1-4) and the relation matrix "A", it is possible to determine the magnitudes and phases of the frequency components considered in the model.
The response time to detect changes in the magnitude and phase of the fundamental component depend on the sampling period and on the number of dominant harmonic components that are present in the voltage signal.
Finally, this method is useful to characterize voltage sags and swells, given that it delivers magnitude and phase shift directly. Also, it requires less samples of the voltage in respect to the standard RMS voltage method, which could be an advantage for the time sequence of events.
3. Comparison of characterization methods
The fundamental voltage component (employing SDFT), Kalman filter, Wavelet Transform, and Numerical Matrix are methods that could determine magnitude, duration and phase shift of voltage sags and swells. The standard RMS voltage method [13] only characterizes magnitude and duration of those events; however, it is the most commonly used [26]. The aforementioned methods can be compared to determine which one that delivers these parameters (magnitude and duration) with the least error. We must note that due to the lack of a standard procedure to measure the phase shift, only magnitude and duration were compared for the methods analyzed.
To conduct the comparison, a basic implementation of the selected methods was carried out: we used a sliding window of a half cycle for the RMS voltage method; for the Kalman filter method, we used the extended model [22]; for the Wavelet transform method, we used Daubechies 6 as "mother wavelet" for first level MRA analysis [27], and we used the phasor method to determine the magnitude of voltage; for the Numerical matrix method, we assumed fundamental component and 5th harmonic.
With the basic implementation of the methods described above, we were able to analyze standard signals of known magnitudes and durations. The standard signal was a 60-Hz pure sinusoidal wave, 1 per unit of nominal voltage, and a sampling period of 65.1 ms (256 samples per cycle). Waves of different magnitudes were superimposed on this signal (from 10 to 90% in 10 steps), and different points on the wave (from 0° to 360º in steps of 10°) for each magnitude were superimposed. The phase angle was always conserved, which is equivalent to simulating different voltage sags without phase shift.
The relative error of magnitude was calculated from the magnitude of the known standard signal and the magnitude estimated through each method by considering the detection methodology described in the IEC 61000-4-30 standard [13].
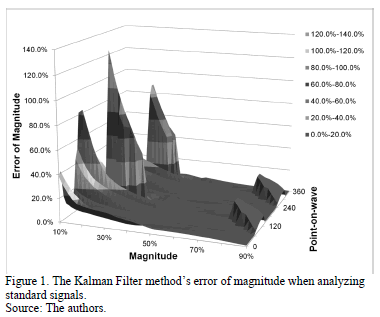
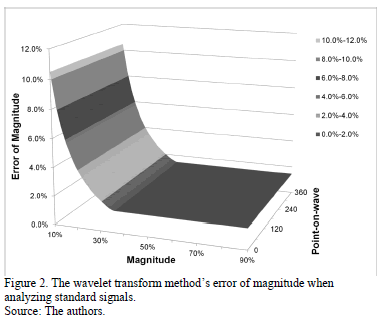
According to the results, the relative errors of magnitude for the RMS voltage and the fundamental component (SDFT) methods were negligible. The error in estimating the magnitude with the Kalman filter method can be observed in Fig. 1, and the error of magnitude obtained with the wavelet transform method is shown in Fig. 2.
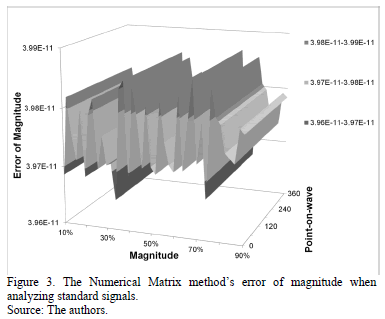
Fig. 3 shows the error of magnitude estimated with the numerical matrix method. According to the figure, the error obtained with this method can be considered negligible.
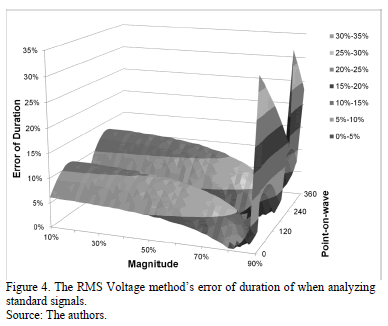
Fig. 4 shows the relative error of duration obtained with the RMS voltage method. It was calculated using the standard signal's known data of duration , as in the case of error of magnitude. Only those methods that yielded the lowest error in estimating the duration were compared.
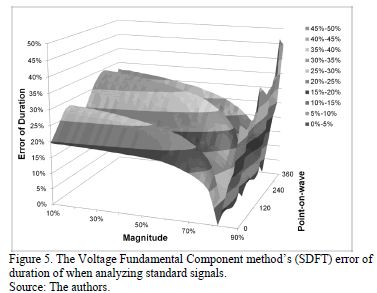
The relative error of duration obtained with the fundamental voltage component method (SDFT) is shown in Fig. 5. It can be seen that the error is higher than with the RMS voltage method; this is because the SDFT needs to analyze a whole period of the signal to deliver a result.
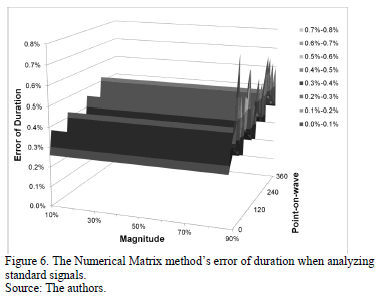
Finally, Fig. 6 shows the lowest error in estimating duration, which is obtained with the Numerical Matrix method.
When comparing results the Numerical Matrix method is suitable to characterize voltage sags and swells because it has the lowest error in estimating magnitude and duration of these disturbances. As such, this method has been selected to be used in the electromagnetic transient analysis software EMTP.
4 Implementation of numerical matrix method in EMTP
By comparing the results yielded by existing voltage sag and swell characterization methods, it was possible to determine that the Numerical Matrix method delivers the least errors in estimating the magnitude and duration of these disturbances. Therefore, this method will be adapted to create a monitoring module to characterize voltage sags and swells.
The monitoring module must be able to analyze a sinusoidal-type signal, of any magnitude, frequency, and phase angle; a signal that must be delivered by the simulation tool employed. The results obtained by this module must be the sum of events occurring during the time of signal analysis indicating the type of disturbance, the magnitude and duration, the graphic of the magnitude of the fundamental component and additionally, the graphic of the phase shift during the period analyzed.
The algorithm developed for the monitoring module must include the execution of the Numerical Matrix method over simulation time. As was previously explained, this method delivers the magnitude of the fundamental voltage of the signal analyzed. Thereafter, the algorithm must carry out, in each simulation step, the comparison of the voltage magnitude with the detection threshold; it must register the instants during which that threshold is surpassed and, thus, determine the duration of the disturbance. Finally, the algorithm must deliver the record of the events found along with the characteristics of magnitude and duration.
The monitoring module was developed using the transient analysis tool EMTP (ATP), and the programming of the algorithm was carried out using FORTRAN.
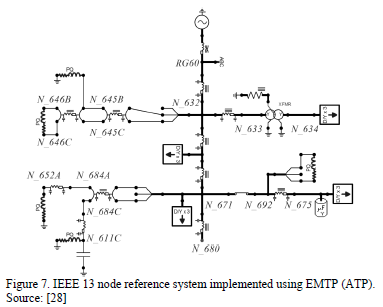
For the corresponding test of the monitoring module that was implemented, we modeled the IEEE 13-node test feeder [28]. However, the voltage regulator was omitted and all loads were modeled as constant impedances (Fig. 7).
The N_675 node was chosen as the measuring node on the reference system while the failures were generated on N_632 node.
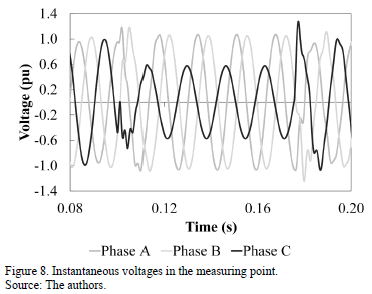
With a sampling time of 1.302E-4 s (128 samples per cycle at 60-Hz), the voltage signals in the measuring node were recorded when a single-phase-to-ground fault of 0.6W-impedance and 74 milliseconds in duration was generated in N_632 node. Fig. 8 shows the resulting signals and it is evident that there is a voltage sag on phase C along with a slight increase in the maximum voltage in other phases.
The monitoring module was localized in the measuring node for characterizing the voltage sags and swells.
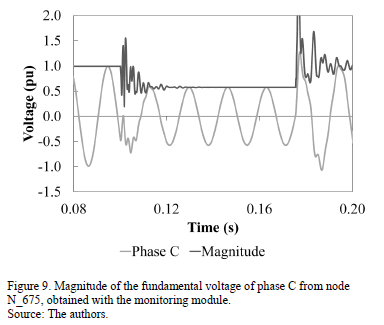
Fig. 9 shows the comparison of the voltage input signal of phase C with the magnitude of the fundamental voltage given by the monitoring module. As seen in the figure, there are oscillations of fundamental voltage magnitude at the beginning and end of the voltage sag. These are related to the low-frequency oscillatory transients that the voltage signal presents in those instants.
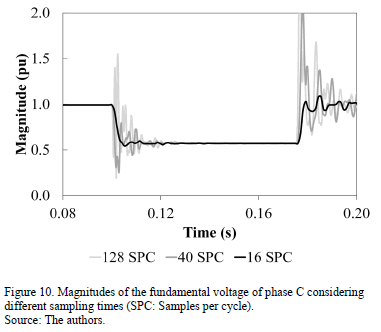
As the sensitivity of the matrix in the numerical matrix method depends on the amount of harmonics in the model and the sampling period, the monitoring module was adjusted to include four harmonic components in the model (fundamental, 5th, 7th and 11th harmonics), and the sampling times were varied to reduce the error in the results.
Fig. 10 shows the magnitudes of fundamental voltages obtained for the stated case while considering different sampling times. As can be verified, as the sampling times increase, the oscillations in the magnitude are reduced.
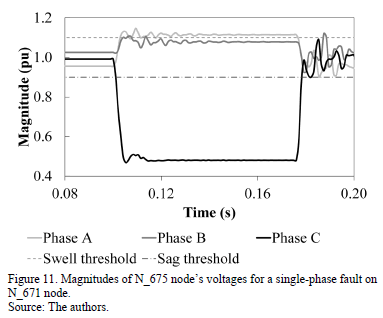
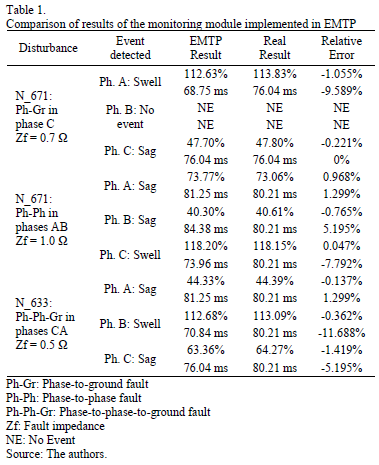
Accordingly, we chose a 1.04167E-3 s sampling time (16 samples per cycle) to analyze the various types of faults in the reference system. Fig. 11 shows the magnitudes of the three-phase voltages in the measuring node when a single-phase fault exists on phase C of the N_671 node with a fault impedance of 0.7 W. In this case, a voltage sag in phase C and a voltage swell in phase A were observed.
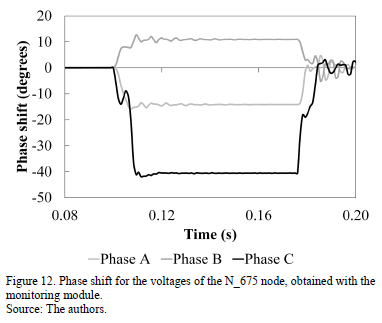
Fig. 12 shows the phase shift of each phase given by the monitoring module. This parameter was calculated independently with respect to the angle of each signal.
To determine if the results obtained by the monitoring module were accurate, the relative error percentage was found, which was calculated from "real values". To establish the real duration of each event, the time difference between the beginning and end of the fault current was determined, while the result given by the RMS voltage method according to IEC 61000-4-30 [13] was used for the magnitude.
Table 1 shows the results given by the monitoring module for various simulated cases.
From the results shown in this table, it can be stated that the monitoring module implemented in EMTP furnishes results with very low errors; hence, it is quite effective in characterizing these disturbances.
5. Conclusions
It is necessary to study other characteristics of voltage sags and swells, which will be useful to develop an analysis of the causes and the impacts they have. Phase shift may be considered to be another characteristic that could be studied. However, no standard procedure exists to determine the phase shift presented by voltage when it is affected by sag or swell. In terms of future work, a methodology must be established to measure this characteristic, as well as the identification of the correlation between phase shift and fault cause.
The monitoring module that was developed to characterize voltage sags and swells showed good results for the analysis of simulated signals. However, the accuracy of the results depends on the presence of noise in the signals that were analyzed. Therefore, if we want to implement it in a real system we must consider additional possibilities in real time signal processing, such as applying low pass filters, establishing the predominant harmonics of voltage signals at the start of the measurements, and setting the sampling time according to the noise signal present, etc.
The advantage of using the Numerical Matrix method to characterize voltage sags and swells is that it requires less data from voltage signals in comparison to the RMS voltage conventional method. This means that the process of capture, analysis and storage of information in power quality monitoring can be accelerated.
In terms of future work, the monitoring module could be complemented by analyzing real signals, and the results compared with those obtained by conventional measurement equipment.
References
[1] Waskito, F. and Banmongkol, C., Simulation of the voltage sag effects on an induction motor, International Conference on Consumer Electronics, Communications and Networks (CECNet), pp. 731-734, 2011. DOI: 10.1109/CECNET.2011.5768900. [ Links ]
[2] Villate-Martinez, J. y Garcia-Tejedor, J., La calidad del suministro eléctrico y su mejora mediante convertidores de potencia. Revista DYNA, 79(3), pp. 30-34, 2004. [ Links ]
[3] Yamamoto, K., Ikeda, K., Tsurusaki, Y. and Ikeda, M., Characteristics of voltage Sag/Swell compensator utilizing single-phase matrix converter, International Conference on Electrical Machines and Systems, pp. 1863-1868, 2013. DOI: 10.1109/ICEMS.2013.6713300. [ Links ]
[4] IEC. Electromagnetic compatibility (EMC). Environment. Voltage dips and short interruptions on public electric power supply systems with statistical measurement results. PD IEC/TR 61000-2-8, 1, Geneva: IEC, 2002. [ Links ]
[5] Gil-Montoya, F., Manzano-Agugliaro, F., Gómez-Lopez, J. y Sánchez-Alguacil, P., Técnicas de investigación en calidad eléctrica: Ventajas e inconvenientes. Revista DYNA, 79(173), pp. 66-74, 2012. [ Links ]
[6] Almeida, C. and Kagan, N., Using genetic algorithms and Fuzzy programming to monitor voltage sags and swells. IEEE Intelligent Systems [online]. 26(2), 2011. [date of reference July 3th 2014]. Available at: http://ieeexplore.ieee.org/stamp/stamp.jsp?tp=&arnumber=5696715. DOI: 10.1109/MIS.2011.2. [ Links ]
[7] Gonçalves, J., Baptista, J., Neves, L. and Tadeu-Oliveira. F., Simulation of the effect of voltage transients on an induction motor with ATP / EMTP, International Conference on Renewable Energies and Power Quality (ICREPQ), pp. 63-69, 2009. [ Links ]
[8] Dofnas, L., A novel method to mitigate commutation failures in HVDC systems, International Conference on Power System Technology (PowerCon), pp. 51-56, 2002. DOI: 10.1109/ICPST.2002.1053503. [ Links ]
[9] Bollen, M.H.J., Voltage sags characterisation. Understanding power quality problems: Voltage sags and interruptions, 1st ed. New York, USA, Wiley, 2000, pp. 139-168. [ Links ]
[10] Gomez, J.C, Reineri, C., Campetelli, G. and Morcos, M.M., A study of voltage sags generated by induction motor starting, Electric. Power Components and Systems, 32(6), pp. 645-653, 2010. DOI: 10.1080/15325000490228423. [ Links ]
[11] Chen, C., Wang, H. and Chin, Y., A simple rule-based approach for detection and classification of voltage sag, swell, and interruption in power systems, International Conference on Power Electronics and Drive Systems, (IEEE PEDS), pp. 5-8, 2011. DOI: 10.1109/PEDS.2011.6147338. [ Links ]
[12] IEEE. Recommended practice for monitoring electric power quality. IEEE Std 1159, 2009. [ Links ]
[13] IEC. Electromagnetic compatibility (EMC) Part 4-30: Testing and measurement techniques - Power quality measurement methods, IEC 61000-4-30, 2008. [ Links ]
[14] IEEE. Recommended practice for the design of reliable industrial and commercial power systems, IEEE Std 493, 2007. [ Links ]
[15] Bollen, M. and Gu, I., Processing os stationary signals, signal processing of power quality disturbances, 1st ed. New York, USA, Wiley, 2006, pp. 222-226. [ Links ]
[16] Jacobsen, E. and Lyons, R., The sliding DFT, IEEE Signal Processing Magazine. [online]. 20(2), 2003. [date of reference July 3th 2014]. Available at: http://ieeexplore.ieee.org/stamp/stamp.jsp?arnumber=01184347. DOI: 10.1109/MSP.2003.1184347. [ Links ]
[17] Montero-Hernandez, O.C. and Enjeti, P.N., A Detection algorithm suitable for mitigation of numerous power quality disturbances. IEEE Transactions on Industry Applications [online]. 41(6), 2005. [date of reference July 3th of 2014]. Available at: http://ieeexplore.ieee.org/stamp/stamp.jsp?tp=&arnumber=1542324. DOI: 10.1109/IAS.2001.955994. [ Links ]
[18] Zhao, Y., Yonghai, X., Xiangning, X., Yongqiang, Z. and Chunlin, G., Power quality disturbances identification based on DQ conversion, Wavelet Transform and FFT, Asia-Pacific Power and Energy Engineering Conference (APPEEC), pp. 1-4, 2010. DOI: 10.1109/APPEEC.2010.5448526. [ Links ]
[19] Djokic, S.Z., Milanovic, J.V. and Rowland, S.M., Advanced voltage sag characterisation II: Point on wave. IET Generation, Transmission & Distribution [online]. 1(1), 2007 [date of reference July 3th of 2014]. Available at: http://ieeexplore.ieee.org/stamp/stamp.jsp?arnumber=04082380. DOI: 10.1049/iet-gtd:20050434. [ Links ]
[20] Mostafa, M.A., Kalman filtering algorithm for electric power quality analysis: Harmonics and voltage sags problems, Large Engineering Systems Conference Power Engineering, pp. 159-165, 2007. DOI: 10.1109/LESCPE.2007.4437371. [ Links ]
[21] González, M. and Cardenas, V., The kalman filter in power quality - theory and applications, Kalman Filter. 1st ed. USA, InTecch, 2010, pp. 101-125. DOI: 10.5772/9582. [ Links ]
[22] Perez-Fernandez, E., Nuevo método de detección y análisis en tiempo real de eventos en la tensión de suministro de energía eléctrica empleando un modelo combinado wavelets-filtro de Kalman extendido, Tesis Doctorado en Ingeniería, Departamento de Ingeniería Informática y Electrónica, Universidad de Cantabria, Santander, España, 2006. [ Links ]
[23] Christy, X., Vedamani, J., and Karthikeyan, S., Wavelet based detection of power quality disturbance - A case study, International Conference on Signal Processing, Communication., Computing and Networking Technologies (ICSCCN), pp. 157-162, 2011. DOI: 10.1109/ICSCCN.2011.6024534. [ Links ]
[24] Gallego-Tejada, J and Castro-Aranda, F., Análisis de señales por transformada Wavelet. La Transformada Wavelet aplicada a los sistemas eléctricos de potencia: Estado del Arte. 1st ed. Alemania, Editorial Académica Española, 2011, pp. 40-63. [ Links ]
[25] Fitzer, C., Barnes, M. and Green, P., Voltage sag detection technique for a dynamic voltage restorer. IEEE Transactions on Industry Applications [online]. 40(1), 2004. [date of reference July 3st of 2014]. Available at: http://ieeexplore.ieee.org/stamp/stamp.jsp?tp=&arnumber=1268198. DOI: 10.1109/TIA.2003.821801. [ Links ]
[26] Flores-Arias, J, Bellido-Outeiriño, J. y Moreno-Muñoz, A., A fast RMS meter for detecting sag events in household environments, International Conference on Consumer Electronics (ICCE), pp. 321-322, 2014. DOI: 10.1109/ICCE.2014.6776024. [ Links ]
[27] Parsons, A.C, Grady, W.M. and Powers, E.J., A wavelet-based procedure for automatically determining the beginning and end of transmission system voltage sags, IEEE Power Engineering Society, pp. 1310-1315, 1999. DOI: 10.1109/PESW.1999.747406. [ Links ]
[28] Distribution test feeders working group, 13-Bus Test Feeder [online]. Available at: http://ewh.ieee.org/soc/pes/dsacom/testfeeders/. [ Links ]
J.E. Celis-Montero, received his BSc. in Electrical Engineering in 2009, from the Universidad del Valle, Santiago de Cali, Colombia. He is currently undertaking his PhD. in Electrical and Electronic Engineering at the Universidad del Valle, Cali, Colombia. He has worked as a researcher at the High Voltage Research Group - GRALTA, Universidad del Valle, Cali, Colombia. His research interests focus on power quality, modeling and the simulation of power system transients, transformers, ferroresonance and smart grids. ORCID: 0000-0003-2488-8238
D. Fernando-Navas, received his BSc. in Electronic Technology in 2002, from the Universidad del Valle, Palmira, Colombia and his BSc. and MSc. in Electrical Engineering in 2009 and 2012 respectively, from the Universidad del Valle, Santiago de Cali, Colombia. He has worked as a researcher at the Grupo de Investigación en Alta Tensión - GRALTA and has been an active part of the Laboratorio de Alta Tensión at the Universidad del Valle, Cali, Colombia. He is currently an assistant professor in the Faculty of Engineering of the Electric and Electronic Engineering School at the Universidad del Valle (EIEE). His areas of interest are electricity markets, transformers, electrical equipment testing and vegetable oils. He is a member of the Committee 130 - Transformers ICONTEC Colombia. ORCID: 0000-0002-7316-7368
F. Castro-Aranda, received his BSc. and MSc. in 1992 and 1995 respectively, in Electrical Engineering from the Universidad del Valle, Santiago de Cali, Colombia and his PhD. in 2005 from the Universitat Politècnica de Catalunya, Spain. He is an associate professor at the Electric and Electronic Engineering School at the Universidad del Valle - EIEE (Santiago de Cali, Colombia). His research interests are focused on the areas of insulation coordination and systems modeling for transient analysis using EMTP. He is President of the Committee 130 - Transformers ICONTEC Colombia, and Director of the High Voltage Lab at the Universidad del Valle. ORCID: 0000-0002-4858-0222


