Servicios Personalizados
Revista
Articulo
Indicadores
-
 Citado por SciELO
 -
 Accesos
Links relacionados
-
 Citado por Google
 -
 Similares en
SciELO
 -
 Similares en Google
Compartir
DYNA
versión impresa ISSN 0012-7353
Dyna rev.fac.nac.minas vol.83 no.197 Medellín mayo/jun. 2016
https://doi.org/10.15446/dyna.v83n197.47010
DOI: http://dx.doi.org/10.15446/dyna.v83n197.47010
A new hardening rule to model the effect of density on soil behavior
Una nueva regla endurecimiento para modelar el efecto de la densidad en el comportamiento de los suelos
Márcio Muniz de Farias a, Robinson Andrés Giraldo-Zuluaga b & Teruo Nakai c
a Geotechnical Research Group, Department of Civil and Environmental Engineering, University of Brasilia, Brasilia, Brazil, muniz@unb.br
b Geotechnical Research Group, Department of Civil and Environmental Engineering, University of Brasilia, Brasilia, Brazil, roangizu@unb.br
c Nagoya Institute of Technology, Geo-Research Institute, Nagoya, Japan, nakai.teruo@nitech.ac.jp
Received: November 7th, 2014. Received in revised form: September 14th, 2015. Accepted: January 20th, 2016.
This work is licensed under a Creative Commons Attribution-NonCommercial-NoDerivatives 4.0 International License.
Abstract
The authors propose a new hardening rule for constitutive models based on the subloading concept. This concept allows a smooth transition between unloading and reloading. Most importantly it characterizes the soil with a single set of parameters regardless of its initial density state. The new rule aims to improve the original model proposed by the last author. The original version included a linear evolution rule for the sake of simplicity, but did not include any empirical evidence for such law. This new version proposes an exponential law that provides a better fit to the experimental data. This law requires only two parameters with a clear physical interpretation. These parameters can be obtained from simple one-dimensional compression tests. The model was based on controlled tests performed with glass spheres, but was applied to real granular and clay soils. The results show that the model can very successfully reproduce the behavior of real soils.
Keywords: yield condition, constitutive relations, elastic-plastic material, laboratory tests.
Resumen
Los autores proponen una nueva ley de endurecimiento para modelos constitutivos basados en el concepto subloading. Este concepto permite una transición suave entre la descarga y la recarga. Lo más importante es que caracteriza el suelo con un único grupo de parámetros, independientes de la densidad inicial. La nueva regla busca mejorar el modelo original propuesto por el último autor. La versión inicial incluía una regla de evolución lineal en aras de la simplicidad, sin incluir pruebas empíricas de dicha ley. Esta nueva versión propone una ley exponencial que se ajusta mejor los datos experimentales. Esta ley requiere sólo dos parámetros, con una interpretación física clara, obtenidos a partir de ensayos simples de compresión unidimensional. El modelo se basó en ensayos controlados con esferas de vidrio, sin embargo, fue aplicado a suelos granulares y arcillosos. Los resultados muestran que el modelo puede reproducir muy bien el comportamiento de suelos reales.
Palabras clave: condición de plastificación, relación constitutiva, material elastoplástico, ensayos de laboratorio.
1. Introduction
Constitutive models form a necessary set of equations in order to obtain analytical or numerical solutions for boundary value problems satisfying certain universal conservation laws at every point of a dominium, in the context of continuum mechanics. Contrary to the universal conservation laws, the constitutive models are dependent on the material type and should reflect its internal constitution by means of macroscopic parameters. The constitutive laws are, therefore, mathematical expressions that represent the views of researchers about how certain materials should behave, rather than the real behavior of the materials. Hence, the same set of experimental evidence may lead to many different and sometimes conflicting constitutive models depending on the general framework adopted (elastoplasticity, hyperelasticity, etc.) and on the particular views and background of the model proposer.
For the particular case of geomaterials, such as natural soils, an ever increasing number of models have been proposed. The development of these models generally follow two conflicting trends: some favor a more generalist approach trying to unify most materials and physical conditions under a single model; others consider that different models for each material and initial state conditions provide a simpler and more practical approach [1]. This latter view is shared by many practitioners who argue that the most adequate model should be employed in each case. This is a good point, but according to the authors of this paper, it is unfortunately, very common for geotechnical engineers to opt for over simplistic models that do not adequately represent the behavior of the materials involved in the analyses.
It is widely reported and accepted that the mechanical behavior of geomaterials is highly influenced by the initial conditions to which they are subjected. These initial conditions comprise both the stress level (confinement) and stress history (over-consolidation), as well as the initial physical indices (e.g. density) of the soil mass. Whereas the incorporation of the influence of the confinement level is quite straightforward in most constitutive models, the same does not happen with respect to the effect of stress history and most of all, the effects of the initial density and structure of the soil mass. Most models tend to bypass this problem by adopting different sets of parameters for different initial over-consolidation and density states, as if different materials were involved in the same analyses.
Nakai and Hinokio [2] proposed an original approach in which it was possible to incorporate the effects of both confinement and density into a reasonably simple constitutive model for three-dimensional loading conditions, using a single set of unified material parameters. Later, Nakai and collaborators working at Nagoya Institute of Technology proposed a theoretical scheme in which it was possible to take into consideration many other relevant variables which influence the mechanical and hydraulic behavior of soils and rocks [3,4]. The model in different stages can consider the effect of density (over-consolidation), structure (bonding), strain rate (creep), temperature and water content (suction).
The general framework summarizes years of research and is initially introduced in a very simple manner using only the effective stress versus void ratio relation, under one-dimensional compression condition. Later, the models are generalized for three-dimensional conditions by introducing the concept of a modified stress tensor called tij [5].
For the sake of simplicity and easy understanding of the theoretical background, only the one-dimensional condition is discussed in the present paper. The proposed formulation is compared initially with the experimental results obtained in laboratory by the authors, using very uniform glass beads in order to isolate other effects such as particle shape, structure and cementation. Finally, the model predictions are compared with experimental results for different types of real soils (cohesive and granular) published in the literature by other researchers.
2. Constitutive model
The model adopted in this paper uses a conceptual scheme based on isotropic strain-hardening elastoplasticity with the implicit introduction of the subloading concept proposed by Hashiguchi [6] and revised by Nakai and Hinokio [2]. Using this framework it is possible to account for several important variables that influence soil behavior, such as density, structure, deformation rate, temperature and suction [3-5,7-10].
The modeling conception is divided into two main sets of variables. The first set accounts for internal variables, such as density and bonding, which modify the shape of the void ratio versus the effective stress compressibility curve. The second set includes external variables (rate of deformation, temperature and water content) whose main effect is to shift the position of the normal consolidation line (NCL). This paper will focus only on the influence of density, but a full description of other variables may be found in the above references.
Nakai et al. [3] initially show how to formulate models under one-dimensional conditions and later extend the analyses to full three-dimensional cases [4]. The extension to generalized 3D conditions is achieved by: (a) introducing a modified stress tensor tij [11]; and (b) assuming a decomposition of the plastic strain increment [12]. These two features, respectively, are responsible for accounting for the influence of the intermediate principal stress and the influence of stress path on the behavior. Alternative approaches using conventional stress invariants p, q and q may be also effective, including applications to unsaturated soils [13].
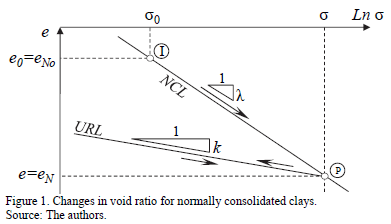
Here, the simpler version will be explained with reference to the well-known void ratio (e) versus natural logarithm of the one-dimensional effective stress (s) illustrated in Fig 1. For a normally consolidated material, the initial state is represented by point I (e0,s0)=(eN0,s0). Upon loading, the point follows a trajectory along the normal consolidation line (NCL), reaching a final point P (e, s)=(eN, s), with e = e0+d(-e) and s = s0+ds. The subscript "N" denotes a point over the NCL. The inclination of the virgin NCL is denoted by the (one-dimensional) compression index l, and the slope of the unloading-reloading line (URL) is given by the swelling index, k. Under these conditions, the change in plastic void ratio, from simple geometric relations in Fig. 1, is given by:

For the sake of simplicity, let F and H denote the terms related to (logarithmic) stress change and plastic void ratio change in Eq. (1), respectively, so that:

Then the yield function (f) can be written generically as follows:

The consistency condition upon loading (df=0) implies:

Eq. (6) could also be directly obtained from differentiation of Eq. (1), but all steps were used only to illustrate the approach adopted in Nakai et al. [3] and later extended to other internal variables. For normally consolidated soils, Eq. (6) represents the incremental hardening law which relates changes of an internal strain-like hardening variable, represented by the plastic void ratio d(-e)p, with changes of the internal stress-like hardening variable, given by so=s or the maximum stress previously applied to the soil (pre-consolidation stress). This is akin to most conventional models based of the critical state theory, such as the Cam clay model.
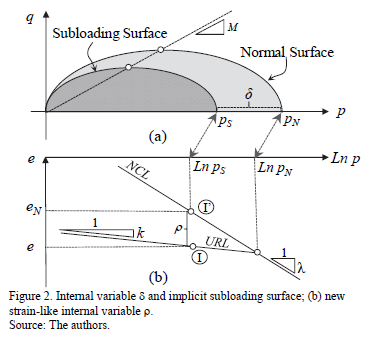
Now, a new (strain-like) internal hardening variable, denoted by r, is introduced to account for the influence of density or pre-consolidation of the soil into the model. Referring to Fig. 2-b, this variable simply represents the deviation between the actual void ratio (e) in the present over-consolidated state (point I) and the corresponding void ratio (eN) on the NCL for a normally consolidated soil under the same stress level (point I').
This new internal variable r is non-dimensional and represents a change in void ratio with respect to a reference normally consolidated state. This change may be due to pre-consolidation (single loading and unloading), but can also incorporate other effects such as cyclic loading. A null value for variable r means that the soil is normally consolidated and a high value of r denotes a very dense condition (much lower void ratio) with respect to the soil density if it were normally consolidated. So, variable r represents a densification effect due to pre-consolidation (and cyclic loading).
The relation between variable r and pre-consolidation can be better visualized using the p-q stress space of the Cam clay model as depicted in Fig. 2-a. Two yield surfaces are drawn: (i) the outer or "normal" surface whose "size", given by its intersection with the average stress axis (p), corresponds to the maximum or pre-consolidation stress (pN); (ii) the inner surface, called "subloading" surface, which always passes through the present stress state, and its size is denoted by (pS). The distance (d=pN-pS) between the two surfaces is a measure of pre-consolidation and can be related to the over-consolidation ratio (OCR= pN /pS), d*=*pS*(OCR-1). From Fig. 2, it is possible to establish the following relation between r and OCR [14]:

The use of two surfaces is the essence of modeling approaches such as subloading surface [6] and bounding surface [15], despite some basic differences in these approaches, especially regarding the influence of the confining pressure. While the inner surface tracks the present or actual stress state, the outer surface keeps a kind of memory of the loading history. The distance between the two surfaces can be measured by stress-like (d) or strain-like (r) internal hardening variables, which are interrelated. In either case, it is necessary to devise an evolution law for the hardening variable, giving rise to different models and interpretations.
The authors favor the use of the strain-like density variable r. It should be emphasized that the subloading concept was evoked here only for interpretation purposes and that the modeling approach does not require the explicit definition of two surfaces.
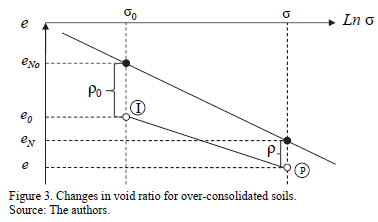
Fig. 3 illustrates the changes in void ratio for an over-consolidated soil loaded from the initial state at point I (eo,so) to a final state at point P (e,s), with e=eo+ D(-e) and s=so+Ds. The change of plastic void ratio (-De)p upon loading from so to s can be expressed as:

Hence the yield function can be written as:

and the consistency condition  applied to Eq. (9), requires that:

Variable r needs and evolution law (or hardening law). The research group of NIT suggested that its increment (dr) should be negative and proportional to the change of plastic void ratio , and also dependent on the present value of density r by means of an arbitrary increasing function, G(r). This can be expressed mathematically as follows:

Substituting the evolution law of Eq. (11) into Eq. (10), the change in plastic void ratio can be expressed as follows:

There are only two conditions established for function G(r): (i) it must be a monotonically increasing function of r and (ii) it should satisfy G(0)=0. The first condition assures that the value of variable r degrades faster for higher densities and the second condition assures that the evolution ceases when r =0, thus forcing the deformability curve to adhere to the NCL when the soil becomes normally consolidated. Following these conditions, Nakai et al. [8] suggested that linear (G(r)=ar) or quadratic rules (G(r)=ar2) could be adopted. The main argument for the adoption of these functions is their simplicity and the fact that just one parameter (a) is added to the model. This parameter controls the decay rate between the pre-consolidated and normally consolidated stress states.
The absolute value of G(r) can be interpreted as an increase in the volumetric plastic stiffness of the soil compared to the stiffness value that the soil would have if it were normally consolidated. This is easily achieved by expressing Eq. (12) in terms of volumetric strains (dividing by 1+eo) and inverting it:

The term between brackets in Eq. (13) corresponds to the bulk or volumetric plastic stiffness (Kp) and it coincides exactly with the expression obtained for the Cam clay model when G(r)=0 (if the one-dimensional stress s is substituted by the mean stress p), i.e., Kp=p(1+eo)/(l-k). The factor (1+G(r)) in Kp in Eq. (13) gives a scalar measure of this stiffness gain when the soil becomes over-consolidated [16]. This approach can be easily implemented in critical state based models for simulating geotechnical problems, mainly for applications where the soil undergoes severe densification, or in cases of cyclic loadings, including the simpler case of a single unloading-reloading cycle [17, 18, 19, 20].
3. Experimental program
The linear and quadratic hypotheses for the evolution function G(r) were proposed based solely on their simplicity. However, these proposed shapes for G(r) lack experimental backing, which is what is investigated in this paper. In order to check their validity, the authors devised a series of experimental tests with different initial void ratios (hence different initial values of ro) and tracked their evolution.
The tests were initially performed with artificial sand comprised of almost perfect microspheres of glass beads. The idea was to test a well-behaved material, thus avoiding other interferences such as particle shape, natural structure and cementation. The particle diameters (Dp) and sample diameter (Ds) were chosen so as to minimize scale effects (Ds/Dp>100). Conventional soil characterization tests, such as grain size distribution, density, minimum and maximum void ratios (emin and emax) etc., were performed with this material.
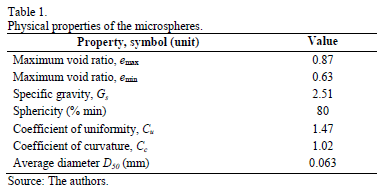
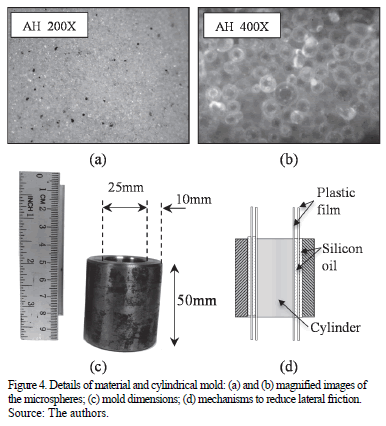
Table 1 summarizes the results of characterization tests on the glass beads. The package of microspheres can be classified as fine sand according to the ASTM standards. Photos of the glass beads amplified by 200x and 400x using an electronic magnifying glass (Digital USB Microscope) are shown Fig. 4 (a)-(b). The spherecity and uniformity of the microspheres can be appreciated in these photos.
Artificial soil samples were prepared by pouring the glass microspheres into a metallic cylinder with a diameter of 25 mm and a height of 50 mm (Fig. 4-c). The material was carefully placed in its loosest state and vibrated until the desired initial void radio was reached by trial and error. Samples starting with seven initial void ratio states, from emax down to close to emin, were prepared: eo= 0.87-0.85-0.81-0.79-0.77-0.76-0.72.
The wall of the metallic mold was 10 mm thick to avoid radial deformation and ensure the desired one-dimensional strain compression state. In order to minimize wall friction, the interior of the cylinder was coated with silicon oil and two layers of plastic film also coated with oil in between them, as illustrated in Fig. 4-d.
The compressibility curves were determined under one-dimensional constant strain rate (CSR). The main advantages of this methodology are related to speed and precision [21]. The test equipment comprised a load frame with a reaction beam, a moving load plate, and sensors for load and displacement (LVDT). The strain rate was fixed at 1 mm/min and the test was carried until a maximum vertical force of 40 kN, due to limitations of the reaction system. The corresponding maximum vertical stress, around 80000 kPa, was high enough to observe particle crushing in the cases of spheres with larger diameters (not reported here).
Besides the artificial sand prepared with microspheres of glass, the constitutive model was also verified against the results of CSR one-dimensional tests on real soils compiled from the literature. The main idea was to test the hypotheses that void ratio deviation from the NCL, variable r, provides an appropriate measure of density which controls the soil behavior irrespective of particle shape and nature (sand or clay). The tests include two sands and two clays for which CSR one-dimensional test results were available for different initial densities. A quartz sand was tested by Nakata et al. [22] and Ganga sand was tested by Rahim [23]. Tests performed with London clay and Cambridge clay were also used [24].
4. Methodology for the calibration of model parameters
The compression (l) and swelling (k) indices are quite easy to calibrate and may be obtained directly from the inclinations of straight lines fitted to the initial and final sections of the compressibility curve, respectively. The straight line fitting is best achieved using least square error minimization for selected ranges of experimental points in the initial and final sections of the e-ln(s) curve.
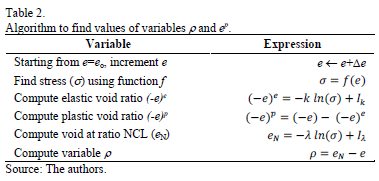
In order to find the actual evolution rule of the internal variable r, it is necessary to first determine the experimental values of G(r) versus r directly from the test results. The following methodological steps are proposed:
- Generate an adjusted curve fitting the experimental e-ln(s) data to obtain an expression for the stress s as a function of the void ratio, s=f(e). This can be achieved with a high order polynomial, a spline curve, or piecewise linear fittings. This curve is used only as an intermediate stage in order to recover the data for equally spaced void ratio intervals and avoid the ragged nature of the experimental data;
- For equally spaced points (De=constant) in the compressibility curve, obtain the elastic and plastic void ratios and the internal variable r following the steps of the algorithm described in Table 2;
- Compute the changes in variable r and the corresponding changes in plastic void ratio,
 and
and  , with respect to the previous values.
 - Following Eq. 11, determine the value of G(r) for each point of the compressibility curve as the ratio:

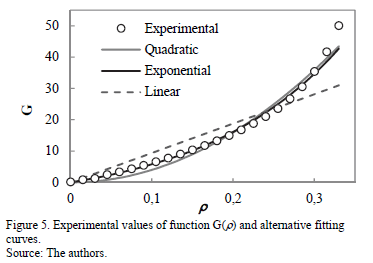
Following the steps described above, the authors were able to find the experimental relation for G(r) x r, depicted by the open dots in Fig. 5, for a particular test with the densest sample (eo=0.72). The experimental data, however, do not show the linear nor the quadratic trends proposed by Nakai et al. [8]. The same was observed for all tests performed by the authors.
It may be observed that the initial section of the data in Fig. 5 may be fitted with a straight line with a non-zero inclination, G(r)=ar. However if a straight line is fitted over the whole range of variable r, it will overestimate G(r) for low values of r and underestimate the function for high values of r. The initial non-zero inclination of the experimental data cannot be captured with a simple quadratic curve of the type G(r)=ar2, because its first derivative at the origin is zero. On the other hand, the experimental data show that the relation is clearly non-linear over the range of density tested, and that the inclination increases faster after a certain point. A hyperbolic function can meet these requirements [16] or maybe a quadratic function with two terms (G(r)=ar2+br), but this behavior can be better simulated with an exponential function, as follows:

in which a and b are material parameters. The derivative of Eq. (15) is  , and the parameter a mathematically represents the inclination when r=0, i.e., a=G'(0), while parameter b gives the rate of increase of this inclination which is related to the second derivative of G(r).
The proposed function is monotonically crescent, satisfies G(0)=0, and exhibits the trends of initial non-zero inclination and fast increase after a certain value. However, the exponential model requires two parameters (a and b) instead of just one (a) of the original linear or quadratic functions. Nevertheless, these parameters are easily calibrated with a simple procedure which starts by rewriting Eq. (15) as follows:

Eq. (16) represents a linear relation between an auxiliary variable c and r. The best fitting is obtained by varying the ratio a/b until a good linear correlation (R2@1.0) is obtained through the points (r,  ). The inclination of this straight line is parameter b, and the other parameter a follows directly from the product between b and the ratio a/b.
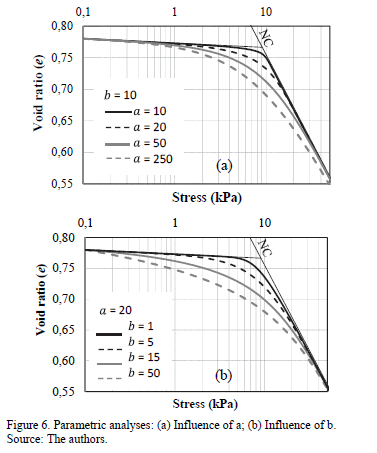
Fig. 6 shows the results of parametric analyses to highlight the influences of parameters a and b on the overall compressibility curve, e-ln(s). In these simulations, the initial void ratio was eo=0.78 for the stress so=0.1 kPa, and the conventional compressibility indices were l= 0.120 and k =0.03. From these analyses, it can be observed that parameters a and b control the adherence between the actual compressibility curve and the straight sections represented by the normal consolidation line (NCL) and unloading-reloading line (URL), respectively.
The influence of parameter a can be appreciated in Fig. 6-a, in which the value of b=10 was kept constant and the value of a varied between 10 and 250. The parametric analyses show that the compressibility curve joins the NCL faster (i.e., at higher values of void ratio, e) for lower values of parameter a. Parameter b, on the other hand, controls the adherence between the actual curve and the unloading-reloading line as illustrated in Fig. 6-b, where the value of a=20 was kept constant and the value of b varied between 1 and 50. Here it can be observed that the compressibility curve sticks to the URL section for lower values of b. In summary, low values of both a and b simulate a sharp bilinear transition as in the conventional Cam clay model.
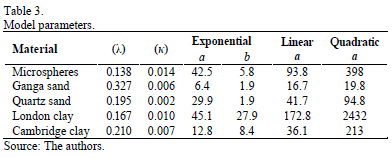
The experimental results obtained by the authors using microspheres as well as results from tests on real soils published in the literature were used to calibrate the parameters of the model (l, k, a and b) following the procedures described in the previous section. These parameters are summarized in Table 3.
The first observation during the calibration process was that the swelling ( ) was not exactly constant, but increased slightly for lower values of initial density of the sample (
 = 0.014 to 0.019). This is contrary to the basic assumption of conventional models, such as the Cam clay. In order to keep the model simple, this hypothesis was preserved and the values of these parameters were taken as the average for all the tests on a given material.
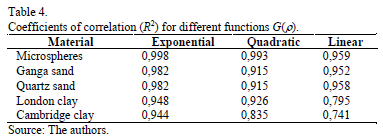
The parameters for the evolution function G(r) of the density variable were taken for the material at its densest state. The values parameters a (or a and b, for the exponential model) represent the best fit obtained by a least square error minimization process. The computed values of G(r) were compared with the experimental ones and the coefficients of correlation (R2) computed. These values are summarized in Table 4. The exponential model gave the best correlation for all materials, as expected. Compared with the linear model, the parabolic model yielded better correlations for natural clays, but slightly worse correlations for natural sands.
5. Model predictions and experimental results
A good fit of G(r) is important, but the crucial point is the correlation between the complete model simulations with the whole experimental compressibility curve, e-ln(s). These curves will be shown for all materials in this section, but a single case for the quartz sand is initially commented in more details.
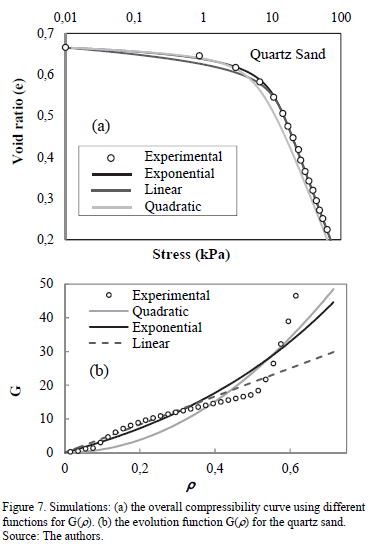
A comparison between experimental e-ln(s) data for the quartz sand and the simulations using three different functions for G(r) is shown in Fig. 7-a. With the exponential function for G(r), the overall simulation fitted the experimental data almost perfectly; while the linear function best fitted the last section of the curve (the NCL) and the quadratic function best fitted the initial section of the curve (the URL).
This result is explained when the actual values of G(r) are compared to their simulations using the linear, quadratic and exponential models, as shown in Fig. 7-b. For this quartz sand, the experimental values of G(r) showed a crescent but unexpected curved shape. This curve fitted reasonably well with a straight line for low values of r, hence the good overall agreement close to the NCL in Fig. 7-a for the model with a linear function for G(r). The opposite is observed with the quadratic function for G(r), which fits best for higher values of r, hence the good agreement close to the URL in the overall compressibility curve in Fig. 7-a.
The excellent agreement of the exponential model is due to its two parameters, one controlling the simulation in the URL range and the other in the NCL domain, as explained in the parametric analyses shown in the previous section. Therefore, this model will be used in all following simulations presented in this paper.
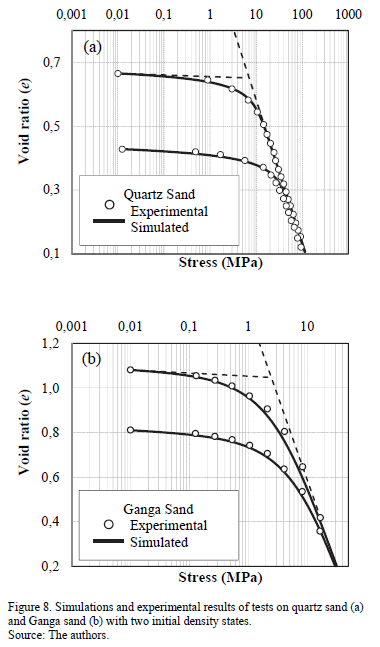
Next, further results of tests on some real soils described in the literature and the model simulations are described. Initially the results for quartz sand are completed by simulations with two initial densities, as shown in Fig. 8-a. The simulations can very successfully reproduce the compressibility curves over the whole domain. The same can be observed for the Ganga sand shown in Fig. 8-b.
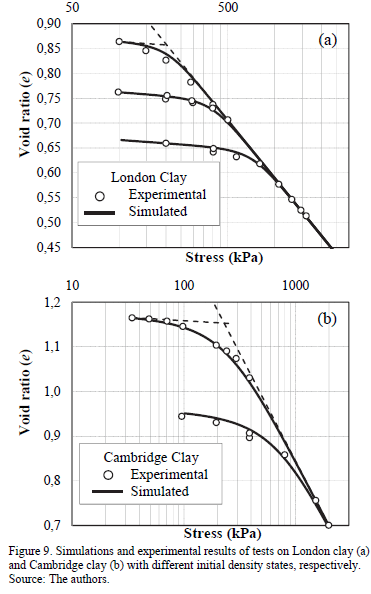
The experimental results and model simulations for London clay and Cambridge clay are shown in Fig. 9-a and Fig. 9-b, respectively. Three different initial conditions were available for London clay and two initial states for Cambridge clay. In both cases, the agreement between model simulations and experimental results was excellent for the entire range of stresses and densities analyzed.
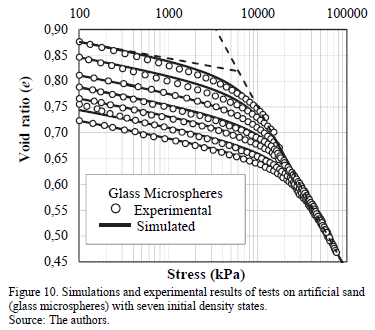
The results for all tests using microspheres and the model simulation with exponential function G(r) are shown in Fig. 10. For the average value of l=0.138 in Table 3, and a reference stress equivalent to the atmospheric pressure (so = satm= 100 kPa), the following values for the initial density variable were computed, ro=0.51-0.54-0.58-0.60-0.62-0.64-0.66. These values correspond to the whole range of void ratio values, between emin and emax presented previously. It is striking that the simulations can very successfully reproduce the compressibility curves over the whole domain for all range of initial density conditions with a single set of parameters.
In all the tests involving natural soils (sand and clay) and artificial sand (microspheres) a unique set of parameters was used for each material, regardless of the initial void ratio. Also, the reader can observe a smooth transition between the over-consolidated and normally consolidated states. This contrasts with the discontinuity in compressibility indices (l and k) postulated by the bilinear behavior assumed, for instance, in the Cam clay model. This sharp transition will be observed also in the simulation of conventional triaxial tests on over-consolidated soils.
The smoothness in compressibility is simulated by any model which implicitly or explicitly adopts the subloading concept. This smooth variation comes from the introduction of the scalar function G(r) which reproduces plastic strains for any loading condition, irrespective of the previous stress history, i.e., regardless of whether the soil is normally consolidated or over-consolidated. This can be easily implemented in many models and all it takes is the addition of a scalar, related to G(r), into the plastic multiplier of conventional elastoplastic models (see e.g. Pedroso et al.[14]).
6. Conclusions
This paper revises a simple and versatile model proposed by Nakai et al. [3] to simulate the stress versus void ratio curve of geomaterials under one-dimensional compression conditions, as in oedometer tests.
The model implicitly incorporates the subloading concept which results in a smooth transition between the over-consolidated and normally consolidated stress states. This is achieved by means of an internal strain-like hardening variable, r, which is at the same time a measure of the density and over-consolidation ratio. This variable needs an evolution rule controlled by a smooth monotonic crescent function G(r), for which the original model proposed a linear or a quadratic variation.
The above hypothesis was tested using the results of constant strain tests on artificial sand composed of glass microspheres and also tests on real soils (sand and clays) published in the literature. The authors proposed methodological steps to find the experimental values of G(r) and the results showed that a better description of this function is given by an exponential relation with two model parameters (a and b).
These two parameters are easily calibrated from a single one-dimensional compression test and they also have a clear meaning: parameter a controls the behavior in the normally consolidated range and parameter b controls the behavior in the over-consolidated domain.
The simpler linear and quadratic relations, although not as accurate as the exponential, also produce good simulations of the overall compressibility curve under one-dimensional conditions. This may be enough for most practical applications and they have the advantage of using a single parameter (a). The limited experimental evidence shown in this paper indicates that the linear model best fits the results obtained with natural sands, while the quadratic model best reproduces the behavior of natural clays.
Irrespective of the shape of G(r), the results support the use of the internal variable (r) as a powerful variable to incorporate density related effects on the stress-strain behavior of geomaterials, independently of grain shape or nature. The simulations could accurately reproduce the behavior of artificial glass microspheres, natural sands and clays, over a wide range of stress and void ratio conditions, using a single set of unified parameters.
In spite of presenting the formulation and experimental validation under one-dimensional compression conditions, the subloading concept described here can be easily incorporated in any model under general three-dimensional stress conditions. This has already been carried out by many others [4].
Acknowledments
The authors acknowledge the financial support of the Brazilian National Research Council (CNPq).
References
[1] Papamichos, E., Constitutive laws for geomaterials. Oil Gas Science and Technology, 54(6), pp. 759-771, 1999. DOI: 10.2516/ogst:1999064 [ Links ]
[2] Nakai, T. and Hinokio, M., A simple elastoplastic model for normally and over consolidated soils with unified material parameters. Soil and Foundation, 44(2), pp. 53-70, 2004. DOI: 10.3208/sandf.44.2_53 [ Links ]
[3] Nakai, T., Shahin, H., Kikumoto, M., Kyokawa, H., Zhang, F. and Farias, M.M., A simple and unified one-dimensional model to describe various characteristics of soils. Soil and Foundation, 51(6), pp. 1129-1148, 2011. DOI: 10.3208/sandf.51.1129 [ Links ]
[4] Nakai, T., Shahin, H., Kikumoto, M., Kyokawa, H., Zhang, F. and Farias, M.M., A simple and unified three-dimensional model to describe various characteristics of soils. Soil and Foundation, 51(6), pp. 1149-1168, 2011. DOI: 10.3208/sandf.51.1149 [ Links ]
[5] Nakai, T., Shahin, H.M., Kikumoto, M., Kyokawa, H. and Zhang F., Simple and unified method for describing various characteristics of geomaterials. Journal of Applied Mechanics JSCE, 19, pp. 371-382, 2009. (in Japanese). [ Links ]
[6] Hashiguchi, K., Constitutive equation of elastoplastic materials with elasto-plastic transition. Journal of Applied Mech. ASME, 102(2), pp. 266-272, 1980. DOI: 10.1115/1.3153653 [ Links ]
[7] Nakai, T., Description of elastoplastic behavior of soil as a one-dimensional model. Magazine of the Japanese Geotechnical Society, 56(9), pp. 6-9, 2008 (In Japanese). [ Links ]
[8] Nakai, T., Kyokawa, H., Kikumoto, M., Shahin, H.M. and Zhang, F., One-dimensional and three-dimensional descriptions of elastoplastic behavior in structured clays. Proc. of 4th International Workshop on New Frontiers in Computational Geotechnics, IWS-Pittsburgh, pp. 3-12, 2004. [ Links ]
[9] Shahin, H.M., Nakai, T., Kikumoto, M., Kyokawa, H. and Miyahara, Y., Modeling of time dependent behavior of clay in one-dimensional consolidation. Proc. of the 4th Sino-Japan Geotechnical Symposium, pp. 54-61, 2010. [ Links ]
[10] Kyokawa, H., Kikumoto, M., Nakai, T. and Shahin, H.M., Simple modeling of stress-strain relation for unsaturated soil. GeoShangai - International Conference, China, pp. 17-25, 2010. [ Links ]
[11] Nakai, T. and Mihara, Y., A new mechanical quantity for soils and its application to elastoplastic constitutive models. Soil and Foundation, 24(2), pp. 82-94, 1984. DOI: 10.3208/sandf1972.24.2_82 [ Links ]
[12] Nakai, T. and Matsuoka, H., A generalized elastoplastic constitutive model for clay in three-dimensional stresses. Soil and Foundation, 26(3), pp. 81-98, 1986. DOI: 10.3208/sandf1972.26.3_81 [ Links ]
[13] Pedroso, D.M. and Farias, M.M., Extended Barcelona basic model for unsaturated soils under cyclic loadings. Computers and Geotechnics, 38, pp. 731-740, 2011. DOI: 10.1016/j.compgeo.2011.02.004 [ Links ]
[14] Pedroso, D.M., Farias, M.M. and Nakai, T., An interpretation of subloading tij model in the context of conventional elastoplasticity theory. Soil and Foundation, 45(4), pp. 61-77, 2005. DOI: 10.3208/sandf.45.4_61 [ Links ]
[15] Dafalias, Y.F. and Popov, E.P., A model of nonlinearly hardening materials for complex loading. Acta Mechanica, 21, pp.173-192, 1975. [ Links ]
[16] Zuluaga, R.A.G. and Farias, M.M., Experimental validation of a simple model for soils. Proc. of VI Infogeo. Brazilian Symposium on Applications of Informatics to Geotechnics, Brasilia, V01, pp. 11-20, 2011. (In Portuguese). [ Links ]
[17] Farias, M.M., Moraes, A.H. and Assis, A.P., Displacement control in tunnels excavated by the NATM: 3-D numerical simulations. Tunnelling and Underground Space Technology, 19, pp. 282-293, 2004. DOI: 10.1016/j.tust.2003.11.006 [ Links ]
[18] Farias, M.M., Nakai. T., Shahin. H.M., Pedroso, D.M., Passos, P.G.O., Hinokio, M., Ground densification due to sand compaction piles. Soil and Foundation; 45(2), pp. 167-180, 2005. Doi: 10.3208/sandf.45.2_167 [ Links ]
[19] Nakai, T., Farias, M.M., Bastos, D. and Sato, Y., Simulation of conventional and inverted braced excavations using subloading tij model. Soil and Foundation; 47(3), pp. 597-612, 2007. DOI: 10.3208/sandf.47.597 [ Links ]
[20] Rebolledo, J.F.R., Auvinet-Guichard, G.Y., Martínez-Carvajal, H.E., Settlement analysis of friction piles in consolidating soft soils, DYNA, 82(192), pp. 211-220, 2015. DOI: 10.15446/dyna.v82n192.47752 [ Links ]
[21] Wissa, A.E.Z., Christian, J.T., Davis, E.H. and Heiburg, S., Consolidation at constant rate of strain. Journal of Soil Mechanics and Foundations Division, 10, pp. 1393-1409, 1971. [ Links ]
[22] Nakata, Y., Hyodo M., Hyde, A.F.L., Kato, Y. and Murata, H. Microscopic particle crushing of sand subjected to high pressure one-dimensional compression. Soils and Foundations; 41(1), pp. 69-82, 2001. DOI: 10.3208/sandf.41.69 [ Links ]
[23] Rahim, A., Effect of morphology and mineralogy on compressibility of sands. PhD thesis, Indian Institute of Technology Kanpur, Kanpur, India, 1989. [ Links ]
[24] Butterfield, R. and Baligh, F., A new evaluation of loading cycles in an oedometer. Geotechnique; 46(3), pp. 547-553, 1996. DOI: 10.1680/geot.1996.46.3.547 [ Links ]
M. Muniz de Farias, completed his BSc. in Civil Engineering in 1983 at the Federal University of Ceará, Brazil, his MSc. degree in Geotechnics in 1986, at the Pontifical Catholic University of Rio de Janeiro, Brazil, and his PhD. degree in Numerical Methods in 1993, at the University of Wales, Swansea. He spent his post-doctoral sabbatical at Nagoya Institute of Technology - NIT, Japan in 1998, Japan. He has been working at the University of Brasilia (UnB) since 1986, and is a researcher for the Brazilian National Council for Scientific and Technological Development (CNPq). He has major teaching and research experience in the fields of Geotechnics and Pavements, and his main research interests include numerical and constitutive modeling applied to dams, tunnels and mechanistic pavement design. ORCID: 0000-0002-5257-911X
R.A.G. Zuluaga, completed his BSc. in Civil Engineering in 2008 at the Faculty of Mines of the National University of Colombia, Medellín, Colombia, and his MSc. degree in Geotechnics in 2011, at the University of Brasília, Brazil. Currently, he is a doctoral student in Geotechnics at the University of Brasília, Brazil. His research interests include the behavior of geomaterials, constitutive modeling and micromechanics. ORCID.ORG/0000-0001-6674-1977
T. Nakai, completed his BSc. and MSc. degrees in Civil Engineering in 1972 and 1974, respectively at Kyoto University, and the Dr. of Engineering degree in 1981 at Kyoto University, Japan. He became a professor of civil engineering at the Nagoya Institute of Technology in 1991. His research interests include, (a) laboratory testing of geomaterials and their constitutive modeling in general stress systems, (b) the application of the constitutive model to boundary value problems such as tunneling, braced excavation, bearing capacity of foundations, reinforced soils and other soil-structure interaction problems, and the corresponding model tests. He was awarded the prize for active young researcher in 1982, the prize for excelling research papers in 1991, and the prize for best papers in 2005, from the Japanese Geotechnical Society. ORCID: 0000-0002-1346-3560


