


 English (pdf)
 Article in xml format
 Article references
 Send this article by e-mail
 Cited by SciELO
  Cited by Google
  Similars in
SciELO
Similars in
SciELO  Similars in Google
 Permalink
1. Introduction
Power transformer management aims to obtain maximum profit whilst ensuring normal operation with acceptable risks [1]. Asset management involves several actions that can be taken during the life cycle of a transformer. The asset manager is responsible for deciding which ones of these actions are optimal. In fact, the manager has to answer questions such as: where and when an action must take place, which action is the best for each asset of the fleet, and what are the costs and the consequences of each action, etc. Actions that are decided upon must be provided with, for as long as possible, the largest amount of suitable information that aims to answer the above questions [2],[3].
In this context, risk assessment is a powerful and mandatory tool if an electric power company, for example, is seeking to implement a holistic asset-management system, including its power transformer fleet. This is because risk is a measure that integrates several pieces of information regarding condition, probability of failure, and the importance of a transformer in a power system. Therefore, an adequate calculation and interpretation of this measure is required to support the decision-making process.
It should be noted that evaluation of the power transformer’s condition is necessary to undertake risk assessment, but it is also necessary to schedule maintenance, especially when the company has adopted a scheme of reliability-based maintenance (RBM) and/or condition-based maintenance (CBM) [4].
In general, there are different test techniques that can be used for condition monitoring. There are also various methodologies to combine monitoring results in order to obtain a diagnosis. Thus, one of the main tasks for condition diagnosis consists of selecting the best-suited technique in terms of required input data, which is commonly acquired by power utilities.
Furthermore, as the scope of this paper is related to transformer risk assessment, the importance of each unit in a fleet must also be evaluated. In terms of this, there are a few reported methodologies in current literature. There are two different methods that are presently employed, one by an insurance company [5] and another by a U.S. power utility company [6]. This paper presents and analyzes these two methods. Additionally, analysis by risk matrices is introduced and the use of clustering techniques is proposed in order to support the decision-making process. The approach presented in this paper has been tested on a fleet of fourteen power transformers that are currently operational. Finally, the results obtained are discussed and some conclusions are presented.
2. Power transformer risk assessment
A useful approach to manage a family of power transformers is to use the ranking method, which is based on risk. The International Organization for Standardization (ISO) defines risk as the likelihood of an adverse event and its consequences.
Therefore, in order to perform a ranking, it is necessary to estimate the Transformer Risk Index (TRI). TRI has been formally defined in several references, such as in [2,3,5,6]. While [2,3] lists the main criteria, i.e., pieces of information necessary to estimate TRI, [5,6] proposes practical approaches to combine these criteria. These approaches are based on weighted factor scoring models and will be described in subsequent sections.
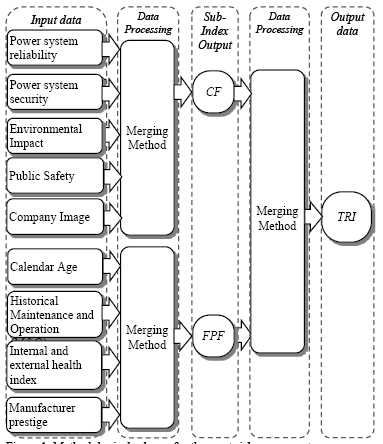
TRI assessment is not an easy task since it does not only depend on unit data but also on the technical and economic characteristics of the power system where the transformer is installed. TRI is based on two components: 1) the Failure Probability Factor (FPF), which essentially depends on transformer unit condition (e.g., health condition), its calendar age, its effective age (estimated through operating history and operating environment), etc.; and 2) the Consequence Factor (CF), which relies on the fact that every transformer will reach a point of final failure, and the consequences of such a failure may be reasonably estimated.
Fig. 1 presents a methodological scheme for TRI assessment. It can be observed that input data presented in the first column in Fig. 1, correspond with those common criteria reported in Tables 1 and 4. These will be presented in the following sections.
Once CF and FPF have been estimated for each of the fleet’s transformer, there are two possibilities for the TRI analysis. One possibility is to multiply both variables, CF and FPF, the result being a nonlinear function. With the product obtained, i.e., the TRI value, a ranking of the units can be completed. The other possibility is to construct a risk matrix, as is shown in Fig. 2.

A risk matrix is useful for preliminary screening of the risk, especially when probabilities and consequences have been estimated in a qualitative manner. This is usually the case in management of power transformers. The idea of a risk matrix is simple: the probability dimension of a risk is envisioned as a continuum from 0 to 1. This continuum is broken into categories such as improbable, remote, occasional, and frequent. Likewise, examples of consequence categories are: negligible, marginal, critical, and catastrophic. The risk matrix has a fundamental subjectivity that suggests it should be used with caution and constructed with ratings supported by evidence, [7,8].
For instance, in the risk matrix shown in Fig. 2, sets of transformers belonging to a similar risk area have been identified, e.g., by using a clustering technique (in this paper, the well-known K-means technique will be applied to the case study). In fact, transformers in Set A represent the units with higher risk; therefore, actions to be considered about these transformers are quite similar, and priority must be given to this set.
The situations for the other risk sets are different. In particular, transformer units in Set B are either aged or have a deteriorated condition, but the impact in case of a final failure is lower than for the units in Set A. In this case, possible decisions could be: relocating, or refurbishing the units whenever possible.
On the other hand, units in set C are in good condition, but a failure may have expensive consequences. Therefore, the decision regarding this set may be, for example, to install a parallel unit or to acquire spare transformers that can be rapidly connected to the buses in the power system where the critical units are operating.
3. Failure probability factor estimation
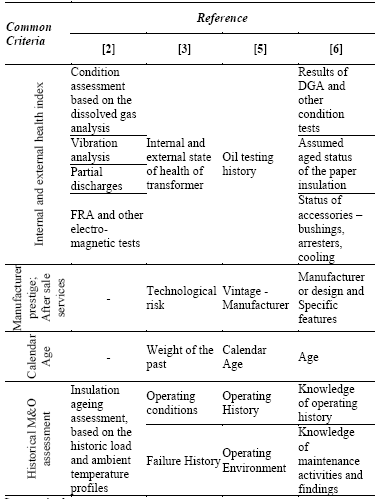
In order to evaluate the FPF sub-index, the main factors identified in references [2,3,5,6] are organized in Table 1 for the purpose of highlighting common criteria.
Although criteria for FPF calculation vary between references, some are similar or correlated. We can see that Table 1 identifies four common criteria (or four sets of aspects to be considered). These are: 1) The internal and external health index: this results from oil analysis and other diagnostic techniques that are useful to assess unit condition; 2) Manufacturer prestige: after-sales service, transformer technology, suitability for repair if a failure occurs, etc. are useful criteria to take into consideration; 3) Calendar age: this is an indirect indicator of the state of the unit and the risk of failure; and 4) Historical analysis of maintenance and findings: this must be performed by using the available data regarding the operation history of the unit, moreover this criteria could include the failure history.
In the following sub-sections, the two practical proposals given in references [5,6] will be presented. Then, a method to estimate the internal health index will be introduced.
3.1. Proposed approach by Bartley for FPF calculation
As was mentioned above, this proposal is based on a weighted factor scoring model. Six input issues are defined and reported in Table 2, which are then multiplied together to obtain FPF, in fact: FPF= Issue 1 x Issue 2 x … x Issue 6. In Table 2, a factor equal to 1.0 is favorable, and a factor equal to 1.5 is unfavorable.
3.2. Proposed approach by the National Grid to calculate FPF
In reference [6], the North American Utility National Grid presents a method based on risk assessment, which uses a combination of condition and criticality in order to make replacement decisions about their power transformers. This proposal is also based on a weighted factor scoring model, but the formulation differs from the previous one. Specifically, to calculate FPF, in this approach two criteria (condition assessment and age of the unit) are defined and valuated, as shown in Table 3.

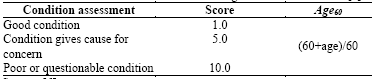
The overall condition results from the product between the condition assessment (which is obtained from subject matter experts, SMEs) and a penalization factor due to the calendar age of the unit. This is computed using the expression in Table 3. Such a penalization uses 60 years as a reference. Employing this methodology, the minimum value of FPF is equal to 1.0 for a new transformer in a good condition, and, for example, FPF reaches a value of 15 for a 30 year-old unit with a poor or questionable condition.
3.3. Health index calculation based on fuzzy logic
To estimate FPF, in Fig. 1, one of the inputs is the health index. A health index is a useful tool to combine information obtained from some diagnostic techniques applied on transformer, in order to provide a single quantitative index that represents its overall health. This indicator should consider two aspects: an internal and an external state of health. A value of zero for the health index is used for a transformer in excellent condition, and a value of one is used for a transformer in a very poor condition.
Although there are many diagnostic techniques for power transformers, it is not easy to integrate all the results into a single value. A method based on fuzzy logic to compute the health index was proposed recently in [9]. Since the method uses input data normally collected by power utilities, and it was successfully validated, this method was selected for TRI calculation by the authors of this article.
Two important reasons to use fuzzy-logic techniques for health index calculation are: 1) it allows for the uncertainties involved in the transformer tests to be incorporated in the calculation; and 2) the numerical thresholds, i.e., the limit values, for many of the diagnostic tests cannot be precisely found.
In [9], six fuzzy variables related to physicochemical tests, which are normally undertaken to dielectric oil, are defined as inputs for a fuzzy inference system. These variables are: water content, acidity, breakdown strength, dissipation factor, total dissolved combustible gases, and 2-Furfuraldehyde content. The membership functions for each variable are based on reported values given by standards, the relevant literature, and expert knowledge. Thirty-three inference rules are defined to map input values into one output that represents the health index.
The authors did not provide a single health index that represents the overall health of a transformer, i.e., only a health index of the insulation system is determined. Despite this, the method is effective in terms of the combination of tests for oil-analysis to obtain a diagnosis of the condition of the oil-paper system. This is one of the most critical power transformer subsystems. Consequently, a brief description of the six measured parameters that are used for health index calculation in [9] will be presented [10-15].
3.3.1. Dissolved gas analysis in oil, DGA
DGA is a well-known technique, which has been developed to monitor gas formation and its evolution due to internal chemical reactions that take place inside the transformer. Analyzing the levels of a variety of dissolved combustible gases in oil also allows electrical discharges, arcing, and thermal activity to be identified within the transformer. In order to use DGA to assess the overall health of the insulating system, levels of the dissolved combustible gases can be totaled into one value, the total dissolve combustible gases (TDCG).
3.3.2. 2-Furfuraldehyde content
The main reasons for the growth of 2-Furfuraldehyde content in transformer oil are: moisture content in solid insulation and internal winding temperature. The amount of furans correlates with the Degree of Polymerization (DP) of the solid insulation. DP is one of the main indicators of the health of the solid insulation, which, in turn, is the primary reason that a transformer reaches the end of its life.
3.3.3. Breakdown voltage, BDV
BDV of the insulating oil is a measure of its ability to withstand voltage stresses and is one of the most reliable measures of the overall condition of the oil. A lower than normal BDV may cause increased partial discharges that accelerate the aging of transformers.
3.3.4. Water content
Water content in transformer oil has well-known effects on the health of a transformer, such as acceleration of the rate of aging, reduction in the dielectric strength at high percentages of saturation in the oil, and problems caused by bubbling at high temperatures. Water content also reflects, to some extent, the condition of the paper insulation.
3.3.5. Neutralization Number, NN
NN, is a measure of the total acidity of the transformer oil. High acidity levels indicate that the oil is being oxidized. Total acidity increases continuously with extended service periods of the transformer oil. Deterioration of the paper insulation also increases the oil acidity.
3.3.6. Dissipation factor, DF
DF is a direct measure of the dielectric losses and it increases with deterioration of the oil. Moisture, oil oxidation, and/or contamination can produce a high DF. Dissipated power is transferred to the transformer oil in the form of heat energy, which increases the overall temperature of the transformer and accelerates its aging process.
4. Method for consequence factor, CF , calculation
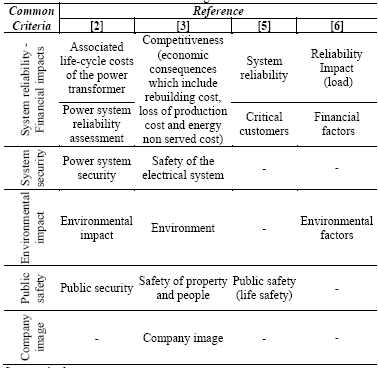
CF relies on the fact that every transformer will reach a final failure point, and the consequences of such failure may be estimated. Post-failure consequences are different for each transformer, and they usually depend on the unit location in the power system as well as other characteristics. Table 4 organizes the main criteria that are considered in references [2,3,5,6] for CF calculation.
Two practical approaches to assess CF are introduced in the following subsections.
4.1. Bartley’s proposed approach for CF assessing
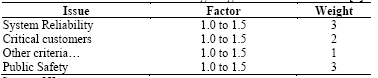
In the approach proposed in [5], CF is assessed by using scores ranging between 1.0 and 1.5 that are affected by its respective weigh in agreement with Table 5.
4.2. National Grid’s proposed approach for CF assessing
In the approach proposed in [6], the transformer impact, which is related with CF, is computed based on Table 6.
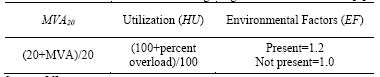
In Table 6, MVA is the nameplate power of the unit. The MVA20 score is the resultant value when each transformer of the fleet is referenced with respect to a typical distribution unit of 20 MVA. Thus, larger units are considered more critical for utility that owns the fleet. HU refers to a Highly Utilized transformer that operates at 100% or more of its rated power. Finally, environmental factors include the assessment of possible oil spills, thus, a score of 1.2 is assigned if this risk exists.
5. Case study
5.1. Description of the transformer fleet
A fleet of fourteen power transformers, which are currently operational in the Colombian power system, was selected in order to apply some of the presented methodologies to calculate risk. Table 7 shows the main technical features of the units under study.
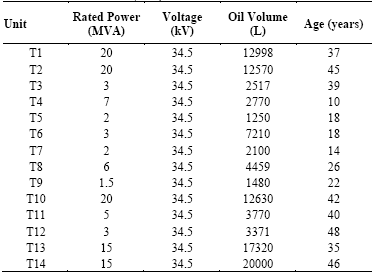
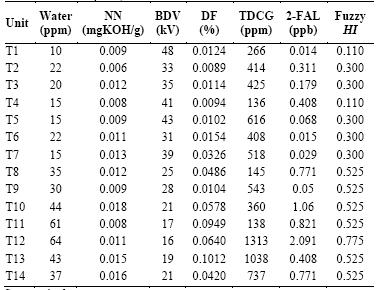
Table 8 presents the results of tests that assess the oil quality, which were performed on the fourteen power transformers. The last column reports the health index values that were obtained when applying the fuzzy method in [9].
5.2. Risk assessment
To undertake the risk assessment in the case study, the practical methodologies proposed in references [5,6] are applied. Some special considerations are necessary in order to compute risk with the available information. These are described on a case-by-case basis in the following subsections.
5.2.1. Risk calculation using Bartley’s proposal
Based on the available data, only two criteria from Table 2 were considered for FPF calculation: Oil Testing History, OTH, and Calendar Age, CAge . The obtained fuzzy HI in Table 8 were considered in order to assign a score to the criterion for OTH. A factor of 1.0 was given when HI = 0, and a factor of 1.5 was given when HI=1.0. A linear approach was applied by using these two points to calculate the OTH for all 14 units. The weight for this criterion is 2, which is in agreement with Table 2. The transformer's hazard rate related with CAge was valuated and scaled between 1 and 1.5, according to [3]. The weight for this criterion is also 2.
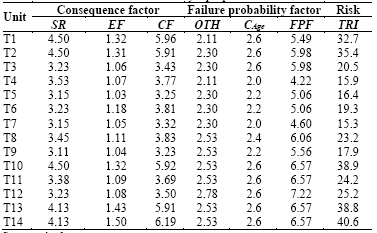
CF calculation used a System Reliability criterion (SR) that is related to the interrupted power in case of transformer failure, and another criterion associated with the environmental factor, EF (i.e., risk of oil spilling). For SR, a factor of 1.5 was assigned to the larger unit within the fleet, i.e., 20 MVA, and a factor of 1.0 was assigned if risk of power interruption did not exist. A linear approach was also applied between these points. The weight of this criterion is as reported in Table 5. For EF calculation, a similar procedure was performed; however, the oil capacity of each transformer was used. A factor of 1.5 was assigned to unit 14, which had 20000 L of oil. The factor was 1.0 if there was no risk. Table 9 reports the calculated values.
5.2.2. Risk calculation through the National Grid proposal
In this case, CF is assessed with MVA20 and EF factors (Table 6). A value between 1 and 1.2 was assigned to EF based on transformer oil capacity.
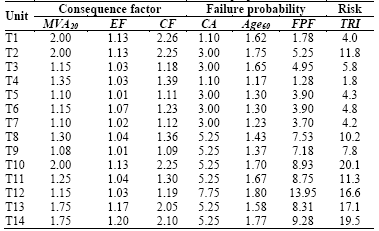
Regarding FPF, Condition Assessment (CA) was obtained from HI calculation, but it was multiplied by 10 in order to achieve a similar range to that considered in Table 3. The reported equation in Table 3 to compute the Age60 factor was used to consider the transformer age. The results obtained are reported in Table 10.
5.3. Discussion
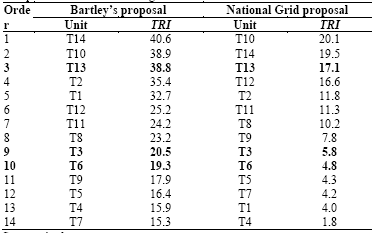
Table 11 presents a ranking of the assessed units based on the estimated risk using both analyzed methods.
As can be noted, the order of the units varies depending on the adopted method. In fact, only units T3, T6, and T13 were placed in the same position in both cases. Moreover, there are units with very similar TRI results, and therefore, their position is close in both rankings, e.g., units T10 and T14. However, for some units, the differences are important. For instance, the most extreme case is for unit T1 because when the Bartley method is applied, it occupies fifth position in the ranking. However, when the National Grid proposal is applied, the same unit occupies thirteenth place.
The main reason for this situation is the weight of the calendar age in the FPF calculation that was considered by each method. In the Bartley method, a greater weight is given to the calendar age criterion than for the National Grid proposal. In particular, in the Bartley method, the weight for the calendar age is equal to that assigned to the oil testing results, i.e., 2. Conversely, in the National Grid method, for a 60 year-old transformer that is in very poor condition, the calendar age factor is 2 and the condition assessment factor can take a value equal to 10. This means that, in this specific case, it is five times more important than the calendar age criteria.
In conclusion, special care must be taken when decisions are made using a determinate ranking method.
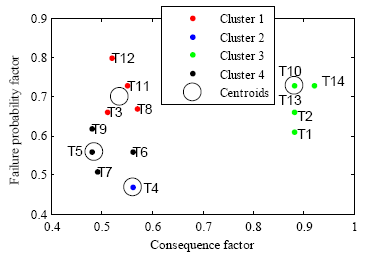
Moreover, two risk matrices were plotted in Figs. 3 and 4 using the results obtained. It must be noted that the results reported in Tables 9 and 10 for CF and FPF were normalized in order to consistently apply the well-known K-means clustering technique. Additionally, this normalization allows both matrices to be compared. Normalization was undertaken by using the maximum values that CF and FPF can reach in each methodology. That is, in the Bartley method, CF has a maximum value of 6.75 (SR∙EF=4.5∙1.5) and FPF a value of 9 (OTH∙ CAge =3∙3); in the national grid method, the maximum values are 2.4 ( MVA20 ∙EF=2∙1.2) for CF and 20 (CA∙ Age60 =10∙2) for FPF. The transformer used as reference was a 20 MVA unit, with a calendar age of 60 years.
The clustering technique was applied to a group of transformers in sets of similar risk. For each matrix, four clusters were obtained. In both cases, cluster 1 corresponds to transformers with lower consequences in the case of final failure. However, these have a poor condition in comparison with the rest of the fleet. In this set, unit T12 exhibits the worst condition, i.e., the health index for this unit is 0.755, and the calendar age is 48 years.
Similarly, in both matrices, cluster 3 corresponds to those units that have a higher risk within the fleet, i.e., considerable consequences and poor condition. However, in the case analyzed with the National Grid’s proposal, an additional set was assigned to units T1 and T2, and labeled as cluster 4. In particular, units T1 and T2 present considerable consequences in case of failure because these are two of the biggest units in the fleet (20 MVA). However, they have a better condition regarding other important units: such is the case for transformers 10, 13 and 14.
The other two clusters are different for each matrix. For example, in Bartley’s proposal case, sets 2 and 4 were identified for units with low risk, i.e., low FPF and CF. In particular, it was noted that cluster 2 is exclusively for unit T4, which is the youngest transformer in the fleet and has a good health condition.
The main conclusion of this case study is that risk analysis, by using risk matrices and clustering techniques, can effectively support the decision-making process and can complement the analysis that is only performed by rankings. In particular, risk matrices, obtained after results were normalized, show higher consistency between each other; therefore, normalization could be considered to be a good practice. This is true especially because decisions will be similar, independently of the risk matrix used, i.e., matrix in Fig. 3 or Fig. 4.
Transformer units grouped in cluster 1 in both matrices are the same except for units T3 and T9. However, T3 is the lowest-risk transformer in cluster 1 in Fig. 3, and the riskiest unit in cluster 2 in Fig. 4. A similar conclusion can be derived for unit T9. Therefore, decisions adopted for these two units can be the same. Moreover, for the riskier units in cluster 1, in both Fig. 3 and 4 (i.e., T8, T11, and T12) the action to be performed could be relocation in order to unload these transformers, or to refurbish these units, whenever possible.
Source: Authors
Figure 3 Risk matrix for the fleet of 14 power transformers: obtained using the Bartley method
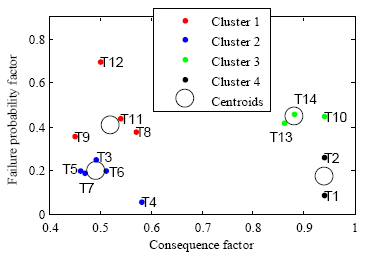
Source: Authors
Figure 4 Risk matrix for the fleet of 14 power transformers: obtained using the National Grid method
Furthermore, transformer units T1 and T2 are in a good condition, but a failure may have expensive consequences; this can be easily concluded from a simple inspection of Figs. 3 and 4. Thus, the decision regarding these transformers might be to increase the frequency of the time-based maintenance. Finally, for the most risky units of the fleet, i.e., T10, T13, and T14, the decision could be to implement a system for continuous condition monitoring and even to acquire spare transformers that can be rapidly connected to the buses in which these units are in operation.
6. Conclusions
This work has focused on the formulation of a practical method to undertake risk assessment of a power transformer fleet. In order to do this, the main criteria to compute risk were identified and described. For FPF calculation these are: internal and external health index, manufacturer prestige, after sales services, calendar age, and historical maintenance and operation assessment. For CF calculation these are: company image, public safety, environmental impact and power system security.
Two ways to conduct the risk assessment were presented. These are: 1) the ranking method, which consists of ordering the units of the fleet in agreement with the TRI obtained (achieved by multiplying the CF and FPF) for each unit; and 2) by risk matrices.
This paper’s main contributions are: 1) the inclusion of an advanced technique for transformer health valuation into the practical methods for transformer risk estimation; 2) the introduction of the K-means clustering technique in order to analyze the risk matrices after CF and FPF calculation and normalization; and 3) a robust and practical methodology to perform transformer risk analysis.
We conducted a case study using a fourteen-transformer fleet. A risk assessment was undertaken for the fleet, and some of the main criteria identified for risk valuation were considered. Results show that just applying a ranking analysis could lead to different decisions being made, depending on the adopted method of analysis; this is because the weight given to the criteria varies between methodologies. We observed that for analysis performed over risk matrices and using the proposed clustering technique, both practical methods to estimate CF and FPF could lead to similar decision-making. This means that there is a loss of valuable information when the decision-making process is only based on TRI. This finding indicates that the use of risk matrices is advisable when a power utility wants to perform transformer management based on risk analysis. For instance, if a fleet’s transformers are grouped in clusters, specific actions such as relocation, unloading, refurbishing, maintaining, monitoring, etc., can be decided on depending on the risk level for each cluster. Thus, this clusterization may be a useful tool to improve the financial resource assignment of these electrical assets.
In addition, in the case study we analyzed, only four criteria of the above listed were considered due to the lack of real data. Therefore, we also recommend that the asset manager performs the risk assessment by considering all criteria listed in Fig. 1, as well as Tables 1 and 2. As such, we observed that more information (good information) means less uncertainty for the decision-making process.
Finally, we observed that practical methodologies for CF and FPF valuation are sensible, in terms of the weight given to each criterion by the experts. Therefore, future research may be conducted to develop expert systems, e.g., a fuzzy inference system, similar to the one employed to estimate the transformer health index, in order to compute both CF and FPF. Such expert system should consider findings reported in state-of-the-art, recommendations given by standards, appropriate expert-based professional judgment, utility experiences, among others, to suitably implement the membership functions, the fuzzy rule-bases, and the adequate defuzzification method.

