Inglês (pdf)
 Artigo em XML
 Referências do artigo
 Enviar este artigo por email
 Citado por SciELO
  Citado por Google
  Similares em
SciELO
Similares em
SciELO  Similares em Google
 Permalink
1. Introduction
Reinforced concrete is a composite material created by the mixture of cement, stone aggregates, water, and steel reinforcement. This construction material is used in a wide range of applications for building structures of any kind due to its versatility and relatively low cost. Without reinforcement, building modern concrete structures would not be possible, since concrete has a high compression strength but also a low tensile strength. Steel reinforcement bars are added to support tensile stress that concrete cannot resist.
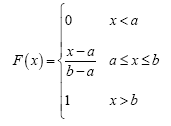
Reinforced concrete has been studied mostly through laboratory experiments due to its complex behavior. Several experiments and analytical studies have been carried out by Kent and Park [3]; Mander et al. [4]; Song and Lu [5]; Yi et al. [6] among many others. These studies have shown that the presence of transverse reinforcement confines the concrete core and improves concrete performance, making a more ductile structural element and increasing the compressive strength as shown in Fig. 1.
Beams are structural elements that mainly resist bending and shear forces. There are many studies to estimate bending behavior including shear interaction such as the ones conducted by Vecchio & Collins [8,9], Ichinose [10], Priestley & Calvi [11], Priestley et al. [12], Hamutçuoğlu & Scott [13], Xu and Zhang [14], etc.
On the other hand, large research efforts have been devoted to estimating the seismic vulnerability of irregular structures with respect to torsionally balanced buildings, some of them are summarized by De-Stefano & Pintucchi [15]. More recently, mass, stiffness, and strength discontinuities have been investigated separately to obtain a clear estimate of their effects on the structural behavior, like those performed by Valmundsson & Nau [16], Chintanapakdee & Chopra [17], De-Stefano et al. [18], Guner & Vecchio [19,20], Reyes & Chopra [21,22], Magliulo et al. [23] among many others. The abovementioned studies have reported that among mass, stiffness, and strength irregularities, the latter lead to larger increments in plastic demands compared with regular structures. Nevertheless, in most works, overstrength is evaluated as the ratio of available strength to estimated demand, without taking into account the variability of material properties, using only the nominal values of material properties to compute the available strength. Therefore, the assessment of the actual overstrength in a structural element is an important issue because if the overstrength is highly dispersed it may lead to unexpected ductility demands.
Concrete structural elements subjected to bending are designed in accordance with building code requirements without considering confinement effects or shear interactions. NTC-04 [1] and ACI 318-11 [2] building codes, which are commonly used in Mexico, use basically the same simplifying assumptions to determine the bending strength of reinforced concrete elements, which are:
The distribution of strains on the cross section are linear
Stress distribution in the concrete compression zone is known, and can be computed by an equivalent rectangular stress block
There are no relative shifts among steel reinforcement and the surrounding concrete.
The structural element reaches its bending strength at an ultimate concrete strain ε cu = 0.003
Steel reinforcement has an elastic-plastic behavior
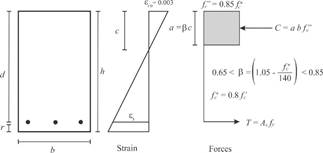
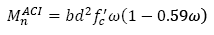
Fig. 2 summarizes some simplifying key hypotheses established by NTC-04 code for rectangular sections. Computing force equilibrium conditions, the nominal bending strength  can be obtained from eq. (1).
Source: Adapted from [7].
Figure 1 Load-strain relationships for concrete square prisms with different transverse reinforcement.
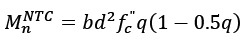 (1)
(1)
where:
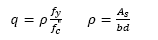
Eq. (1) b denotes the beam width, 𝑑 the distance from the reinforcement centroid to the extreme compression fiber, A s is the steel reinforcement area, ƒ v is the steel yielding stress, and ƒ c ” is the stress magnitude on the equivalent stress block, as shown in Fig. 2.
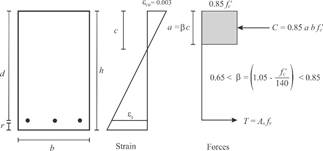
Analogously, Fig. 3 shows some basic hypotheses used by the ACI 318-11 code for rectangular sections, and considering force equilibrium conditions, the nominal moment strength  can be estimated from Eq. (2).
 (2)
(2)
where:
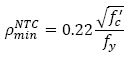
Eqs. (1) and (2) are only valid when steel reinforcement yields, which may lead to ductile failure. According to NTC-04, steel yields without brittle failure providing a steel ratio 𝜌 between the limits 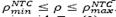 . The NTC-04 defines the minimum steel ratio with Eq. (3), and the maximum steel ratio
  as 0.9
  for elements that do not resist seismic forces and 0.75 for elements that resist seismic forces.
 (3)
(3)
The balanced steel ratio 𝜌 𝑏 corresponds to the case when concrete and steel reinforcement reach their ultimate strain ε cu 0.003 and yield stress (ƒ s = ƒ v ) at the same time respectively. In NTC-04, the balanced steel ratio is evaluated from Eq. (4).
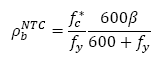 (4)
(4)
where β is a factor that adjusts the depth of the equivalent stress block respect to ƒ c * that represents the “effective” concrete compressive strength, which are calculated according to the equations shown in Fig. 2.
Analogously, the ACI 318-11 code defines a minimum steel ratio according to Eq. (5), and to ensure that not too much steel reinforcement is provided, steel strain ε s shall not be less than 0.004. This limit corresponds to a slightly lower steel ratio specified in the NTC-04 code.
 (5)
(5)
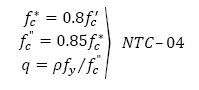
The principal difference between both codes is the geometry of the equivalent stress compression block (see Figs. 2 y 3). Thus, while the NTC-04 concrete block stress is computed on the basis of  , the ACI 318-11 it is calculated as 0.85 ƒc’. The reason for this difference is the use of an “effective” concrete strength
  by the NTC-04 to account some possible deficiencies in concrete production.
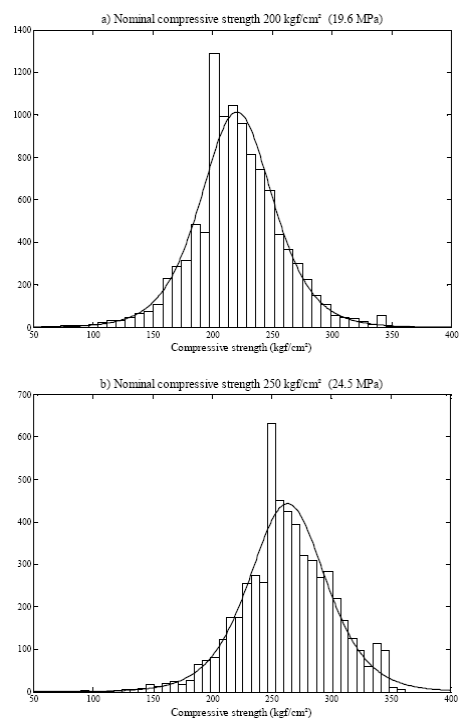
The structural design process involves the assumption that material strengths are known (ƒ c ’ for concrete and ƒ v for reinforcement steel), however in real world material properties are not unique and invariant, as can be seen in Fig. 4, where concrete compressive strength for two design nominal values are plotted in histograms. The variability of material properties can significantly influence the expected strength of the structural element. To evaluate overstrength in reinforced concrete elements subjected to bending, a simulation model is proposed following the recommendations made by Kim & Nelson [25], Law [26,27], and Ingals [29] to develop an adequate simulation model.
As previously mentioned, the bending strength of reinforced concrete elements, considering the variability of concrete compressive strength for local conditions of quality control, is evaluated in this paper. To do this, the concrete compressive strength is considered as a random variable, which data (observed) samples are described in the following section.
Note that the term overstrength is used because it is generally expected that the actual bending strength is greater than the calculated nominal strength. However, the compressive strength is uncertain and not necessarily larger than the nominal value, and may even be smaller.
Estimating the bending overstrength is an important issue because its evaluation allows us to predict probabilistically the actual bending strength in a structural element, and also to know the overstrength distribution related to the considered compressive strength and the used design model. Additionally, it will improve the nonlinear models to predict undesirable behavior under extreme load cases, such as load conditions that involves earthquake solicitations.
Therefore, the main objective of this study is to assess the influence of real concrete compressive strength on the bending strength of reinforced concrete beams by using a simulation model considering the NTC-04 and ACI 318-11 requirements.
2. Concrete compressive strength data and fitting
More than 16,000 concrete compressive strength tests are carried out by Contratos y Servicios Maquipa SA de CV, located at the city of Aguascalientes, Ags., Mexico, for concrete specimens sampled from mixed concrete provided by local suppliers. All tests correspond to specimens of concrete designed for a nominal compression strength of 200 kgf/cm² (19.6 MPa) and 250 kgf/cm² (24.5 MPa) at 28 days age. Fig. 4 shows the histograms corresponding to each concrete compressive strength.
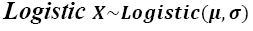
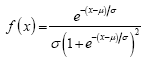
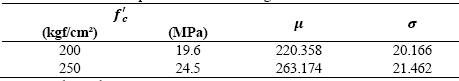
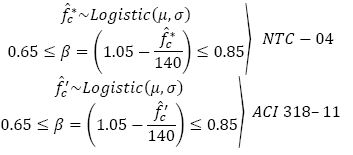
Assuming that concrete compressive strength is an independent identically distributed (IID) random variable, all data tests are fitted to several probability distribution functions to represent data as recommended by Law [26]. Chi-square and Kolmogorov-Smirnov goodness of fit tests are computed to determine the best probability function that represents data. The best fit resulted when the logistic distribution is considered,  , for both nominal design concrete compressive strengths. The fitted distributions are shown with a thick line in Fig. 4 using parameter values presented in Table 1 for each case. For more information on this probability distribution, and others considered in the present paper, the interested reader is referred to the Appendix.
3. Simulation Model
Considering concrete compressive strength as an IID random variable, i.e., 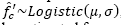 , the normalized bending strength Φ can be estimated for each code from Eqs. (6) and (7) which are described in the following.
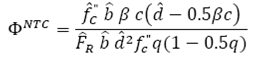 (6)
(6)
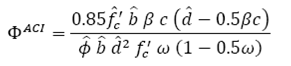 (7)
(7)
In Eqs. (6) and (7) resistance reduction factors are added (F
R
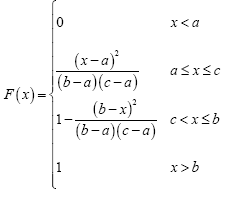
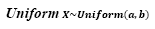
and Φ) as specified on the considered construction codes. These reduction factors have an invariant value of 0.9 for both codes. Reduction factors are used to include the uncertainties associated to the resistance and the employed hypotheses in design, as well as to provide a certain level of safety. In Eqs. (6) and (7), reduction factors are considered random variables with Uniform distributions as an indirect way to account for the modeling error, which is reflected when the difference between the models to compute the resistance compared to the experimental results are significant  ), and when these same models generate an excellent bending strength estimation ( 𝐹 𝑅 = 𝜙 = 1.0), and also the intermediate cases. The use of the Uniform distribution implies that not enough information on the uncertainty of the considered variable is available (Benjamin and Cornell, 1970) [27], as in this case, at least for the Mexican practice. Thus, reduction factor can be estimated by Eq. (8).
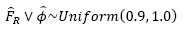 (8)
(8)
As shown in Figs. 1 and 2, C represents the neutral axis depth that establishes the force equilibrium among concrete compression C and steel tension 𝑇. Eqs. (1) and (2) are only valid when steel reinforcement yields, i.e., ƒ s = ƒ y , where ƒ s denotes the stress on steel. As there is the possibility that this condition does not occur, i.e., ƒ s < ƒ y ,, 𝑐 is computed by employing a numerical approach based on the secant method to ensure that force equilibrium is reached. For this reason, it is necessary to define transverse section dimensions to perform the numerical calculation process. Consequently, common values of b and d are selected using Eqs. (9) and (10).
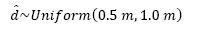 (9)
(9)
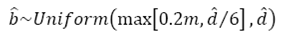 (10)
(10)
Note that the selection of b and d as Uniform random variables is not intended to account for the uncertainty in the geometric properties, but simply to generate beams with a wide variety of sections to avoid any effect of the aspect ratio in the results. Obviously, different sections lead to different bending strengths, but the conclusions hold for concrete beams in general, since Eqs. (6) and (7) are normalized (note that 𝑏 and 𝑑 appear both in the numerator and denominator). In fact, these equations can be considered as the ratio of the actual bending strength to nominal bending strength when considering the probabilistic analysis and described assumptions. As shown, Eqs. (6) and (7) are normalized because the denominators determine the bending strength in accordance with each construction code, while the numerators include compressive strength as a random variable. The way in which the numerators are expressed permit the use of the numerical procedure to compute the force equilibrium in function of the neutral axis 𝑐 as already mentioned.
The procedure to compute Φ is as follows:


4. Results
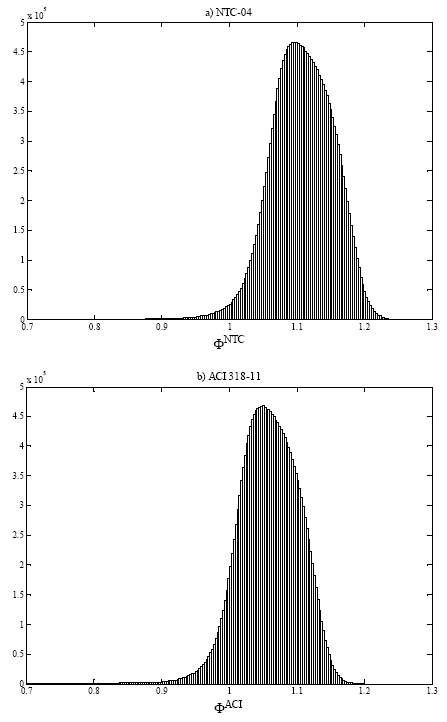
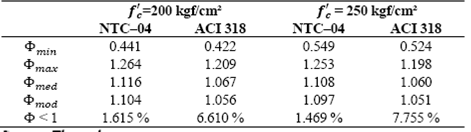
The outlined simulation model is used, and results of Φ for 20 million of simulations are shown as histograms in Fig. 5, considering the minimum steel ratio ρ as stipulated in Eq. (5) for ƒc*= 250 kgf/cm² (24.5 MPa) and both building codes. As may be observed, in almost all cases the bending strength is greater than the value calculated with the nominal material properties. Similar results are obtained for ƒc’= 200 kgf/cm² (19.6 MPa). Table 2 shows central tendencies and dispersion values for both cases, where Φmin, Φmax, Φmed, and Φmod denote the corresponding minimum, maximum, median and mode for each case. Results in Table 2 show that the average value bending overstrength Φ 𝑚𝑒𝑑 is around 6% greater than the design value in all cases, and that at most 0.4% and 1.4% of the simulated data have bending stress under the nominal value for NTC-04 and ACI 318-11, respectively.
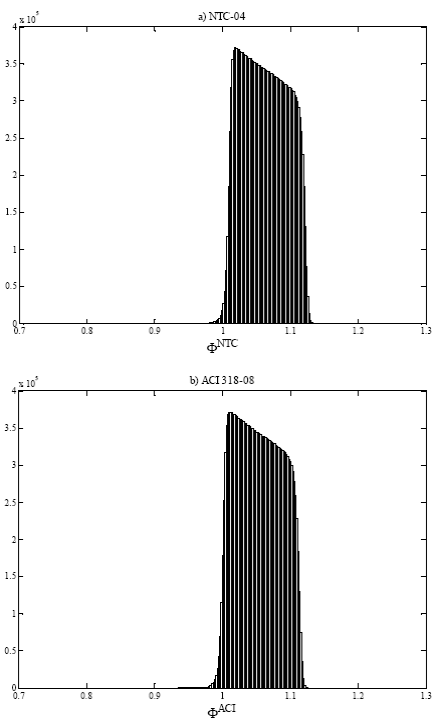

For the same simulation scheme, Fig. 6 shows the histograms of Φ, but in this case for steel ratio  and ƒ
c
’ = 250 kgf/cm² (24.5 MPa). An increment of Φ values can be observed respect to the previous results. Similar trends occur for ƒ
c
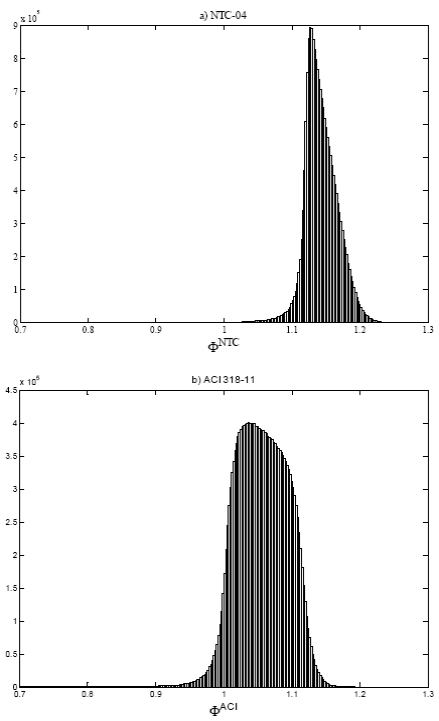
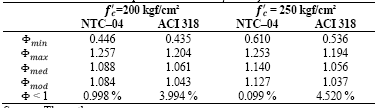
’ = 200 kgf/cm² (19.6 MPa) as can also be observed in Table 3. An average value of bending strength around 11% and 6% greater than the nominal is obtained for NTC-04 and ACI 318-11, respectively. However, a greater number of values fall under the nominal bending strength, being about 1.5% of the cases for NTC-04 and 7% for ACI 318-11, respectively.
and ƒ
c
’ = 250 kgf/cm² (24.5 MPa). An increment of Φ values can be observed respect to the previous results. Similar trends occur for ƒ
c
’ = 200 kgf/cm² (19.6 MPa) as can also be observed in Table 3. An average value of bending strength around 11% and 6% greater than the nominal is obtained for NTC-04 and ACI 318-11, respectively. However, a greater number of values fall under the nominal bending strength, being about 1.5% of the cases for NTC-04 and 7% for ACI 318-11, respectively.


Designing all structural elements with the same steel ratio hardly can occur in professional practice, so it is more reasonable to consider a wide range of possibilities within the limits stipulated in the constructions codes. Therefore, in Fig. 7 histograms of Φ considering the steel ratio as an IID random variable with Uniform distribution according to eq. (11) and ƒ c ’ = 250 kgf/cm² (19.6 MPa) are shown. The results for ƒ c ’ = 200 kgf/cm² (24.5 MPa) have a similar distribution that are shown in Fig. 7b. The central tendencies and dispersion values for these results are shown in Table 4.
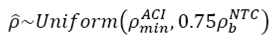 (11)
(11)


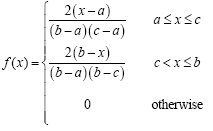
In general, it is desirable to provide a steel ratio not close to the minimum or maximum allowable values, since these limits are associated with brittle failure. Thus an intermediate steel ratio is preferred. Consequently, Fig. 8 shows the values of Φ when steel ratio is estimated as an IID random variable with Triangular distribution according to eq. (12).
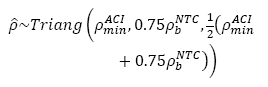 (12)
(12)


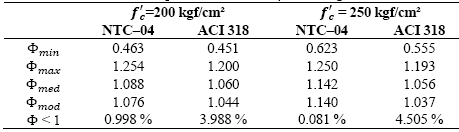
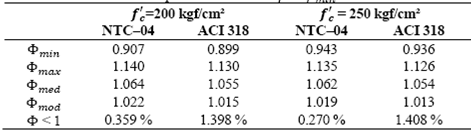
Form results shown in Figs. 7-8, as well as central tendencies values and dispersion showed in Tables 4 and 5, it may be established that the distribution of steel ratio has no significant influence on the obtained values of Φ since the obtained results are almost equal for both cases. Therefore, similar results are expected if any other distribution for the steel ratio is considered. From Table 5, it can be seen that the maximum bending overstrengths, Φ max , that can be obtained are 25% higher than the nominal value for NTC-04 and 20% for ACI 318-11. The average overstrength Φ med ranges from 9% to 14% greater than the nominal value for NTC-04, and approximately 6% for ACI 318-11. The number of cases with bending strength lower than the nominal value are at most 1% for NTC-04, while they are about 4% for the ACI 318-11.
It is important to note that all results presented herein are based on probability functions of concrete compressive strength (see Fig. 4) where 27% and 35 % (for ƒ c ’ of 200 kgf/cm² and 250 kgf/cm², respectively) of concrete compressive strength are lower than the design value.
5. Conclusions
In this paper, bending overstrength estimation for rectangular simply reinforced beams using a numerical simulation model is presented. Bending strength is estimated using the design hypotheses and requirements according to NTC-04 [1] and ACI 318-11 [2] construction codes.
Samples of concrete compression strength for ƒ c ’ of 200 kgf/cm² and 250 kgf/cm² provided in this study are used to carry out fitting distribution, and result in the use of the logistic distribution as an adequate probabilistic characterization of the data for both cases. When a lower bound of the steel ratio is considered (Fig. 5 and Table 2), the bending overstrength is, on average, approximately 6% greater than that obtained with a deterministic approach, achieving up to 14% of overstrength as maximum. A few bending strength values are lower than those computed with the nominal values, resulting in around 0.3 % of the cases for NTC-04 and 1.4% for ACI 318-11.
On the other hand, when an upper bound of the steel ratio is provided (Fig. 6 and Table 3), greater overstrength values can be obtained. The mean bending overstrength is around 11% greater than the design value for NTC-04 and 6% for ACI 318-11, reaching up to 26% and 20% as maximum overstrength, respectively. Also, more cases of bending strength values under the nominal strength occur, resulting in around 5% of the cases for NTC-04 and 7% for ACI 318-11. In other words, higher overstrength dispersion is found for this case respect to previous results.
To take into consideration that structural elements can be designed with different steel ratios in the same structure, this parameter is added to the simulation model as a random variable. Two distribution functions are used to represent the steel ratio. Initially a Uniform distribution is used to represent the equal probability of occurrence in the range considered defined by Eq. (11). Obtained results are shown in Fig. 7, and are summarized in Table 4. Also, a Triangular distribution is used to represent a probability steel ratio according to Eq. (12) to represent a greater probability of using an average steel ratio with respect to minimum and maximum limits. Results using a Triangular distribution are shown in Fig. 8 as well as in Table 5. As may be observed, results using both probability functions are quite similar. This behavior implies that a particular selected probability function for the steel ratio may have no significant influence on the obtained results. In the mentioned cases (for Uniform and Triangular distributions), the average overstrength Φ med is around 8% to 14% larger than the nominal value for NTC-04 and near to 6% larger for ACI 318-11, achieving maximum values of overstrength of about 25% and 20%, respectively. Bending strength values under the nominal values are less than 1% of the cases for NTC-04 and 4.5 % for ACI 318-11.
Obtaining larger bending strengths with respect to deterministic values computed as per NTC-04 does not mean that the assumptions considered by this building code are better than those for ACI 318-11. This simply occurs because the NTC-04 code employs an “effective” concrete compression strength ƒ c * = 0.8 𝑓 𝑐 ′ , i.e., NTC-04 considers that the real concrete compressive strength may be up to 20% less than the nominal, thus a larger bending strength for the same material properties is an expected consequence in the presented results. Additionally, it should be considered that the design forces computed for each design code may correspond to different load combinations with different load factors; therefore, care must be taken for direct quantitative comparisons.
Note that, if desired, the results in Fig. 7 (or 8) can be employed in studies where a probability analysis accounting for bending overstrength of reinforced concrete elements was of interest.
The results of this study suggest that, on average, the bending strength is larger than that obtained with invariant design concrete compressive strength (nominal). Since the results can be greatly dependent on the actual steel reinforcement yield strength, inclusion of the yield strength as a random variable in the simulation model, and is desirable for future works. Also, the confinement effect and shear interaction could be included to evaluate their influence on bending overstrength.
Since resistance variation has a significant influence on the behavior of structures subjected to seismic demands, to incorporate this variability into numerical structural models will lead to a more adequate prediction of ductility demands. Additionally, an adequate overstrength estimation will also contribute to propose better structural reliability models and therefore a better assessment of the structural safety.