


 Inglês (pdf)
 Artigo em XML
 Referências do artigo
 Enviar este artigo por email
 Citado por SciELO
  Citado por Google
  Similares em
SciELO
Similares em
SciELO  Similares em Google
 Permalink
1. Introduction
Mass movements in natural slopes can be characterized as a major natural hazard, with a high incidence of occurrence throughout the world [1-3]. These movements cause great harm to society, particularly in densely populated cities located near mountainous areas. Among the many consequences of such movements, Montoya [1] highlights frequent interruptions of road systems due to slope instability, occurring more often in cut slopes and during periods of heavy rain. He also points out that, even though levels of risk are quite high, decision-making during the road design phase does not address the consequences of these problems for the construction and operation phases.
Another important issue is the need for proper understanding of instability phenomena. These processes are quite complex, especially because of the number of unknown factors involved, such as those of a geological-geotechnical order, human activities and climate, among others. Therefore, Jesus [3] recommends each case be evaluated individually, taking into account the influence of the surface dynamic.
Currently, slope stability analyses are done using the finite element method, which is characterized as a powerful tool and widely used in the geotechnical area [4]. However, despite the effectiveness of the method, geotechnical engineers must be able to recognize the risks and uncertainties of the methods used [5 -7]. Accordingly, stability analyses should incorporate statistical analysis, in order to quantify the variability of the model input parameters and the influence of this variability on the risk [5,8,9].
Statistical analysis involves risk prediction by the probability of failure, which is the probability of a factor of safety less than 1.0 (rupture of the slope). Associated with this risk is the designer's lack of knowledge of the properties of the materials and the load conditions [5-7]. Therefore, in addition to the factor of safety usually employed in stability analysis, a thorough analysis should also involve the probability of failure [6,8].
Additionally, in geotechnical analyses, one can consider the sensitivity analysis of the shear strength parameters of the soil. This analysis shows the sensitivity of the slope stability for the variables considered, identifying the variable that has the most influence on slope stability [9].
In view of these points, this paper presents a study of the stability of a highway slope using numerical modeling as a tool. This tool, when used properly, accelerates the process of analysis and contributes to the implementation of the results obtained. In addition to conventional analyses, statistical analysis associated with the case study will also be presented. This is because risk assessments, using techniques such as reliability analysis, are a good option for a proper understanding of the processes of mass movements in slopes, contributing to the decision-making in the stabilization process [1,5,10].
2. Case Study
This paper presents a case study of a highway slope stability analysis for a critical section (km 215+000) located in the southern marginal lane of the Presidente Dutra highway (km 211+670 to km 216+060), near the city of Guarulhos (Sp).
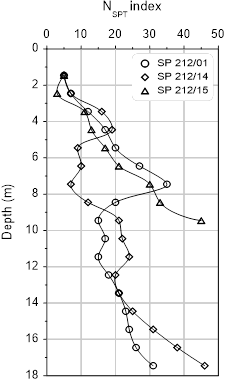
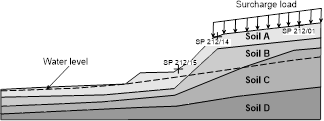
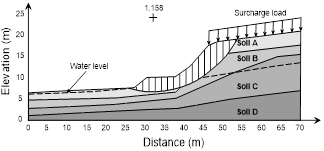
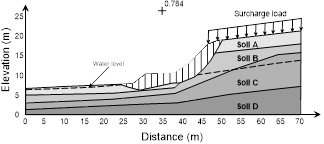
The stratigraphic profile of the section was defined based on a topographic survey, the geometric design and the results of SPT tests. The SPT tests were conducted from October to November 2011. Fig. 1 shows the variation of the Nspt index for the drilling depths that were evaluated in this study. The description of the soil layers and the Nspt index values are shown in Table 1. The stratigraphic profile was defined based on the results of SPT tests for the studied section in the relevant stretch. Fig. 2 shows the stratigraphic profile of the section analyzed. The positioning of the water level was determined according to the water level detected in the SPT tests. However, due to the absence of information at the bottom of the slope, the water level was positioned along the base of the slope in the interest of safety.
3. Estimate of soil layer parameters
In the development of geotechnical projects, the Nspt index is used directly in empirical or semi-empirical correlations as a key parameter in the calculation of bearing capacity, foundation settlement and in determination of the shear strength parameters of soils. Although not the preferred way to develop designs, this solution ends up being widely used, especially in the absence of information obtained through laboratory and field tests [11].
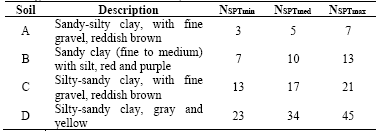
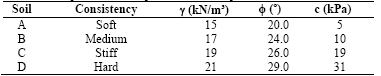
The results of the Nspt index were used in this study for the estimation of the shear strength parameters of the soil. This procedure reinforces the importance of conducting statistical analyses, incorporating the variability associated with estimating the parameters of the adopted soil layers. The values of the internal angle of friction (/), the soil unit weight (y) and the cohesion intercept (c) were estimated using empirical or semi-empirical correlations based on SPT results [12-14]. Table 2 shows the parameters of the soil layers estimated for the analyses.
4. Analysis of Global Stability
The analysis presented below was performed using Geostudio 2012.
The analysis of the stability of the critical section was carried out with the Slope module using the Morgenstern-Price method. This method presents a precise stability analysis procedure applied to all kinds of slope geometries and soil profiles. The equilibrium analysis is well established, presenting an accurate and complete procedure [15].
In the stability analysis of the section, a surcharge load of 20 kPa was applied at the surface of the soil. This is because the Brazilian technical standard [16] recommends that retaining structures be designed to withstand, in addition to forces from the soil, a minimum accidental surcharge load of 20 kPa uniformly distributed over the surface of the soil.
The stability analysis shows a factor of safety of 1.16 as shown in Fig. 3, falling approximately 23% below the minimum recommended by the Brazilian technical standard [16] which is 1.50. However, this analysis indicated that the factor of safety is greater than 1.0 and that the slope is not on the imminence of the rupture. Furthermore, it can be seen that the critical surface passes through soil layers A and B which shows the least resistance to penetration, as seen in Fig. 3 and Table 1.
Fig. 4 shows that the maximum shear strength value for a critical surface occurs at a distance of approximately 46 m, which coincides with the top of the slope and the end of the surcharge of 20 kPa.
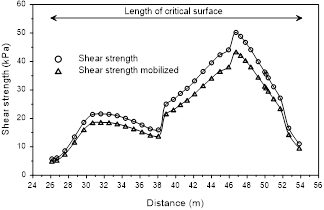
The global stability showed that the maximum shear strength was around 50.2 kPa and the maximum mobilized shear strength was around 46.8 kPa, occurring for a total length of 27.7 m. This analysis identifies the development of critical surface, which starts at 26.1 m and finishes at 53.8 m.
4.1. Influence of rainy periods
Additional tests were carried out to include the effects of rainy seasons because water infiltration causes an increase in water content. Consequently, the suction decreases and the water level increases reducing the shear strength of the soil. This has a direct influence on the movements of slopes and is considered the main cause of landslides [1,2,17].
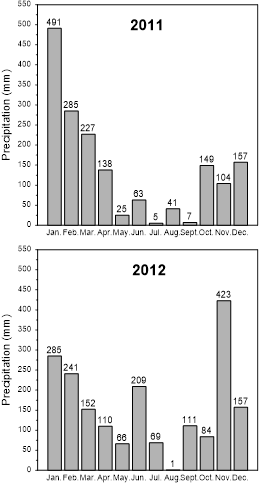
Given the importance of the effect of water infiltration in slopes, stability analyses were performed during a period of critical rain. This study was done using the Slope and Seep modules working simultaneously. The rainfall data presented in Fig. 5 were used as input parameters in Seep module in order to estimate the variation of the water table over time. The stability analyses were performed for each increase in the position of the water table.
The SPT tests used to define the stratigraphy of the slope were carried out from October to November 2011, which is characterized as a rainy season in the Southeast Region. However, in analyzing the rain data, there are other periods in which the rainfall can be more intense, as shown in Fig. 5. These data were obtained from the National Institute of Meteorology website (INMET), based on rainfall data provided by the Meteorological Station N° 83075 in Guarulhos, Sao Paulo.
By analyzing the monthly rainfall charts, a long dry period between May and September 2011 was observed, followed by a rainy period lasting from October 2011 through February 2012. In the present work, a dry period was defined as monthly rainfall precipitation lower than 90 mm. In this case, the water level was below the initial water level, which was positioned using SPT information.
This dry period may cause some uncertainty regarding the piezometric level adopted for the drilling, such that it can be erroneously positioned lower than the actual stabilization of the piezometric level of the soil, since a long dry period is capable of lowering the water table.
Source: The authors.
Figure 5 Average monthly rainfall chart (Weather Station Guarulhos, São Paulo, Brazil).
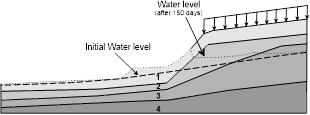
Therefore, the stability analysis was performed using daily and accumulated rainfall data for the months of October 2011 to February 2012, corresponding to 150 days. These data were used as boundary conditions on the external surface of the slope. Moreover, since it is a transient flow analysis, the level of water determined through the SPT tests was taken as an initial condition, as shown in Fig. 3.
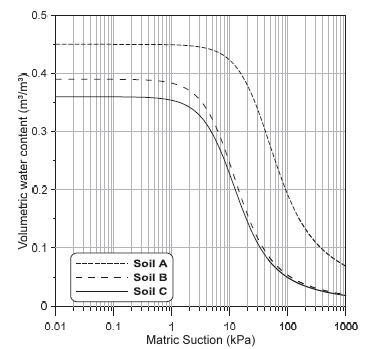
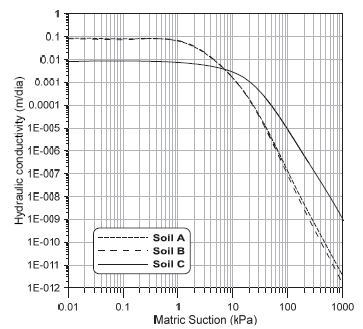
Analyses for unsaturated layers were conducted adopting isotropic materials and hydraulic conductivity ratio (ky'/kx') equal 1. The software provides different water content functions for different types of soils. Fig. 6 shows the soil layer curves used to estimate the volumetric water content [18]. Fig. 7 shows the hydraulic conductivity functions for soil layers, estimated through residual water content and hydraulic conductivity coefficient [18].
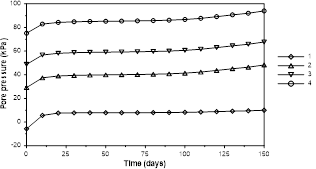
The results shown in Fig. 8 demonstrate that the position of the water level varies considerably, such that soil layer C appeared practically saturated. The water level variation was estimated through a maximum monthly precipitation of 285 mm. However, it is important to highlight that monthly precipitation higher than 400 mm can occur. Thus, the water level can rise more than the level considered in this analysis. The behavior of pore pressure values can be verified through some reference points in the slope, as seen in Fig. 8. The results showed pore pressure values increasing with time, with an increase of approximately 20 kPa at each point, as seen in Fig. 9. However this value, despite being constant, has the most significant increase for the first ten infiltration days. Aristizabal et al [17] showed that pore pressure values depend on rainfall intensity and soil layer permeability. In the present work, results showed that the smallest values of pore pressure were observed at the surface, as shown in Fig. 9. This behavior indicated that the rainfall intensity is smaller than the permeability of soil layer [17].
Source: The authors.
Figure 10 Critical surface (FSmin) taking into consideration the effects of water infiltration.
These analyses can be extended to the entire slope, showing the negative effects provided by the action of water infiltration into the soil. These effects act directly on the shear strength of the soil and consequently on the stability of the section studied.
The stability analysis for the critical period of precipitation was performed using the results of the infiltration analyses of the Seep module. The strength parameters used were the same as the initial stability analysis. Fig. 10 shows the critical surface, taking into consideration the effects of water infiltration. The minimum factor of safety obtained was 0.78, representing a 33% decrease compared to the initial stability analysis.
Fig. 11 shows the variation in the factor of safety over time, applying the daily variable rain intensity from INMET data for this time period. In the first ten days, the factor of safety declined approximately 10%, characterizing a state of imminent failure. In the months of November and December the intensity of rainfall did not show great variation and therefore the factor of safety only decreased about 3%. In January and February the intensity of rainfall significantly increased and the factor of safety decreased 9% in each of those months.
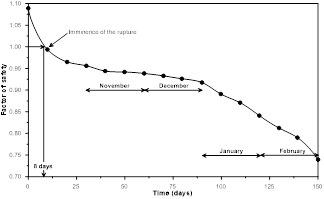
The results show the importance of taking into consideration the effects of rainfall infiltration for stability analysis. As can be seen, the slope, which initially appeared stable, revealed the occurrence of failure after the effects of an intense period of rain.
4.2. Reliability analysis
The following reliability analysis is presented because the factor of safety, widely used in the practice of geotechnical projects, is often determined based only on the designer's experience [7]. However, it is common to extend this experience to other situations without considering the varying degrees of uncertainty involved in each application [6]. A reliability analysis can be performed in a simple manner and using the same data from the conventional analyses. For this reason, it is recommended that the factor of safety and reliability be used together as complementary measures for acceptable design [6,19].
In this study, a reliability analysis was performed based on the uncertainty related to the shear strength parameters of the soil. These parameters were estimated based on the results of SPT. This analysis is considered of great importance because geotechnical engineering is characterized as a science where there are uncertainties related to natural variability, knowledge and forecasting models [10,19-21].
A research conducted by Hidalgo et al. [2] provides reference data for coefficients of variation, based on various published studies. The probability of failure (PF) was determined with the Monte Carlo method and using the coefficients of variation of 7.5% and 40% for the effective angle of friction and cohesion intercept, respectively.
The following analysis presents the variability of shear strength parameters for soil layers A and B, because it was noted that the critical surface develops within these layers, as shown in Fig. 3. Table 3 shows the average, minimum and maximum values for the parameters analyzed.
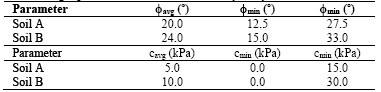
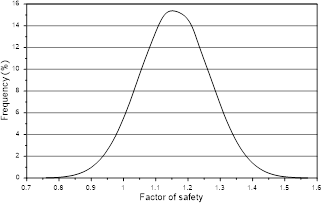
Fig. 12 shows the normal probability distribution function for the stability analysis of the slope. The results indicated an average factor of safety of 1.16, with minimum and maximum values equal to 0.74 and 1.59, respectively. The standard deviation was 0.11 and the reliability index 1.44, resulting in a probability of failure of 7.7%. These results indicate that the analyzed section presents unsatisfactory stability performance [19].
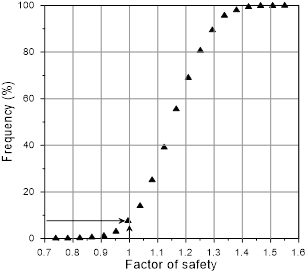
Fig. 13 shows the normal probability distribution of the factor of safety, where values equal to or lower than 1.0 have a 7.7% probability of occurrence, characterizing the failure of the section analyzed. The reliability analysis shows that despite a factor of safety higher than 1.0, the slope stability has an unsatisfactory performance. Thus, the factor of safety and the probability of failure should be analyzed together.
4.3. Sensitivity analysis
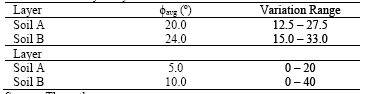
Sensitivity analysis was used to observe the effect of the variability of the shear strength parameters on the stability of the section studied. This analysis can determine whether the stability of the section is more sensitive to the cohesion intercept or the angle of friction [9]. The analysis included soil layers A and B, which are the layers which show development of critical surface. Table 4 shows the range of variation for soil layers A and B.
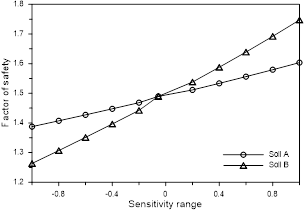
The results indicated that the cohesion intercept value for soil layer B had a greater influence on the factor of safety than the cohesion intercept value for soil layer A, as shown in Fig. 14. This behavior is coherent since most of the critical surface develops within the surface layer of soil B, including the portions where the application of the surcharge occurs. In
addition, for the analysis performed for soil layer B, the cohesion intercept of soil layer A is held constant and equal to 5 kPa, while in the analysis for soil layer A, the cohesion intercept of soil layer B is kept constant and equal to 10 kPa.
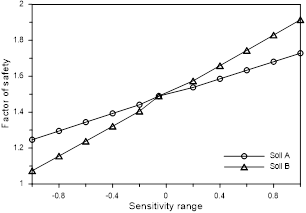
The sensitivity analysis for the effective angle of friction showed that the stability of the section analyzed was also more sensitive for soil layer B, as shown in Fig. 15. These results confirm the results shown in Fig. 14, since the average effective angle of friction of soil layer B is higher than soil layer A. Therefore, the shear strength parameters of soil layer B have more influence on the stability of the section studied.
Additionally, the sensitivity analysis showed that the global stability is more influenced by the cohesion intercept. Results showed that for the cohesion intercept equal to zero, the factor of safety is less than 1, while for the effective angle of friction equal to 15°, the factor of safety is around 1.25, as seen in Fig. 14 and Fig. 15.
5. Conclusion
This article presents an analysis of the stability of a section considered critical in the southern marginal lane of the Presidente Dutra highway, located near the city of Guarulhos (SP). In addition to overall stability, the influence of the rainy season in the region and probabilistic analyses were considered. These analyses were performed using numerical modeling using the Slope and Seep modules of GeoStudio 2012 software. With respect to results, the following was confirmed:
The global stability analysis presents a factor of safety below the minimum recommended by the Brazilian technical standard. This result indicated the need for supplemental analyses for the study of the stability of the section.
The analysis of the influence of the rainy season indicated that the water level position varies considerably. Additionally, the pore pressure values showed an increasing trend over time, and the percentage increase was more significant for the beginning of rainy period.
The infiltration analysis proved to be of fundamental importance, since the factor of safety declined by 33% from its initial value. This analysis indicated the impairment of the stability of the studied section.
In addition, the reliability analysis indicated that the factor of safety can vary between 0.74 and 1.59. The standard deviation was 0.11 and the reliability index 1.44, resulting in a probability of failure of 7.7%. This analysis showed the stability of section to be unsatisfactory.
The sensitivity of the stability of the section was studied with respect to the shear strength parameters. The results indicated that the stability of the section is more sensitive to variations in the cohesion intercept of soil layer B. These results are consistent with the values of the parameters used and the geometric section.
Overall, the analyses presented indicated that numerical modeling is a complex tool that permits effective implementation of conventional analysis of slope stability. In addition, the factor of safety and the reliability index should be used as additional supplemental information for the development of a suitable project.

