


 Inglês (pdf)
 Artigo em XML
 Referências do artigo
 Enviar este artigo por email
 Citado por SciELO
  Citado por Google
  Similares em
SciELO
Similares em
SciELO  Similares em Google
 Permalink
1. Introduction
Vision-based object tracking is an important task and a useful source of information. It analyzes video sequences to retrieve the motion of an object at each frame [1]. Recovered metrics can consist of location, orientation, speed, and acceleration, computed on the image plane (2D) or real world (3D) reference coordinates. In general, the complexity is closely related to the object tracked: its articulated nature, or abrupt motion changes. Complex scenarios with illumination changes, noise, and object-to-object and/or object-to-scene occlusions will also degrade the tracking performance, particularly on non-controlled real life video sequences. Some examples of object tracking applications include: motion-based recognition [2], automatic surveillance [3], traffic monitoring [4], and vehicle navigation [5]. In this list, pedestrians or people are one of the most interesting objects to track for researchers and developers. In addition, it is an open subject because of its high complexity given a person’s changing appearance, non-rigid structure, and occasional hazardous motion.
1.1. Related work
There are different approaches to tackle human tracking. Some trackers use a bounding box at an initial frame of the sequence. Among them, two methods from the Tracking-by-Matching group [1] are distinguished by their simplicity and good performance. The first one is the Lukas-Kanade (LKT) algorithm [6]. It seeks to locate either a moving or non-moving object from one image to the next frame in the sequence. This method iteratively minimizes a dissimilarity measure in the neighborhood of a point of the tracked object. Shi and Tomasi [7] prove that corners are the best choice to obtain optimal tracking results. The second method is Mean Shift [8], which locates the object position within the next frame by maximizing a similarity coefficient calculated with the Bhattacharyya distance. This coefficient compares the color distribution of the target object against the possible object positions on the following image.
Online discriminative classification [9] also uses initial bounding boxes. This method trains an adaptive classifier considering the first bounding box as positive, and the surrounding background as negative. Exhaustive research on the image at t+1 (the consecutive frame) will provide a new positive and negative sample which updates the classifier, and the loop repeats itself.
When pedestrians (or vehicles) are the only moving objects on the scene, background suppression methods can estimate their motion. In [4], the dynamics of collected blobs are described by a collection of key-points. They are tracked by similarity functions matching the new blobs with stored objects.
In surveillance applications, where new pedestrians continuously enter the scene, pre-trained trackers using a target model which is known a priori are employed. This methodology, called Tracking-by-Detection, is generally implemented starting with pedestrian location hypotheses generated by a person detector. Dalal's and Triggs’s people detector [10], provided by OpenCV [11], is perhaps the most widely used in the literature. Those hypotheses are associated with previously saved tracks. This matching can be performed using the Hungarian algorithm [12]. Finally, the tracking itself can be performed by particle filters [13], Kalman-inspired Event Cones [14], or the evolution of a state machine [4]. The procedures of object detection and trajectory estimation can be combined into a coupled optimization problem [14], enhancing their individual performance. This methodology is robust to changing backgrounds, moving cameras, and the presence of other moving objects, and is the best adapted approach to be used on real-world, non-controlled, video tracking sequences.
Offline tracking systems are a variant of the Tracking-by-Detection pipeline [15,16]. They seek a global optimization of people's trajectories scanning forwards and backwards through the hypothesis locations at each frame to find the best path to explain the collected data. Ben Shitrit et al. [15] divide the ground plane on cells, and associate a probability occupancy map from people detector outputs. They use the K-Shortest Paths algorithm (KSP) to find the trajectories on the grid cells. The identities of the path are found by running a Linear Program procedure.
1.2. Proposed methodology
This paper aims at conducting pedestrian tracking from monocular video sequences captured by a calibrated camera with a fixed view on outdoor real scenes. Pedestrians can have different postures, and they are walking at different distances from the camera. Given that recorded sequences have cluttered and changing backgrounds, our tracking system follows a methodology based on the Tracking-by-Detection Framework.
The first contribution of this paper is an adapted tracking procedure using the Movement Feature Space (MFS). In [17,18], the MFS was successfully used to detect vehicles and pedestrians respectively. The advantages of this detector include efficient calculation time, increased robustness, and minimum loss of information. Also, in the MFS, all the operations are performed in motion, thus the presence of cluttered backgrounds does not interfere with the tracking algorithm. Since the MFS does not have a notion of pixel intensity or color to compute an image gradient [6], or color histogram [8], the tracking approach is based on tracking fields: an object detection field, and an appearance field. The former is constructed using the people detector output scores, and provides the likelihood of a person at a given location. The appearance field is computed using a corner analysis applied on the MFS, capturing a pedestrian texture which is robust enough to perform the tracking when partial information is available.
This paper also proposes an architecture where each pedestrian is considered as an autonomous entity, and their evolution on the scene is followed individually by a Target Framework. The framework associates one target with one pedestrian from his/her first view on the scene until he/she disappears from sight. A state machine models the dynamics of the target, which is continuously stored at a repository inside the framework. The evolution of the states of each target is employed in the data association stage, filtering false alarms, or concatenating broken trajectories.
The Target Framework combines on-line and off-line tracking methods. Firstly, the video sequence is analyzed on-line, populating with targets a repository which saves the temporal information about all the hypotheses generated during the detection and tracking. The next stage implements off-line algorithms to filter false alarms and concatenate broken trajectories. The performance of the detection and tracking system is evaluated in two public datasets, and compared against two state-of-the-art tracking systems [12,16]. The sensitivity of the procedure with different people detectors is also analyzed.
This paper is organized as follows: the section below details the detection and tracking procedure on the MFS, as well as the state machine associated with each target. Section 3 develops the procedures pruning the target framework in order to improve the results. Next, the Implementation System Setup is presented. In the Results and Discussion section the performance of the system on the tests datasets is described, followed by the Conclusions of the paper.
2. Online target framework generation
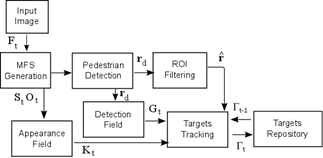
The Target Framework builds an on-line target repository based on the scene dynamics. Fig. 1 details the pipeline to generate this repository. Frame Ft at instant t is projected on the MFS capturing the motion on the scene. The Pedestrian Detection block uses the MFS on a people detector to generate pedestrian hypotheses r
d, also referred to as Regions of Interest (ROIs or rois). The ROI Filtering block filters neighbors and superposed rois in r
d using the Non-Maximal Suppression (NMS) algorithm [19]. The resulting set  is used in the data association step. r
d also generates a probability map
Gt
on the Detection Field block. The MFS data are used in the Appearance Field step to generate a Gaussian corner map
Kt
. The Target Repository block saves all the targets produced within the sequence. It is defined as the set of active targets
Γt-1
= {T1,t-1, … , Tn,t-1} using those present on the previous frame. The Target Tracking block employs Probability fields
Gt
and
Kt
, detected rois , and active targets set Γt-1 , to update Γt opening new targets, and closing others.
is used in the data association step. r
d also generates a probability map
Gt
on the Detection Field block. The MFS data are used in the Appearance Field step to generate a Gaussian corner map
Kt
. The Target Repository block saves all the targets produced within the sequence. It is defined as the set of active targets
Γt-1
= {T1,t-1, … , Tn,t-1} using those present on the previous frame. The Target Tracking block employs Probability fields
Gt
and
Kt
, detected rois , and active targets set Γt-1 , to update Γt opening new targets, and closing others.
Source: The authors.
Figure 1 Block diagram of the pedestrian on-line tracking system and the Target Framework.
2.1. Pedestrian detection on the MFS
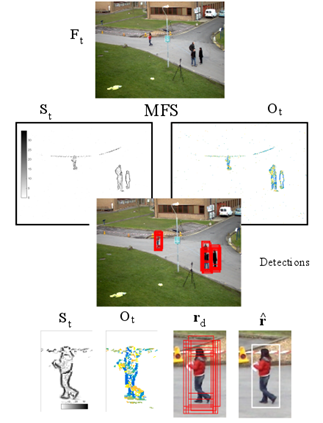
The MFS is an adaptive motion extraction model. It uses level lines and their orientations as features to generate an adaptive background model. The motion in the frame at time t, corresponds to the set of level lines which do not belong to the background model. It is encoded in two arrays: St and Ot, as shown on Fig. 2. Matrix St(p) counts the number of moving level lines passing through pixel p, and Ot(p) indicates the orientation of the level lines with a different color. The background details are not present on the St(p) and Ot(p) matrix, as can be seen on the figure. New static objects entering the scene, will integrate the background model after a temporal window.
Fig. 2 shows an example of the pedestrian detector output. The detector consists of a cascade of boosted classifiers trained using the Real Adaboost approach. The feature family encoding the information of the MFS are the histograms of oriented level lines (HO2L). They are computed by accumulating the number of pixels on Ot(p) having the same orientation (see [18] for further details). The detector output is a list of rois, as depicted on Fig. 2, with their associated confidence score: rd={ri,si}n=0,...,n-1. Each roi is defined as ri = [xic , yic , wi , hi], where (xic, yic) is its central position and (wi, hi) are its width and height, respectively. The NMS filtering is applied to rd in order to determine the estimated pedestrian positions  .
.
Source: The authors.
Figure 2 MFS computation in the PETS2009 dataset and the result of a pedestrian detector. The Fig. shows the MFS information of the St and the Ot arrays of the entire capture, and a zoom on the pedestrian position. It also shows set rd of pedestrian detected rectangles, and filtered pedestrian position.
2.2. Association of targets and detections
A target is an autonomous entity individually tracing a pedestrian moving on the scene. Target i is described with parameters: Ti,t-1 = {b,id,e,m}. Ti,t-1.b={x,y,w,h} is the bounding box containing the pedestrian, Ti,t-1.id is a label identifying the target, Ti,t-1.e is the state of Ti, and Ti,t-1.m is the motion history consisting of the last z displacement vectors: m={dt-z ,..., dt-1}.
The association of the active targets on Γt-1 and the pedestrian hypotheses r at time t is key for the Tracking-by-Detection approach. As a result, it is possible to validate targets, filter false alarms, or use alternative tracking procedures if the detector fails.
The association task is as follows: each pair (rj ,Ti), with rj being a detection on and Ti one of the n targets on Γ
t-1
, generates a displacement vector  from the central point of Ti.b to the central point of rj , where
  and θ are the modulus and the angle of
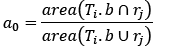
 . Overlap ratio a
0
between Ti.b and rj is used as a confidence criterion, and is evaluated employing the PASCAL VOC formula [19]:
. Overlap ratio a
0
between Ti.b and rj is used as a confidence criterion, and is evaluated employing the PASCAL VOC formula [19]:
 (1)
(1)
Assuming slow changes in the pedestrian dynamics,  should have low values, θ should be similar to
  where
where  is the average of the motion vectors saved in Ti.m, and a
0
would be greater than zero. The angle between
is the average of the motion vectors saved in Ti.m, and a
0
would be greater than zero. The angle between  and is computed using the dot product:
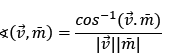 (2)
(2)
After all the (rj, Ti) pairs are evaluated, target Ti is associated with the detection rj which best matches its historical motion. The best match will consist of the pair which minimizes  and
and  , maximizing a0. If rj is not associated with any Ti, a new target T is created and saved in the Γt set. A Ti of Γt-1 is considered as lost if no detection rj matches its dynamic.
2.3. Probability fields for tracking targets
To track one target, the procedure estimates its position on the current frame Ft from its position recorded in Γt-1. In this paper, tracking is conducted using two types of tracking fields: a detection field and an appearance field. The detection field is computed using output score si of the people detector on the detected set rd={ri,si}i=0, … , n-1 The appearance field is based on a corner extraction on the MFS.
2.3.1. Detection field
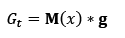
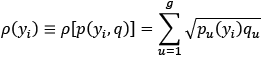
The Detection Field Gt(x) is a probability map generated using the rois set rd={ri,si}i=0, … , n-1 , where detected rois ri={xi, yi, wi, hi}. To compute the Gt field, ROIs ri in rd generate the map M(x) as follows: M x = 𝑖 𝑠 𝑖 𝛿 𝐱− 𝐱 𝑖 where δ(x) is a kroneker delta in , and xi is the central point of ri. The detection field is computed by convolving the map M(x) with a 2D Gaussian filter:
 (3)
(3)
 (4)
(4)
where the parameters of the Gaussian filter include the covariance matrix Σ=0.12 [(wi)2 0 ; 0 (hi)2], the central point in patch xc=( wik/2, hik/2), and the position inside patch x’=(x',y') where x'=0,...,wi-1 and y'=0,..., hi-1. The highest values in Gt(x) are associated with a high confidence output of the people detector, and could suggest the presence of a person at position x of the image.
2.3.2. Appearance Field
The tracking using the Appearance Field is activated when one target Ti∈ Γt-1 is not associated with a detection in rd. As an example, if Γt-1 has only one target T0 and rd is empty (the detector failed to detect the pedestrian), all the elements of Detection Field Gt will be zero. In those cases, the Appearance Field will be used to compare the pedestrian characteristics from the previous and the present frame of the sequence. Furthermore, this procedure is robust enough to track the target with partial information.
Source: The authors.
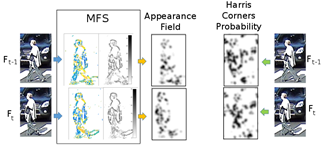
Figure 3 Appearance field generation from MFS corners of two consecutive captures from an urban video sequence.
The Appearance Field uses arrays St and Ot of the MFS, on a vector-based corner detector [17]. This corner detector considers that, in a neighborhood Bp of one corner point p, there are pixels with significant gradients with different orientations. The average of the cross products between all the pixels in Bp is, in general, greater than the value computed in the neighborhood of a pixel that is not a corner.
The average cross product in neighborhood Bp can be computed as: Kt = Ix2 <Iy2> + Iy2 < Ix2> - 2 Ix Iy <Ix Iy>. <> is the convolution with a 5x5 mask, where all its elements are ones, except for the center which has a zero value. Assuming that orientations Ot are given in radians, values Ix and Iy are defined as: Iy = St sin(Ot) and Ix = St cos(Ot).
Higher values of Kt suggest the presence of corners, and are shown as darker regions in Fig. 3. A Gaussian filter with standard deviation σ=3 is applied to smooth map Kt. As can be seen in Ot and St in Fig. 3, the rear vehicle does not generate corners, because it belongs to the background model. This is a great advantage of the methodology. Two consecutive captures of the dataset and the corresponding Appearance Field are shown on Fig. 3. Both fields are similar and the tracking system can successfully follow the person. Fig. 3 also compares the corner map obtained using the Harris corner detector which works on the gray scale image. As can be seen, the background behind the person incorporates a lot of noise for the tracking system.
2.4. Tracking procedure
This section describes the iterative tracking method. It is inspired by the LKT and Mean Shift trackers. Instead of using image intensities [13] or colors [15], the algorithm uses tracking fields: Detection and Appearance Fields.
2.4.1 Iterative Tracking Algorithm
For a given Ti,t-1 = {b,id,e,m} ∈ Γt-1, the methodology seeks their most probable position in Ft using Ti,t-1.b as the first hypothesis. Algorithm 1 presents a pseudo-code of the iterative tracking. It has four inputs: two tracking fields, Q and P, obtained from the previous frame and the current frame respectively, initial position y0, and a first displacement hypothesis g. If the association stage matches a detection ROI to Ti, the tracking fields correspond to Gaussian fields: Q = Gt-1 and P=Gt. Otherwise, the tracking fields employed correspond to appearance fields: Q=Kt-1 and P=Kt. y0 is the central point of Ti,t-1.b: y0 = {b.x + b.w / 2,b.y + b.h / 2}. Subsection 2.4.2 details the use of the displacement hypothesis.
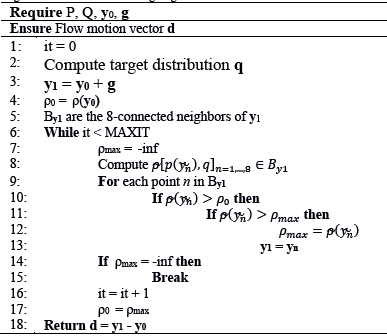
Distributions Q and P are respectively computed to obtain a similarity score comparing position y0 at time t-1 to a new position yi, at time t. We define the target distribution q={qu}u=1, …, g, which are all the pixel values of field Q inside the ROI centered at y0. Distribution p(yi) are the pixel values of field P inside the ROI centered at yi. These vectors are normalized to obtain distributions, i.e.  . The similarity score is calculated based on the Bhattacharyya coefficient [8]:
 (5)
(5)
In (5), both distributions have the same length g (the ROIs have the same size). The algorithm will seek to find the new position y1 = y0 + dt in P, where dt is a displacement vector, which maximizes the similarity criteria.
The initial position of y1 is the location of the target in the previous frame, y0. At each iteration, y1 moves one pixel toward the largest Bhattacharyya coefficient in the 8-connected neighborhood By1. This algorithm converges to a local maximum due to the nature of the Gaussian fields. However, a necessary condition for an accurate convergence is that the local maximum should be in the neighborhood of y0. To ensure this condition, and a fast convergence, next location y1 of the object is searched in a pyramidal representation of tracking field P. The number of iterations of the algorithm was fixed to MAXIT=20 in our tests, but, in general, the convergence is reached after two or three iterations.
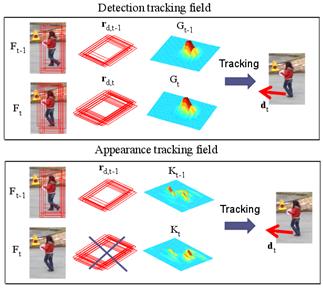
Fig. 4 shows an example of the computation of the displacement vector dt using the probability fields. In the upper box, the people detector had found the person in both frames Ft-1 and Ft. Detection fields Gt-1 and Gt could be created using their output ROIs rdt-1 and rdt. Thus, the tracking algorithm uses both probability fields to find the flow vector dt associated with the dynamics of the pedestrian. The second box simulates when a pedestrian is lost by the detector, and then, the system uses appearance fields to obtain flow motion vector dt.
4.2.2. Pyramidal search
The pyramidal search is carried out on downsampled versions of the original probability fields P and Q. These versions are denoted as PL and QL, with L={0,1,2}. The new size of PL and QL corresponds to the original size of P and Q divided by factor 2L. The tracking of target Tk starts in the third level L = 2 of the pyramidal representation. Algorithm 1 is executed using P2, Q2 and y20 = y0 / 4 as parameters. We also define a vector gL, which pre-translates tracking field QL, and represents a first displacement hypothesis. For L = 2, gL=[0 0]T. Algorithm 1 returns flow vector dL, which is used to compute the pre-translation vector of the next level: gL-1 = 2 ∙ (gL + dL). The algorithm is executed a second time using the next level of the pyramidal representation. Final solution d of the pyramidal tracking is obtained by computing the displacement at level 0: d = g0+d0. Motion vector dt is stored in target k, and its new location is computed as: Tk,t.b = Tk,t-1.b + dt.
Source: The authors.
Figure 4 Flow motion vectors dt obtained from probability fields: using detection fields in the upper box, and using appearance fields in the lower box.
4.3. State machine of a target
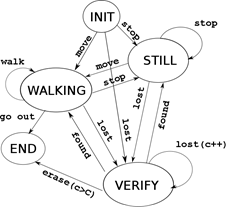
The target framework models each pedestrian as an autonomous agent with a state machine. Throughout the target lifetime, from the first time it appears in the sequence, until it exits the view, the tracking system collects information about its evolution generating events that trigger transitions between the states. Fig. 5 shows the states of a target and the events generating the transitions to the following states.
INIT STATE:
A detection roi rk in
 not associated with an existing target in Γ
t-1
generates a new target Tnew={b,id,e,m}. The initial position of Tnew.b copies the value from rk. The number identifying the target, Tnew.id, is computed incrementing by one the last id number. Motion history Tnew.m is created as an empty array. The state of Tnew.e is initialized with the INIT value. Then, target Tnew is stored in the Γ
t
set of the Target Repository. In the next frame, if the association stage does not find a corresponding detection on, the lost event is generated and the new state will be VERIFY. When a detection is associated with the target, the tracking procedure generates a motion vector d. If the module of d is near zero, the stop event triggers the transition to the STILL state. Otherwise, the move event is generated and the new state of the target will be WALKING.
not associated with an existing target in Γ
t-1
generates a new target Tnew={b,id,e,m}. The initial position of Tnew.b copies the value from rk. The number identifying the target, Tnew.id, is computed incrementing by one the last id number. Motion history Tnew.m is created as an empty array. The state of Tnew.e is initialized with the INIT value. Then, target Tnew is stored in the Γ
t
set of the Target Repository. In the next frame, if the association stage does not find a corresponding detection on, the lost event is generated and the new state will be VERIFY. When a detection is associated with the target, the tracking procedure generates a motion vector d. If the module of d is near zero, the stop event triggers the transition to the STILL state. Otherwise, the move event is generated and the new state of the target will be WALKING.STILL STATE
The target remains in this state until a move event, generated with a value of motion vector d other than zero, triggers the machine to the WALKING state. A lost event triggers a transition to the VERIFY state.
WALKING STATE
In this state, the target is supposed to be continuously moving. The average of the last three motion vectors, dt-2, dt-1 and d t saved on the m array, estimates this movement. If this value is near zero, the stop event is generated and the target changes to the STILL state. Otherwise, the target remains on the WALKING state. This procedure helps to filter some tracking errors and to generate smooth transitions between the states. If the target goes beyond the limits of a scene, a go out event is generated and there is a transition to the END state.
Source: The authors.
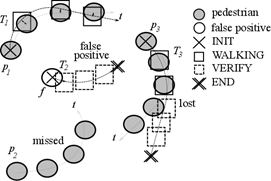
Figure 6 This figure shows different situations using the target framework. In this schema, real pedestrians pi are represented by filled circles, false positives by empty circles, and Ti are shown by their different states.
VERIFY STATE
This state is triggered when the association task does not match any detection to the target, and the lost event is generated. The transition to this state initializes a counter c of the number of captures where the target is lost. In this state, the tracking of the target is executed using the Appearance Field. If counter c reaches a threshold C, an erase event is generated, and the state machine changes to the END state. However, when the association procedure finds a detection corresponding to the target position, the found event is generated and the target state has a transition to STILL or WALKING, depending on the modulus of motion vector dt.
END STATE
This state closes the target, and will not be present at next set Γ t-1 .
Fig. 6 shows some examples of the tracking procedure with different detection results. Target T1 correctly tracks pedestrian p1. T3 is an example of a lost pedestrian, and T2, which was generated by a false alarm f, was immediately closed because f was the only detection.
5. Off-line target framework pruning
This section develops the off-line evaluation of the target framework through the sequence. All the targets are analyzed in order to filter false alarms and concatenate broken tracks. The procedures detailed in the next sections can be considered, however, as causal. This implies that it could be possible to adapt the false positive filtering and the concatenation algorithm to work on-line, but this is beyond the scope of this paper.
5.1. Filtering of false positives
False positives (detections that are not pedestrians) can be easily identified if the only states of the corresponding target are INIT and VERIFY, i.e. target T2 in Fig. 6. The example depicts the case where only one detection, possibly due to light conditions, shadows, etc., generates target T2 which is closed four frames later. To filter those cases, the target is eliminated if: #NV > #NS+#NW$, where #NV, #NS, #NW are the number of times the target is in the VERIFY, STILL and WALKING states, respectively.
5.2. Target concatenation with the kalman filter
The concatenation procedure aims at connecting a target in VERIFY state and a new target created before, but corresponding to the same pedestrian. The Kalman filter is used for its robust estimation of trajectories, providing metrics to match the lost target with one of the potential new ones as proposed by Deriche & Faugeras [20].
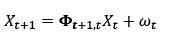
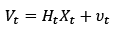
To perform the first task, a Kalman filter is used. It computes the optimal estimation of state vector Xt (positions, speeds and accelerations) from noisy measurements Vt, consisting of the ground plane positions of the target at time t [21]. Those positions are obtained using the calibration parameters of the camera and the scene. The model of our application, following the system dynamics and measurements, is shown below:
 (6)
(6)
 (7)
(7)
where ωt and υt are assumed to be normally distributed with zero mean and covariances Q t representing the model error, and R t the covariance of the measurement error. Φt+1,t is the evolution matrix, and Ht, the selection matrix. A detailed description of matrices can be found in [22].
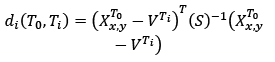
Let T0 be the tracked target which changes to the VERIFY state at time tv and whose position was estimated by the Kalman filter. Let Ti=1, …,n be all the other targets generated at tv. The matching procedure consists of evaluating those targets that are near T0 and have a similar evolution. Proximity is measured by the Mahalanobis distance between the filtered position of T0 and the candidate position [20]:
 (8)
(8)
where the covariance of difference 𝑋 𝑥,𝑦 𝑇 0 − 𝑉 𝑇 𝑖 , S, is the sum of the Kalman covariance matrix PTo and R. Distance di has a χ2 distribution with one degree of freedom. A threshold of di < 3.84 is proposed in order to account for a 95 percent probability of matching targets related to the same pedestrian. More distant targets are discarded. Candidate targets should also have a similar evolution to T0. This is computed by comparing their displacement vector, and the displacement vector of the target candidate. From those targets which fulfill both conditions, the one with the minimum distance is matched with T0 by unifying their ID. If none applies at time tv, the targets on the next frame are evaluated. This procedure is repeated for W frames before considering the target as not concatenable.
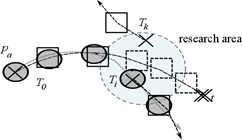
Fig. 7 shows an example where a pedestrian has an abrupt change in direction, and the original T0 lost the track. The search area where T0 changes to the VERIFY state is defined by S. There are two candidates, Ti and Tk, initiating inside the area. However, the evolution of Tk is different from that of T0, and the second criterion is not fulfilled. Then, Ti is retained and concatenated with T0 updating its ID (Ti.id = T0.id).
Source: The authors.
Figure 7 The figure shows the research area around the position of pedestrian pa, target T0 which is closed, and target candidates Ti and Tk for the matching procedure.
Source: The Authors.
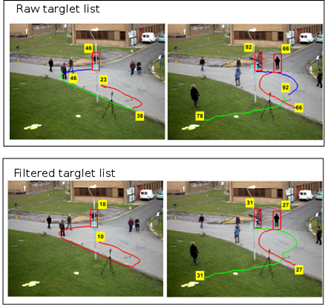
Figure 8 This figure shows the result of the concatenation procedure on a set of targets. The first row shows unconcatenated targets corresponding to a single pedestrian, and the second row shows concatenated results. The labels indicate the ID number of the targets at the beginning of their paths.
Fig. 8 shows an example of the concatenation procedure of targets 29 and 65. The upper image of column (a) shows the trajectories of targets 29, 32, 35 and 42. Here, the track is broken due to abrupt changes in direction. A kind of tail on their path before closing can be noticed. This corresponds to the positions where the targets have VERIFY states, and lose the pedestrian's track. The lower image of the left column shows the tails, which were filtered on a concatenated trajectory. The right column shows a different case. The trajectories of targets 65, 66, 83, and 94 correspond to the same pedestrian, but target 66 is lost due to the occlusion by a pedestrian tagged with target 62. The lower image shows the concatenated result.
6. Experimental setup
6.1. Video sequences used for the tests
The system was evaluated in two public datasets. The first one is the PETS2009 dataset, task S2.L1 (view 1) [22]. The sequence consists of 795 frames with 4650 annotated ROI positions corresponding to 19 pedestrians. The second is the Oxford Town Centre [23,24] dataset, which captures a pedestrian street with hundreds of people walking. The sequence was captured at 25 fps, and the total number of labeled frames is 4500. Thus, the total number of pedestrians is 230 from 71460 annotated ROIs.
6.2. Pedestrian detector training
The detection step of the target framework is performed by a cascade of boosted classifiers using the Real Adaboost algorithm. The detector was trained following the guidelines from [18], using a three-fold cross validation. The input features are the histogram of oriented level lines, HO2L, which are computed on the MFS. The resulting cascade has, on average, 23 strong classifiers, which are composed of a combination of generative and discriminative classification functions [25,26]. Training positive patches consist of pedestrian images captured from an outdoor street sequence. The total number is 6,726 positive samples [27]. The motion information of each patch is captured by the MFS, and the information employed to compute HO2L features are the St and the Ot matrices, as shown in Figs. 2 and 3. It is important to notice that the pedestrian detector is trained using people from different views and the appearance of the TownCentre and PETS2009 datasets (cross-database evaluation). The negative training set is PASCALVOC 2012, composed of 7,166 images without people [28]. The number of negatives is increased by rotating the images 90 degrees three times.
6.3. Tracking system benchmark
Two different kinds of software codes for tracking were evaluated in this paper to compare the performance of the Target Framework. The first is the HierarchyEnsemble on-line tracking algorithm proposed by Zhang [12,29]. The methodology is based on a Tracking-by-Detection algorithm combining a Mean Shift using a color appearance model, and a Kalman filter to follow the target motion dynamics. It also introduces a Tracker Hierarchy used to label each tracker as novice or expert depending on the number of templates accumulated during the tracking. The advantage of this methodology is that it does not need any calibration (it works on 2D) and the available code runs on-line. The Continuous Energy Minimization (CEM) is an off-line algorithm introduced by Milan [16,30]. It is a traditional forward and backward methodology which employs pedestrian detections to connect paths using linear approximation or splines. The final trajectories minimize a Total Energy computed using different metrics. It uses both 2D and 3D information (it needs calibration) and gives good output results.
The three tracking systems, HierarchyEnsemble, CEM, and MFS Target Framework (MFS-TF), employ pedestrian location hypotheses as input. In order to evaluate the sensitivity of the tracking algorithm with different inputs, the following files with pedestrian rois were used on the tests:
det_opencv: these files are the result of the HOG detector [10,11] applied on the TownCentre and the PETS2009 datasets, and shared in Zhang’s webpage [29].
det_autre: there are two additional detection files, one for the PETS2009 provided by Milan [30], and the other for the TownCentre dataset shared at [24].
ada_mfs_color: the pedestrian detector uses the MFS (see sec. 4.2), and a Color Texton Space (CTS) which better captures transitions between colored regions which could be lost on grayscale transformation [31].
6.4. Tracking evaluation
We have used Milan's code [30] implementing the CLEAR MOT metrics to test the performance of the target framework on the datasets. The multiple object tracking accuracy (MOTA) evaluated the tracking performance considering the false negative rate, false positive rate, and number of identity switches. The multiple object tracking precision (MOTP) measured the precision of the tracker computing an overlap ratio of the estimated position for matched true pedestrian-target pairs. For the MOTP, as in [13], a score of 50 percent was considered as significant for tracking, like the Pascal VOC Challenge [20]. False Negatives (FN) indicate the number of missed pedestrians. This score is closely related to the performance of the detector. False Positives (FP) measure the number of targets ROIs not matched to a pedestrian position. The other scores are False Alarms per Image (FPPI), the number of ground true (GT) unique pedestrians on the sequence and Mostly Tracked (MT) pedestrians.
7. Results and discussions
This section presents and discussed the results of the different detection files and the performance of the three tracking systems on the datasets.
7.1. Pedestrian detection performance
The performance of the tracking algorithms is closely related to pedestrian hypotheses provided by the detectors. Table 1 presents the results of the different detection files on the datasets. The first column indicates the name of the detection file's, and the second is the total number of pedestrian rois in the sequence. The correct detection percentage is shown on column Det. The other metrics, FN, FP and FPPI, were introduced in the “Tracking Evaluation” section. It is worth noticing that the PETS2009 dataset will be evaluated without using a region of interest, as suggested in many papers of the state-of-the-art. This reduces our Det ratio and increases the number of FP, compared with those papers. The best performance of the detectors is found in the PETS2009 dataset. This is the noiseless sequence, with a simple static background. People walk without blocking each other, and there are no other moving objects on the scene.
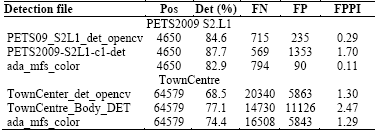
The Town Centre sequence has a cluttered background, i.e. there are mannequins on the shop windows which are considered as pedestrians by the classifiers. In addition, pedestrians mask, either totally or partially, other people along their paths. This effect is especially remarkable when people are far away from the camera, and their size is small. It is then possible to conclude that the number of distracters for the detectors is more important in this sequence than in the first one. This would account for the decreased performance. As can be seen in Table 1, the MFS Adaboost detector works at an operational point which minimizes FP. On the other hand, the operational point of PETS2009-S2L1-c1-det and TownCentre_Body_DET maximizes the Det ratio, but increases by 15 and 1.9 times the FP number for the PETS2009 and TownCentre, respectively. The corresponding opencv classifier files have a behavior comparable to the MFS classifiers. However, with similar FP values, the MFS classifiers have lower FN values (miss rate).
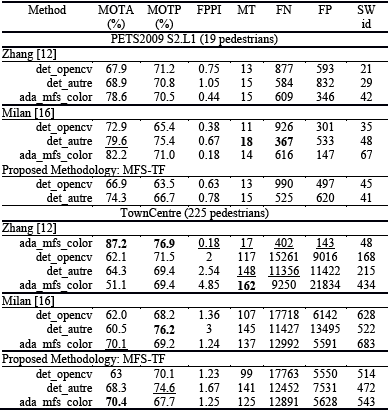
7.2. Results of the tracking systems
The best performance on the MOTA metrics was obtained by MFS-TF using the ada_mfs_color detection file. MFS-TS also gets the highest MOTP metric ratio, which proves that the tracking algorithm generates targets that correctly overlap the pedestrian positions. When MFS-TS works with accurate detection files with a low miss rate and a low FP, such as the ada_mfs_color and det_opencv files, the behavior outperforms the other tracking systems in almost all the datasets. In the case of ada_mfs_color, our tracking algorithm improves the FN metric (related to the miss rate), increasing the number of the original detections by 290 for PETS2009, and 3600 for TownCentre. At the same time, the number of FP remains at very low values. The number of targets created by the algorithm is low, similarly to the SWIDs number showing that each pedestrian is well tracked. When MFS-TF works with detectors at different operational points, the improvements are less remarkable.
Table 2 Evaluation scores for tracking results. The best scores are in bold and the second best results are underlined.
Source: The Authors
The HierarchyEnsemble algorithm [12] has the lowest number of tracks between the methodologies. It is related to the use of several color templates for each track. Therefore, a new track is created with a novice state if a detection has not matched the active tracks and the saved templates. It is also robust when occlusions happen, or when a pedestrian was lost from sight for some frames. This is the reason why the Hierarchy Ensemble has the highest MT score on TownCentre set. This methodology is very sensitive to the detectors with a high number of FN and FP. The analysis shows that those detections are noisy (central point and size of the roi), hindering the recollection of the pedestrian templates, and increasing the number of false tracks.
The CEM algorithm, developed by Milan et al. [16], uses a backward and forward growing path to complete non-detected pedestrian positions, obtaining a high score on MT. In general, it shows a better performance than Zhang's algorithm. It is also robust against noisy detections, because the track paths are obtained using interpolations (linear or spline). The main problem of this algorithm arises when the number of FP is high, such as in the case of the det_autre file for the TownCentre dataset. In those situations, the non-filtered FP draws an erroneous path, which, in turn, increases the FP number.
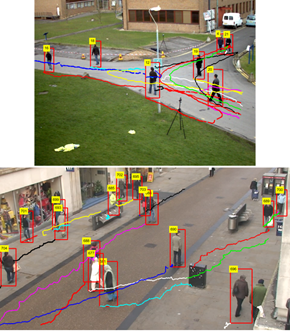
Source: The Authors.
Figure 9 The figure shows the targets and their trajectories computed by our analysis. Each target trajectory is plotted with a different color.
The results of our analysis are plotted on Fig. 9, where the pedestrians' trajectories are depicted using different colors indicating that a new target captured their paths. Table 2 reports the scores of the Target Framework, and the other two tracking methodologies applied on the four sequences following the CLEAR MOTS metrics [19]. The best results are in bold and the second best results are underlined.
8. Conclusions
The pedestrians' dynamics was successfully detected and tracked using the proposed Target Framework. The MFS used on the detection stage obtained accurate hypothesis detections. It also built an Appearance field which correctly followed pedestrians lost by the detector.
Future work will involve improving the overall system. For tracking purposes, the development of additional features should help to perform the tracking on the MFS without the necessity to work on still spaces (color histograms, etc.). Furthermore, the target state machine could be improved by adding other states, for example, to detect complex pedestrian behavior.

